Lupine Publishers- Organic and inorganic chemical sciences

The analysis of the impurity content crystals grown in sodium carbonate solution is carried out using flame technique. Colored crystals have been produced from aqueous solutions of potassium carbonate under laboratory conditions and using a steel autoclave. The seeds were slices cut parallel to the planes (0001). With the impurity of aluminum and irradiation, defective color centers have generated quartz coloration phenomenon. This is occurred on the base of the electrical balance by exchanging aluminum ions with tetravalent silicon ions in the presence of alkali elements (monvalent) i.e. Na+ or Li+. Interestingly, the current paper introduces a method suggests the utilization of silica-rich rocks to develop the growth of large crystals of synthetic quartz.
Keywords: Metallic impurity, Quartz, Crystalline, Piezoelectric, Aluminum, Flame photometric emission
Until recently, all the quartz required for the production of
oscillator crystals for frequency control has been obtained from
natural resources. Although quartz is one of the most abundant
minerals in the earth’s crust, it is only found in large crystals of the
required quality in a few isolated regions. During the past 20 years,
work has been carried out to develop processes for the controlled
growth of quartz in the laboratory [1,2]. Considerable success has
been obtained by many teams [3], crystals of piezoelectric-quality
weighing over 1 lb. having been grown [4]. All the modern processes
used for the growth of synthetic quartz have been developed by
pioneering works [5,6] in the current century. Although the methods
adopted by various workers in this field are basically similar, there
are certain fundamental differences which affect the properties of
the crystals. Because of its glass forming properties and its allotropic
modifications it is not possible to grow quartz from the vapor or the
melt. Growth from solution must be used and as quartz is virtually
insoluble in aqueous media under ordinary ambient conditions it
is necessary to use elevated temperatures and pressures to obtain
sufficient solubility. These so-called hydrothermal conditions are
probably similar to those in which much natural quartz has been
formed. At temperatures approaching 400°C and pressures of
1000 atm (about 7 tons/in.2) quartz is readily soluble in alkaline
solutions such as sodium carbonate.
Work by Dickson et al. [9] using a paramagnetic resonance technique has shown that aluminum is the impurity which affects the quality of synthetic quartz crystals grown from class B materials using the standard sodium carbonate solution. This result has been corroborated by spectrographic analysis on a number of specimens. In addition, the direct test has been made by deliberately adding aluminum in a number of forms along with a pure quartz nutrient. Such adulterated quartz now acts as a class B nutrient and crystals grown from it using the standard solution have the habit and poor quality of a crystal grown under similar conditions from flint or a class B quartzite. Further, by using the modified solution, the defects can again be overcome. Figure 3 shows four crystals which illustrate this result. The crystals from left to right were grown from nutrients and in solutions. The most notable feature which can be seen from the photograph is the nature of the growth surface approximating to (0001). This surface is smooth on the crystals grown from quartz in sodium carbonate solution and from quartz with aluminum in the modified solution, but it is rough and pitted in the case of the crystals grown from flint and from quartz with aluminum, in sodium carbonate solution. It will be shown that the nature of the growth surface is closely related to the manner in which aluminum is incorporated in synthetic quartz grown on Z-cut seeds.
Specimens cut from the crystals shown in Figure 13 have been analyzed for aluminum and sodium using spectrographic and flame photometric techniques, respectively. The results are given in Table 2 in terms of the percentage atomic replacement of silicon by these elements have showed that the concentrations of sodium and aluminum are of the same order for low concentrations of aluminum added to the nutrient. This can be attributed to the sodium content tendency to saturate while the aluminum content continues to increase. It seems reasonable to conclude that the substitutionally added aluminum is associated with a sodium atom situated interstially. This centre would be responsible for the visible darkening produced by X-irradiation [11], a model consistent with that suggested by Ratheneau [12]. The excess aluminum found when the concentration added to the nutrient is large, could be present either as interstitial atoms or as two substitutional atoms associated with an oxygen vacancy. There is, at present, no evidence to distinguish between these two alternatives. In discussing the incorporation of impurities in synthetic quarts, some mention must also be made of work which has been carried out in attempts to include impurities other than aluminum [13]. It is well known that small monovalent ions in particular lithium and sodium can readily be introduced into the quartz lattice under the action of an electric field. These ions lie interstitially in the “tunnels” which are parallel to the c-axis in the quartz structure. It has already been shown that sodium is present in all synthetic quartz grown by the authors. Attempts have been made to introduce a number of other elements which might be expected to substitute for silicon in the lattice. In general, it has been found extremely difficult to introduce impurities into quarts grown on the basal plane. This result would appear to be different from that found by other workers in this field who have used seeds cut parallel to the minor rhombohedral face. In addition to aluminum, attempts have been made to incorporate the elements in growth on Z-cut seeds. Of these elements only, germanium has been successfully incorporated. Bearing in mind the similar ionic radii of silicon and germanium, it is not surprising to find that germanium will readily go into quartz as a substitutional impurity. Large amounts of germanium can be taken up by the quartz lattice without setting up measurable strain. As would be expected, the centre is not sensitive to X-irradiation. It is interesting to note that boron is not taken up, although its small size and its valence of three would, at first sight, make it an ideal atom for incorporation in the quartz lattice. No explanation is known for this behavior.
The recent investigation, still incomplete, has shown that the
nature of the cation in the solution from which the crystals are
grown can have a considerable effect on the way in which impurities
are incorporated in synthetic quartz. An investigation of the type
described can be of value to the worker studying color centers in
quartz in a number of ways.
a. The process described for the growth of large crystals of synthetic quartz can provide material with total impurity content, and particularly substitutional aluminum content, lower than is found in natural quartz. This is of value to the worker, studying radiation damage in quartz. With regard to the substitutional aluminum content, it must be noted that the concentration in a number of specimens grown under nominally similar conditions will differ slightly and partly as a result of the statistical nature of the process and also as a result of variations in the purity of the nutrient.
b. Controlled amounts of the impurities present in natural quartz can, in certain instances, be introduced. This can be of considerable assist in identifying the nature of those color centers which are impurity-dependent.
c. By the introduction of impurities not found in natural quartz, material with new properties can be grown. For example, if sufficient chromium can be introduced into the green quartz it may be possible to obtain quartz which is paramagnetic.

The analysis of the impurity content crystals grown in sodium carbonate solution is carried out using flame technique. Colored crystals have been produced from aqueous solutions of potassium carbonate under laboratory conditions and using a steel autoclave. The seeds were slices cut parallel to the planes (0001). With the impurity of aluminum and irradiation, defective color centers have generated quartz coloration phenomenon. This is occurred on the base of the electrical balance by exchanging aluminum ions with tetravalent silicon ions in the presence of alkali elements (monvalent) i.e. Na+ or Li+. Interestingly, the current paper introduces a method suggests the utilization of silica-rich rocks to develop the growth of large crystals of synthetic quartz.
Keywords: Metallic impurity, Quartz, Crystalline, Piezoelectric, Aluminum, Flame photometric emission
Introduction
Materials and Methods
Crystal Growing Technique
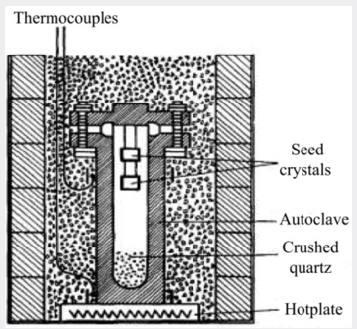
A schematic diagram of the apparatus used by the authors is shown in Figure 1. In what will be called the standard process, a steel autoclave constructed to withstand high pressures has seed crystals suspended from the lid and a supply of crushed meltinggrade quartz at the bottom. The autoclave is about 80% filled with a solution containing 88 g/L of sodium carbonate and sealed. The simple furnace used consists of a hotplate on which the autoclave stands surrounded by micaceous-flake thermal insulation. By this means a temperature gradient is established so that it is hotter at the bottom in the region of the nutrient crushed quartz than at the top where the seeds are located. Under the working conditions, the autoclave is filled with a single-phase fluid. The pressure developed being a function of the temperature and of the percentage of the space originally occupied by the solution at room temperature. The temperature at the base of the autoclave is controlled at about 400°C and the temperature at the seeds reaches equilibrium some 40°C lower. The temperature gradient along the length of the autoclave is not uniform, a fall of about 20°C occurring across the metal at the base and most of the remaining drop being across the nutrient. The space above the nutrient is approximately isothermal and the supersaturation in this region remains constant. Thus, crystals can be grown at approximately the same rate of growth in any part of the autoclave.
Figure 1: Diagram of apparatus for the growth of
synthetic quartz.
For a given design of the autoclave, the rate of growth is
dependent on seed orientation, pressure, temperature and
temperature differential. The seed orientation which has been
adopted in most of the work to be described is the basal plane or
Z-cut. Figure 2 shows the relation between this cut and the minor
rhombohedral or T-cut which has also been used as a seed for
the growth of synthetic quartz. It is shown subsequently that the
seed orientation not only affects the rate of growth but also has a
marked effect on the way in which impurities are incorporated in
the crystal. It is most convenient to control the rate of growth by
means of the temperature difference and this is done by adjusting
the flow of solution but not exceed a certain maximum, which, for
the conditions used in the standard process, is about 0.5mm/day
on each side of the seed measured in the direction of the optic axis.
In fact, the visual quality is in some respects a misleading criterion
and the measurements of the mechanical damping recorded in Table
1; show that a progressive improvement in crystalline perfection
takes place as the growth rate is reduced. As it happens, for most
practical applications the quality corresponding to 0.5mm/day
is adequate but for especially stringent requirements it may be
necessary to employ a lower growth rate or an alternative growing
technique. A small pilot plant has been set up to grow crystals by
the standard process. A growth of 15mm takes place in a period of
about a month, the resulting crystals weighing about 135g.
Figure 2: Relationship between crystals grown on the
basal plane (Z-cut) and the minor rhombohedral plane
(z-cut).
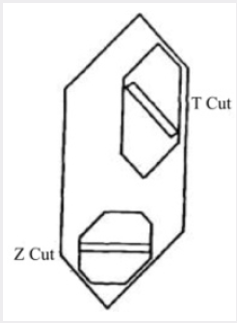
Table 1: Mechanical damping of quartz

Results and Discussion
Influence of impurities
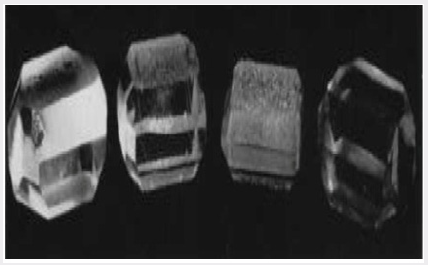
The standard process recrystallizes a low-grade quartz-which due to size and imperfections such as twinning is unsuitable for piezoelectric use into crystals of a size and quality which are ideally suited to this purpose. However, the melting grade quartz used as nutrient still has to be imported and considerable work has been carried out over the last 5 years to develop processes which can be used with relatively impure nutrient materials. Reasonable success has been obtained using flint and a variety of quartzites. Early in this investigation it was found that quartz could be grown on Z-cut seeds using impure nutrient materials, but that the quality, particularly of large crystals, was not good enough for piezoelectric use. It is now known that the poor quality is due to the incorporation of impurities in the synthetic crystal during growth. However, it was found that it was possible to grow crystals of piezoelectric quality by modifying the solution in which the crystals were grown. Good crystals have been grown from flint and impure quartzite by using a solution containing 40g/L Na2CO3, 33g/L NaOH, and 3.4g/L NaF. Further examination of a number of different quartzites showed that many of them could be used satisfactorily with the standard process; these are referred to as class A quartzites. It is now known that the difference between class A and class B quartzites (class B being those quartzites which require the modified process) lies in the type of accessory minerals which are associated with the quartz. In particular, the structure of the feldspar, which is commonly the primary accessory mineral in quartzites, plays an important role in deciding whether the material will be class A or B [7,8].Work by Dickson et al. [9] using a paramagnetic resonance technique has shown that aluminum is the impurity which affects the quality of synthetic quartz crystals grown from class B materials using the standard sodium carbonate solution. This result has been corroborated by spectrographic analysis on a number of specimens. In addition, the direct test has been made by deliberately adding aluminum in a number of forms along with a pure quartz nutrient. Such adulterated quartz now acts as a class B nutrient and crystals grown from it using the standard solution have the habit and poor quality of a crystal grown under similar conditions from flint or a class B quartzite. Further, by using the modified solution, the defects can again be overcome. Figure 3 shows four crystals which illustrate this result. The crystals from left to right were grown from nutrients and in solutions. The most notable feature which can be seen from the photograph is the nature of the growth surface approximating to (0001). This surface is smooth on the crystals grown from quartz in sodium carbonate solution and from quartz with aluminum in the modified solution, but it is rough and pitted in the case of the crystals grown from flint and from quartz with aluminum, in sodium carbonate solution. It will be shown that the nature of the growth surface is closely related to the manner in which aluminum is incorporated in synthetic quartz grown on Z-cut seeds.
Figure 3: Crystals grown to illustrate the importance of
aluminum as an impurity in low-quality nutrients.
It has been known for some time that when natural quartz is
irradiated with X-ray or any other ionizing radiation, the material
darkens. Grasse et al. [10] studied this phenomenon in detail and
showed that the darkening produced in natural quartz is often
non-uniform showing a banded structure. The darkening occurs in
sheets parallel to the major rhombohedral planes and is therefore
connected with the growth of the crystal, probably being associated
with changes in the environment in which the crystal grew. When
large crystals of synthetic quartz were first grown by the authors,
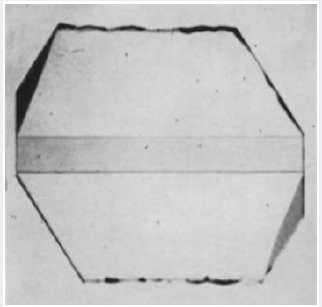
their behavior under X-irradiation was determined. Figure 4 shows
the result of irradiating an X-cut section of a synthetic quartz
crystal grown on a Z-cut seed. It can be seen that the central region
corresponding to the natural quartz seed has darkened uniformly
and that there are two regions beneath the minor rhombohedral
faces which have also darkened rather more intensely than has
the seed. The remainder of the synthetic growth has not darkened
under this dose. The diagram in Figure 5 shows the region under
the minor rhombohedral face on a larger scale. The triangular
region abc corresponds to growth which has taken place on the
minor rhombohedral face as it develops. Spectrographic analyses
of material taken from various regions of a number of crystals
grown by the standard process have shown that the total aluminum
concentration in the growth on the Z-cut orientation is commonly
less than 40 parts in 106 atomic replacements. However, in the
growth under the minor rhombohedral face the aluminum content
may be 10 times this figure, i.e. 400 parts in 106. The impurity
content of the melting-grade nutrient lies between these two
figures and the low aluminum concentration in quartz grown on
a Z-cut seed is in part due to the “scavenger action” of the growth
on the minor rhombohedral faces which are formed during the
growth. This also illustrates a general result found in the growth
of synthetic quartz, namely that it is easier to introduce impurities
during growth on the minor rhombohedral face than on the basal
plane.
Figure 4: Photomicrograph of an X-cut section from a
synthetic quartz crystal grown on a Z-cut seed from a
pure melting-grade quartz nutrient after X-irradiation.
If, however, there is a large excess of aluminum in the system,
it is found that the crystals grown on the basal plane will darken
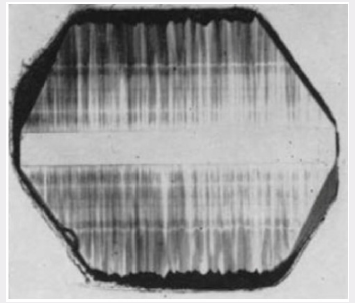
readily in a characteristic way as shown in Figure 6. In addition to
the darkening of the seed crystal and the growth under the minor
rhombohedral face, there is darkening of the primary growth in
the form of distorted narrow-angled cones directed along the c-axis. These cones terminate in the rough, pitted growth surface
and are apparently associated with the pits. This can also be seen
from the bands which run parallel to the seed surface. These bands
which are regions of either more or less intense darkening than the
surrounding material are reproduced precisely on both sides of the
seed. It can, therefore, be deduced that these bands are produced
either by changes of the temperature or pressure in the autoclave
or, what is more likely, by changes in the concentration of aluminum
in the solution. These bands will therefore represent the nature of
the growth surface at the particular time when they are formed.
The discontinuities in these bands tend to follow the boundaries
between the cones of darkening.
Figure 5: Diagram showing the X-ray darkening of
quartz deposited in the accessory growth on the minor
rhombohedral face.
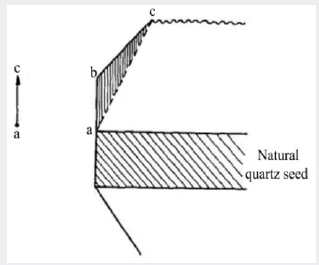
Figure 6: Characteristic X-ray darkening pattern found in
an X-cut section of a synthetic quartz crystal grown on a
Z-cut seed in the presence of a large excess of aluminum.
Mechanism of growth
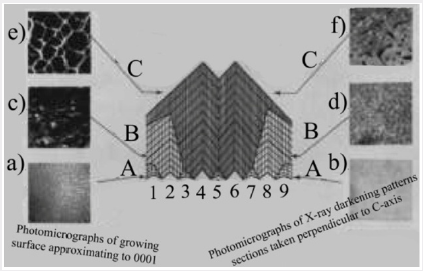
The characteristic cone darkening structure can be used to obtain a model for the mechanism of growth on the basal plane. This is illustrated in Figure 7. It is assumed that growth takes place independently on a large number of centers in contrast to growth on a habit face where only a limited number of centers are active and growth takes place by sheets spreading across the growth surface. The growth centers on the basal plane may be associated with spiral dislocations but there is, as yet, no direct evidence for growth spirals. If it is now assumed that quartz is deposited on the individual centers at different rates it will be seen that those which are growing faster overtake their more slowly growing neighbors and render them inactive. In the schematic diagram in Figure 7, all nine centers are active at the beginning of the growth; at later stage only centers 2, 4, 6 and 8 are active and eventually only centers 4 and 6. If the aluminum incorporation is uniform on any one growth centre but differs from one to the next, it will be seen that this gives rise to the characteristic darkening pattern. Figure 7 also shows photomicrographs of the growth surfaces at various stages in the growth together with darkening patterns at similar stages for sections cut perpendicular to the c-axis. The individual “cobbles”, which are the termination of the growth cones in the surface of the crystal, and the tine structure in the darkening patterns both tend to become coarser as the growth proceeds. This is in agreement with the suggested growth mechanism.
Figure 7: Illustrating the mechanism of growth of
synthetic quartz on Z-cut seeds.
The nature of the rough, pitted growth surface obtained when
quartz is grown on the basal plane in the presence of a large excess
of aluminum cannot be directly explained in terms of the suggested
mechanism. Figure 8a is a photomicrograph of the surface and
shows clearly that the pits have no obvious crystallographic
orientation. However, crystals have been grown with only just
sufficient aluminum present in the system to commence the
incorporation of aluminum by the above mechanism. In this case,
the aluminum apparently only goes into the growth on isolated
centers and produces a growth surface of the type shown in Figure
8b. It will be seen that certain of the larger cobbles have triangular
pits at their centre. The relation between these pits and the rough
growth surface produced by a large excess of aluminum is shown
in Figure 8c and 8d. Figure 8c shows the growth surface of a crystal
grown in the presence of a somewhat larger concentration of aluminum than that of Figure 8b. The pits are here more numerous
and are commencing to overlap so that they interfere and lose their
obvious crystallographic orientation. The crystal shown in Figure
8d has a rough surface similar to that in Figure 8a and has been
lapped to remove most of the disturbed surface. The bottoms of
the pits of the rough surface show approximately the same form as
those in Figure 8b. The characteristic rough surface is, therefore,
formed from a large number of pits which overlap and interfere
until the shape and symmetry of the pits is completely lost.
Figure 8: The nature of the rough growth surface formed in the presence of a large excess of aluminum. (a) Rough growth
surface. (b) Isolated pits. c) Interfering pits. d) Rough surface after most of the damage has been removed by lapping.
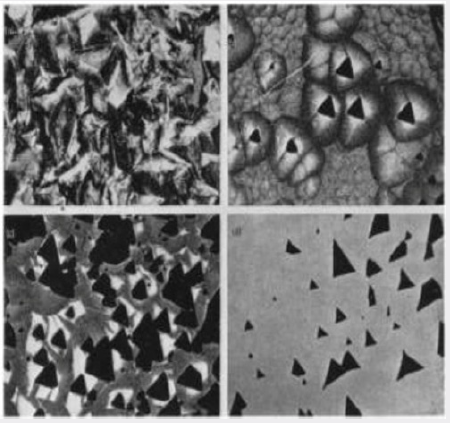
Figure 9: Diagram of a pit formed at the center of a
growth cobble.
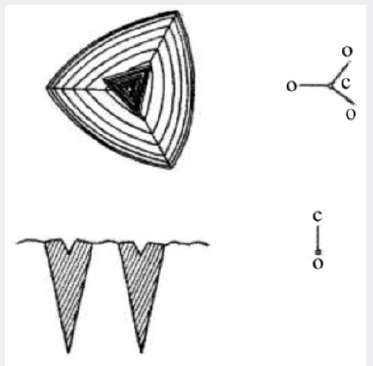
The nature of the individual pits is more readily seen by
reference to Figure 9, which shows a diagram of a single cobble and
its pit. The sides of the pit form reasonably flat faces which have
been indexed using a microscope. The reason for the formation
of such a high index face, if it is a true face, in the presence of
excess aluminum is not understood. Figure 9 also shows a section
containing the c-axis. If as appears likely, the pit is associated with
the incorporation of aluminum, on irradiating such a section the
growth cones giving rise to the cobbles with pits at their centers
will darken readily. This is shown diagrammatically in Figure 9
while Figure 10 shows a photomicrograph which clearly illustrates
this phenomenon. It has been seen that when crystals are grown
in a large excess of aluminum, this aluminum is not incorporated
uniformly in the crystal as it grows but is taken up preferentially
on certain centers at the expense of the neighboring centers. As the
lattice spacing will be a function of the aluminum concentration, it
is reasonable to expect that strains will be set up at the boundaries
between regions of different aluminum content. This strain can
be seen readily by examining sections cut either parallel to or
perpendicular to the c-axis in a polarizing microscope between
crossed nicols. Parallel to the c-axis there are deep fissures found
under the rough growth surface where the stress exceeds that
necessary to produce fracture. Instead of the crystal appearing dark
as it should in the extinction position, the field is crossed by bands
of light and dark produced by the strain. The same phenomenon
is, perhaps, more readily studied by examining sections cut
perpendicular to the c-axis. Depending on the angle between the
polarizer and analyzer the section should appear to be a uniform
color when viewed in white light. Instead, a section cut from a crystal which has non-uniform aluminum incorporation will have
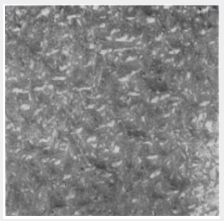
a mottled appearance. This is shown in Figures 11 & 12, which are
photomicrographs of two sections of the same crystal, Figure 11
being taken near the seed crystal and Figure 12 near the end of the
growth. This again illustrates the way in which the number of active
growth centers decreases during the growth. In this particular
example, the density of active centers has decreased by a factor of
the order of 20 in about 5mm of growth along the c-axis.
Figure 10: Photomicrograph of an X-cut section showing
the relationship between the cones of darkening and the
pits.
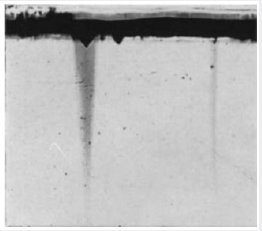
Figure 11: Strain pattern observed in crossed nicols in
a Z-cut section of a crystal containing a large excess of
aluminum (Section taken near seed/growth interface).
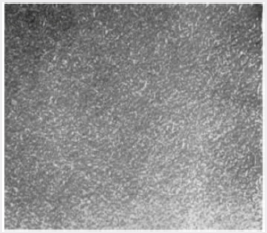
Figure 12: As Figure 11, Section taken near end of growth.
Comparison of the results of experiments in which crystals
are grown on Z-cut seeds in the presence of high and low
concentrations of aluminum shows that the mechanism by which
aluminum is incorporated in the growing crystal is dependent
on the concentration of impurity in the system. This has been
studied more closely by a set of controlled experiments in which
the concentration of aluminum, added as y-alumina, was steadily
increased. Six crystals grown in the presence of aluminum
deliberately added to the nutrient in proportions varying from 0.05
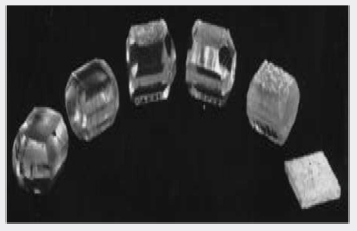
to 2.50% by weight are shown in Figure 13. The concentration of
aluminum added to the nutrient for the six crystals numbered 1 to
6 from left to right is given in the caption. Examining the nature
of the growth surface, it will be seen that the first two crystals
show no obvious signs of the inclusion of aluminum. By contrast,
crystals 3-5 show the characteristic rough growth surface, crystal
5 being so strained that the growth is hardly single crystalline.
With 2.5% aluminum added to the nutrient (crystal 6) all growth
is prevented. Further experiments carried out using concentrations
of aluminum in the range 0.10-0.25%, show that the results are
not consistent, in that a number of experiments carried out with
the same aluminum concentration sometimes give a rough growth
surface corresponding to non-uniform impurity incorporation and
at other times give the smooth cobbled surface of the pure crystal.
This behavior can be explained in terms of the suggested growth
mechanism as follows in this paragraph. For low concentrations
of aluminum in the system, the incorporation apparently takes
place uniformly. Most of this aluminum is probably interstitial as
the material only darkens slightly under X-irradiation. For high
concentrations, it has been seen that the aluminum is taken up
preferentially on certain growth centers. This can be understood,
when it is considered that the energy required introducing an
impurity atom is a function of the number of impurity atoms
already incorporated in the growth on this centre. As the number of
impurity atoms incorporated increases, the distortion of the lattice
becomes greater and it becomes easier to include more impurity
atoms. Thus, once the concentration of aluminum in the growth on
a given centre exceeds a certain figure, further aluminum atoms will
tend to be taken up preferentially on this centre at the expense of the
neighboring centers. In a physical system of this type, the probability
that non-uniform inclusion will take place and is a rapidly changing
function of the concentration of impurity in the nutrient. It can be
seen that this qualitative analysis explains the observations. For
low concentrations of aluminum, the probability of non-uniform
take-up is very small. As the concentration is increased the stage
is reached where there is a reasonable chance that the aluminum
is incorporated non-uniformly. This is the region where the results
will not be consistent. At still higher concentrations, non-uniform
inclusion will be the rule.Specimens cut from the crystals shown in Figure 13 have been analyzed for aluminum and sodium using spectrographic and flame photometric techniques, respectively. The results are given in Table 2 in terms of the percentage atomic replacement of silicon by these elements have showed that the concentrations of sodium and aluminum are of the same order for low concentrations of aluminum added to the nutrient. This can be attributed to the sodium content tendency to saturate while the aluminum content continues to increase. It seems reasonable to conclude that the substitutionally added aluminum is associated with a sodium atom situated interstially. This centre would be responsible for the visible darkening produced by X-irradiation [11], a model consistent with that suggested by Ratheneau [12]. The excess aluminum found when the concentration added to the nutrient is large, could be present either as interstitial atoms or as two substitutional atoms associated with an oxygen vacancy. There is, at present, no evidence to distinguish between these two alternatives. In discussing the incorporation of impurities in synthetic quarts, some mention must also be made of work which has been carried out in attempts to include impurities other than aluminum [13]. It is well known that small monovalent ions in particular lithium and sodium can readily be introduced into the quartz lattice under the action of an electric field. These ions lie interstitially in the “tunnels” which are parallel to the c-axis in the quartz structure. It has already been shown that sodium is present in all synthetic quartz grown by the authors. Attempts have been made to introduce a number of other elements which might be expected to substitute for silicon in the lattice. In general, it has been found extremely difficult to introduce impurities into quarts grown on the basal plane. This result would appear to be different from that found by other workers in this field who have used seeds cut parallel to the minor rhombohedral face. In addition to aluminum, attempts have been made to incorporate the elements in growth on Z-cut seeds. Of these elements only, germanium has been successfully incorporated. Bearing in mind the similar ionic radii of silicon and germanium, it is not surprising to find that germanium will readily go into quartz as a substitutional impurity. Large amounts of germanium can be taken up by the quartz lattice without setting up measurable strain. As would be expected, the centre is not sensitive to X-irradiation. It is interesting to note that boron is not taken up, although its small size and its valence of three would, at first sight, make it an ideal atom for incorporation in the quartz lattice. No explanation is known for this behavior.
Figure 13: Crystals grown in the presence of increasing
concentrations of aluminum. Aluminum by weight of
quartz nutrient: (1) 0.05%, (2) 0.125%, (3) 0.25%, (4) 0.50%,
(5) 1.25%, and (6) 2.50%.
Coloration
A striking example has been the growth of intensely colored emerald green quartz, a variety which does not occur naturally. From the circumstances in which this crystal was grown, it has been deduced that the coloration is produced by the presence of a trace of chromium [13]. This diagnosis has still to be confirmed. The coloration in this crystal is very stable, being unaffected by heat treatment up to the a-ß inversion temperature or by prolonged X-irradiation. Preliminary transmission measurements show that the material has an apparent cutoff in the ultraviolet at 2800 Ǻ. It appears likely that this synthetic material is not related to the “greened” amethyst described by Samoylovich [14].
Table 2: Sodium and aluminum concentrations in synthetic
quartz grown in Na2CO3 solution on Z-cut seeds in the presence
of aluminum.
Conclusion
a. The process described for the growth of large crystals of synthetic quartz can provide material with total impurity content, and particularly substitutional aluminum content, lower than is found in natural quartz. This is of value to the worker, studying radiation damage in quartz. With regard to the substitutional aluminum content, it must be noted that the concentration in a number of specimens grown under nominally similar conditions will differ slightly and partly as a result of the statistical nature of the process and also as a result of variations in the purity of the nutrient.
b. Controlled amounts of the impurities present in natural quartz can, in certain instances, be introduced. This can be of considerable assist in identifying the nature of those color centers which are impurity-dependent.
c. By the introduction of impurities not found in natural quartz, material with new properties can be grown. For example, if sufficient chromium can be introduced into the green quartz it may be possible to obtain quartz which is paramagnetic.
Follow on Linkedin : https://www.linkedin.com/company/lupinepublishers
Follow on Twitter : https://twitter.com/lupine_online


 and
and  with 2, 8, 10 and 12 valence electrons,
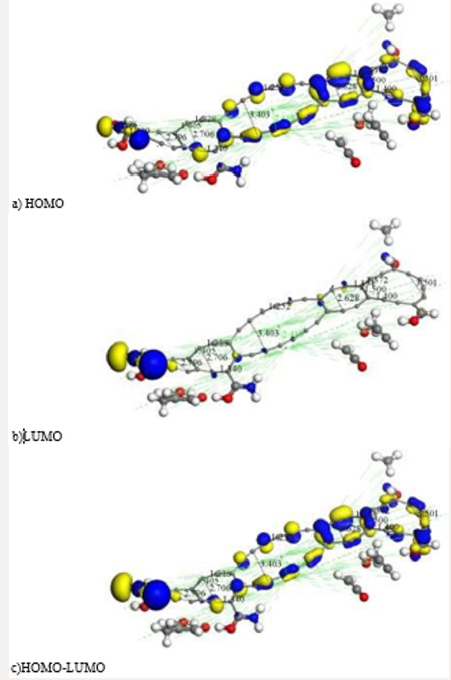
respectively. Actually, the reactivity sites in a molecule correspond
to the highest occupied molecular orbitals (HOMO) and lowest
unoccupied molecular orbitals (LUMO). HOMO as base (donor), and
LUMO as acid (acceptor) are particularly important MOs to predict
reactivity in many types of reaction [28,29]. Activated carbon and
chitosan have been independently applied as sorption materials to
increase environmental quality standards. Then, we expect AC-Ch
nanocomposite to have a powerful handleable adsorption property
of pollutants that can be applied not only in wastewater treatment,
but also in medicine against intoxication, in batteries to increase
storage capacity, in electrodes of fuel cells, and in more possible
applications, according to the pore size distribution to be generated
on this new material.
with 2, 8, 10 and 12 valence electrons,
respectively. Actually, the reactivity sites in a molecule correspond
to the highest occupied molecular orbitals (HOMO) and lowest
unoccupied molecular orbitals (LUMO). HOMO as base (donor), and
LUMO as acid (acceptor) are particularly important MOs to predict
reactivity in many types of reaction [28,29]. Activated carbon and
chitosan have been independently applied as sorption materials to
increase environmental quality standards. Then, we expect AC-Ch
nanocomposite to have a powerful handleable adsorption property
of pollutants that can be applied not only in wastewater treatment,
but also in medicine against intoxication, in batteries to increase
storage capacity, in electrodes of fuel cells, and in more possible
applications, according to the pore size distribution to be generated
on this new material. where P=(a+b+c)/2
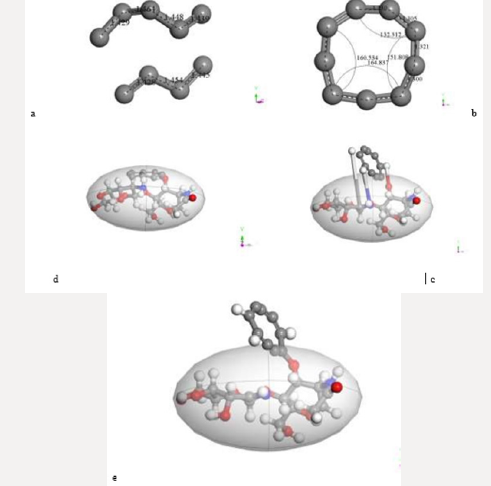
is the perimeter of a triangle of a, b, c sides; while the pore size
diameter (PSD) is calculated as an approximation to the circle area.
Periodic systems can be constructed using amorphous builder
of BIOVIA Materials Studio, these are useful to calculate Radial
Distribution Functions and the area under the curve on a significant
interval.
where P=(a+b+c)/2
is the perimeter of a triangle of a, b, c sides; while the pore size
diameter (PSD) is calculated as an approximation to the circle area.
Periodic systems can be constructed using amorphous builder
of BIOVIA Materials Studio, these are useful to calculate Radial
Distribution Functions and the area under the curve on a significant
interval.