Showing posts with label Journal of Microbiology. Show all posts

Thursday, 10 August 2023

Lupine Publishers | The Science and Biotechnology Behind Bio-E’s Marine Collagen + Caviar Daily Supplement

 Lupine Publishers | Journal of Biotechnology & Microbiology


Introduction

In light of the ascending need for high-quality oral beauty supplements, Bio-E has launched its new Marine Collagen + Caviar Daily Supplement. Containing selected rare ingredients from all over the world, the Marine Collagen + Caviar Daily Supplement is cultivated with scientific formulation, which aims at penetrating and revitalizing skin cells in order to stabilize their elastic structure, thus generating cell renewal and delaying the ageing process. Caviar contains multiple nutrients such as protein, multiple amino acids, highly unsaturated fatty acids, folic acid, vitamins and trace elements, which can promote collagen synthesis, and improve the mitochondrial function of cells while inhibiting protein cross-linking [1,2]. Due to its cell structure being similar to that of the human skin, it can be readily absorbed by the skin, thus accelerating the synthesis of collagen and increasing skin elasticity. Different varieties of microelements including more than 47 minerals and proteins, amino acids and recombinant basic fatty acids required by the skin not only effectively nourish the skin, but also keep the skin delicate and smooth and protect it against ageing [3]. Bio-E’s Marine Collagen + Caviar Daily Supplement contains carefully selected sturgeon caviar powder from France, and marine roe protein peptides harvested from Japanese salmon, to help energise billions of living cells. The highly bioavailable Japanese deep-sea salmon marine roe protein peptides are of small molecular weight at around 500 Da and contain “cytokines” that can increase the metabolism of ageing cells and revitalize new cells by IGF-1 activation, due to their abundance in amino acids, collagen, chondroitin sulphate, hyaluronic acid, elastin and so on. Benefits also include estrogen regulation that delays menopause, reduction of wrinkles and hair growth promotion [4]. Top-grade French sturgeon caviar powder has always been highly praised by aristocrats due to a traditional belief in its ability to nurture the cells, hence improving collagen regeneration as well as mitochondria function, resulting in more delicate and smooth appearances [5].

Human skin is composed mostly of type I collagen and type III collagen, accounting for 80%~85% and 10%~15% of the entirety of the skin’s collagen respectively [6]. Type I collagen mainly resides in the dermis with thick fibers, supporting the skin contour and enhancing skin elasticity. In the meantime, type III collagen exists in the superficial dermis as small fibers. The type III collagen content is at its peak when we are in fetus form, accounting for circ. 60% of the total amount of collagen. Hence the softness, elasticity and moisture of a baby’s skin are unmatched compared to those of adults. Not only is a baby’s skin extremely soft and plump, but it also possesses the ability to recover quickly after injury without leaving much of a scar, due to its high content of type III collagen. Because of this, type III collagen has also been referred to as “baby collagen” [7]. However, type III collagen dwindles continuously to less than 20% for adults, resulting in the inability of the skin to repair scars, sharply deteriorated elasticity and shrunk skin [8]. However, type III collagen diminishes continuously to less than 20% in adults, resulting in the skin’s inability to repair scars, rapidly deteriorated elasticity and collapsed looks [8].

In line with the functionalities of different types of collagen, Bio-E has formulated its marine collagen peptides complex with fish collagen peptides type I and III in conjunction with fish collagen tripeptide. The fish collagen peptides type I and III are harvested from sashimi grade salmon of the western Norwegian sea close to the Arctic Ocean, where the temperature is low throughout the year with very little human pollution. Then, a dual patented enzyme degradation technology is used to extract fish collagen peptides type I and III with over 500 active peptides, making it one of the fastest absorbing and bioavailable supplements on the market, with a digestibility of over 98%. It is also a trial tested to promote the body’s absorption of dietary iron and increase hemoglobin levels [9]. As type III collagen is highly sought after in the market due to its rarity, Bio-E’s Marine Collagen + Caviar Daily SupCurrent plement stands out as one of the few top-level products with both collagen type I and III added. Low molecule weight type I collagen peptides with thick fibers provide support for the skin, resulting in a firm and less wrinkly appearance, while type III collagen peptides with thin fibers promote the fibroblasts to further synthesize type III collagen and hyaluronic acid. In addition, a multi-patented fish collagen tripeptide is added because of its high bioavailability with a low average molecular weight between 250 to 500 Da. While most competitors are still with molecular weights between 1000 to 2000 Da, this 3rd gen collagen tripeptide achieves an absorption rate 5 times of its competitors [10]. A patented enzymatic hydrolysis technique is utilized to target cleave the “beauty fragments” GPH (Glycine-Proline-Hydroxyproline) to a global leading level of no less than 3.4%. It is certified by the Korean FDA with an efficacy claim of helping promote skin hydration. Furthermore, 3 human trials and multiple animal tests were conducted to validate its ability to help improve the plumpness and moisture in the skin, reduce the loss of hydration, diminish wrinkles caused by photoaging, and promote the synthesis of hyaluronic acid and ceramide [11-12].

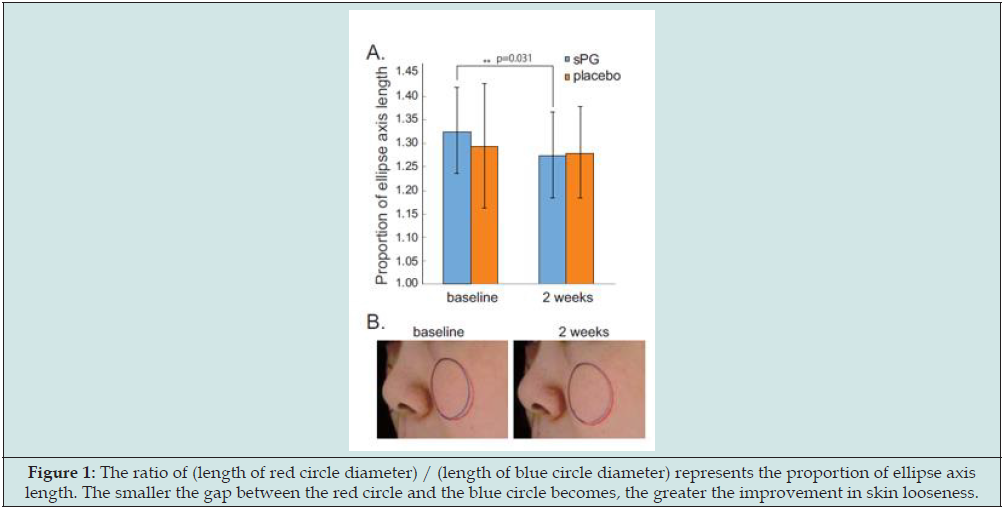
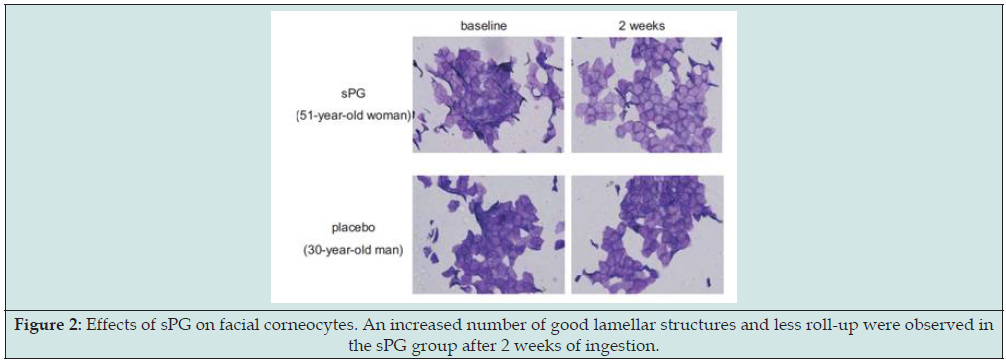
To further improve the efficacy in improving skin conditions, Bio-E incorporates proteoglycan and ceramide into its formulation, to help with the dermis’ hydration retention capacity and hydration loss prevention respectively. The proteoglycan comes from fish nasal cartilage powder of wild salmon in Hokkaido, Japan. The extraction ratio is extremely low, for only 1 kg of proteoglycan is extracted from 1600 salmons, making it one of the most expensive and exquisite inner beauty ingredients in the world. Proteoglycans can help lock in the water molecules in the multi-layers of the glycosaminoglycan chain while the unique structure of proteoglycans promotes the production of hyaluronic acid in fibroblasts, resulting in a higher hydration retention capacity than that of hyaluronic acid alone. Moreover, by combining with the EGF receptors, proteoglycans help promote the production of type I collagen, increase skin elasticity and reduce fine lines. In a randomized, double-blinded, placebo-controlled trial, ingestion of salmon nasal cartilage-derived proteoglycans showed improvement of the dermis conditions, including enhancement of skin elasticity, moisture, and smoothness, and reduction of wrinkles, facial pores, and blotches (Figure 1) adapted from reference [13]. Proteoglycans also contribute to the gut microbiota as a prebiotic, generating metabolites such as short-chain fatty acids to reduce the production of the inflammatory cytokines and improve the epidermis conditions such as lamellar structures (Figure 2) adapted from reference [13] and dry peeling [14]. The gut-skin axis is a very critical target for skin conditions and should not be ignored for any orally administered product intervention [15].

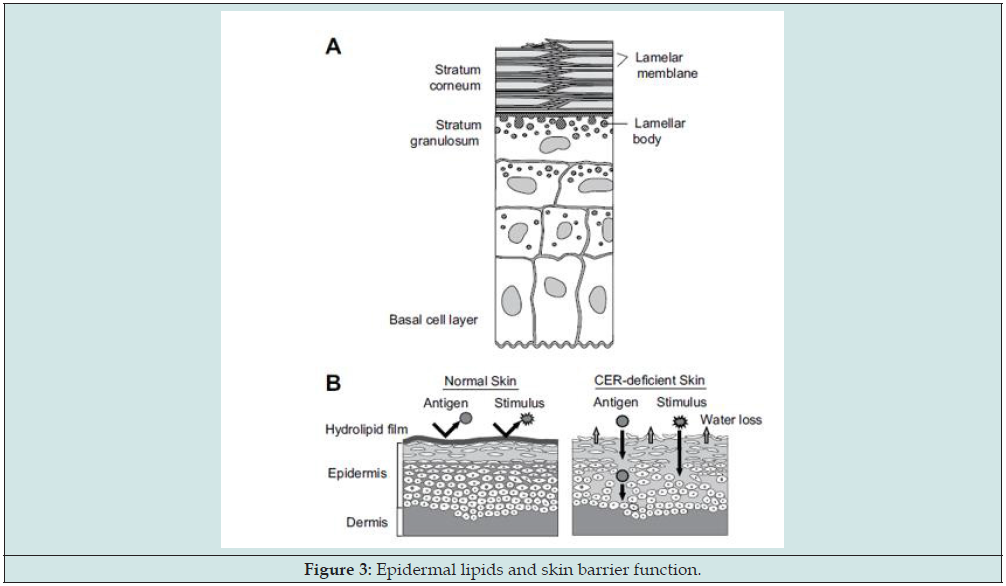
On the other hand, the prevention of water loss through the skin and defense from antigenic stimulus are critical for mammalian cells. These functions are served by the epidermal permeability barrier, which resides primarily in the extracellular domains of the stratum corneum as ceramide shown in Figure 3 adapted from reference [16].

Figure 1: The ratio of (length of red circle diameter) / (length of blue circle diameter) represents the proportion of ellipse axis length. The smaller the gap between the red circle and the blue circle becomes, the greater the improvement in skin looseness.

Lupinepublishers-openaccess-biotechnology-microbiology

Figure 2: Effects of sPG on facial corneocytes. An increased number of good lamellar structures and less roll-up were observed in the sPG group after 2 weeks of ingestion.

Lupinepublishers-openaccess-biotechnology-microbiology

Figure 3: Epidermal lipids and skin barrier function.

Lupinepublishers-openaccess-biotechnology-microbiology

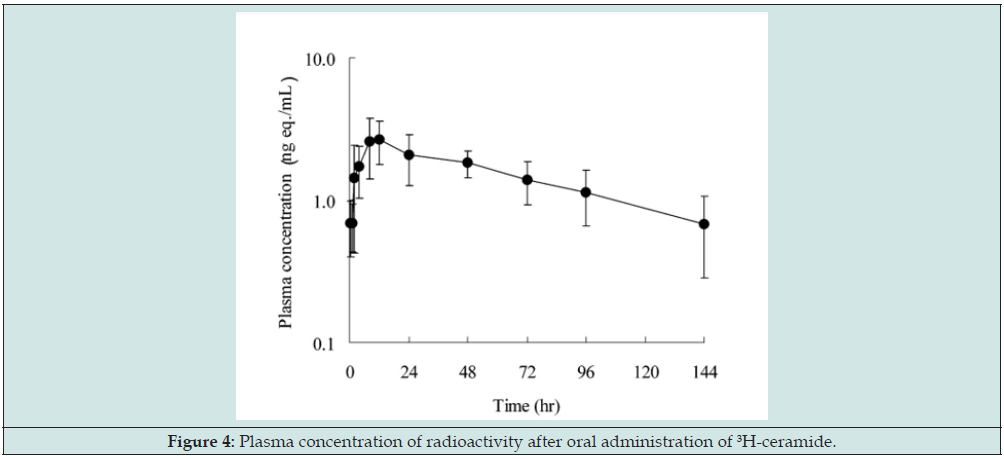
Figure 4: Plasma concentration of radioactivity after oral administration of 3H-ceramide.

Lupinepublishers-openaccess-biotechnology-microbiology

It is observed orally supplemented with a normal diet with ceramide (from rice bran and germ) for the 4 weeks reduced trans-epidermal water loss and improved stratum corneum flexibility. In Bio-E’s formula of Marine Collagen + Caviar Daily Supplement, ceramide is sourced from the precious essence of Japanese rice and comes in the form of rice bran oil powder. Only 1-2g glucose ceramide is extracted from one ton of Japanese rice through a dual-patented process. A number of clinical studies showed that this Japanese- patented ceramide can help repair corneum, establish skin protection barrier, and improve other skin problems such as dehydration, roughness, dry lines, sensitivity, redness, itching and so on [17,18]. Each tablet of Marine Collagen + Caviar Daily Supplement contains 2 mg of added ceramide, which is way higher than that of those on the market (Figure 4). The advantage of rice-derived ceramide lies in its high bioavailability for the following reasons: (1) the radioactivity concentration in the blood gradually increased to attain Cmax at 10.67 h after the administration, followed by gradual elimination with a T1/2 of 67.12 h, so it can be retained by the body for a long period (2) the rates of remaining ceramide in the body and skin were 34% and 16%, respectively, of the total absorbed ceramide, so the retention of ceramide in the body was high [19].

Last but not least, Bio-E Marine Collagen + Caviar Daily Supplement contains bonito elastin peptides, which are sourced from the aortic bulb of Japanese bonitos and research has shown that the signature indicator amino acids of elastin, desmosine and iso-desmosine, are only detected in the aortic bulb of bonitos, but not in their skin or any other tissues [20]. However, due to the aortic bulb’s size being only 2-3 cm long, only milligrams of elastin peptides can be extracted per fish. Research and questionnaires have suggested the ingestion of bonito elastin peptides generates multiple benefits including skin elasticity enhancement, reduction of wrinkles, vascular aging prevention, relief of joint pain and female chest sagging improvement [21].

Conclusion

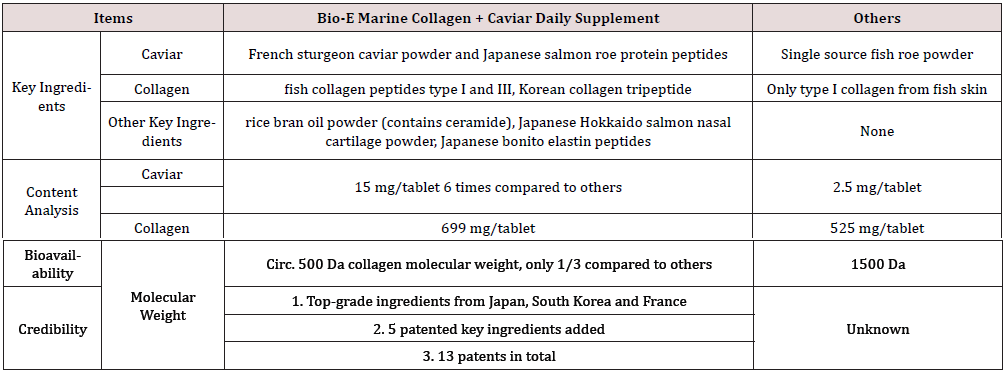
Compared to similar inner beauty products on the market, Bio- E’s Marine Collagen + Caviar Daily Supplement is formulated with top-notch patented ingredients from all over the world (Table 1). The science and biotechnology of type I and III collagen peptides, low molecular weight tripeptides, EGF stimulating theory and gut-skin axis target were also unprecedentedly combined in this product.

Table 1. Comparisons of Bio-E Marine Collagen + Caviar Daily Supplement and other products on the market.

Lupinepublishers-openaccess-biotechnology-microbiology


Friday, 23 June 2023

Lupine Publishers | The Influence of the Raw Materials used in the Ethanol Fermentation Over the Biogas Production from the Residual Vinasses

 Lupine Publishers | Journal of Biotechnology & Microbiology


Abstract

In the anaerobic treatment of the residual vinasses from the ethanol distilleries, the high sulfate content of them tends to lower the methane content of the biogas produced. This paper presents an initial assessment of the technical, economic and environmental impact of the use of non-sulfur-hued raw materials used in the ethanol production process on the sulfate concentration in the distillery vinasses, without any negative influence over the main parameters of the ethanol synthesis. The results of the experiments, carried on at a reduced scale (I L), give a reproducible indication of the best alternative was to use ammonium phosphate and urea as P2O5 sources and phosphoric acid to control the pH during the fermentation; this option gives a fermentation efficiency of 85.81%, an ethanol concentration of 32.27 g/100 ml, with a vinasses as residue with only 1893 mg of sulphate/ L. An scale-up of 60 folds (60 liters) of the selected Alternative 8 was carried on. A high replication of the results and the corresponding benefits of a large volume operation were obtained.

Keywords: Ethanol fermentation; distillery wastes; anaerobic digestion; biogas; methane content

Introduction

Ethanol fermentation process has as its main effluent the “distillery vinasses” a very aggressive residue. Recent studies confirm that the most viable way to treat vinasses is anaerobic bio digestion, to obtain biogas with a good energy potential [1,2]. However, the sulphates (SO42) content of the vinasses inhibits the efficiency of anaerobic digestion, inducing also a lowering of the methane content in the biogas and a significant presence of the very corrosive H2S, [3,4]. In this research work the influence of the use of non-sulfur nutrients in the ethanol biosynthesis over the composition of the vinasses waste, was studied, at a reduced reproducible level (1 L), allowing a very useful approach.

Experimental Procedures

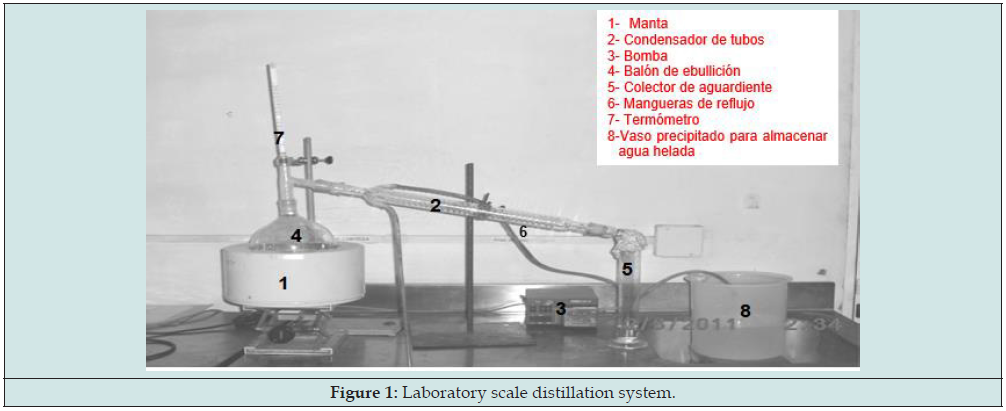
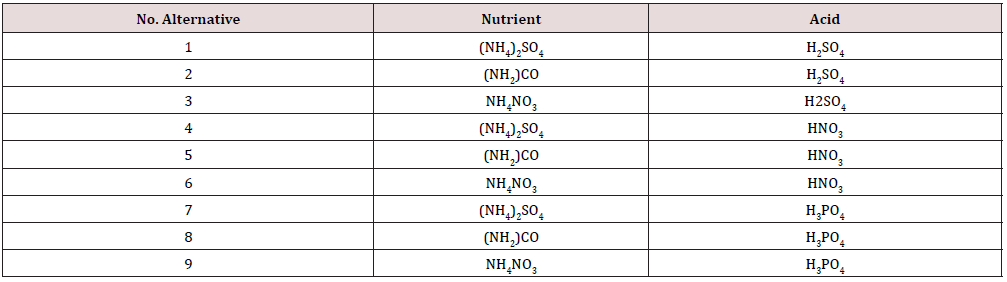
The study was carried using a 32 experimental design to evaluate the effects of the type of nutrients and acids used in the ethanol fermentation media (sulfur and non-sulfur compounds), at 1L experimental level, with B cane molasses with 66.63 g of total reducing sugar/g as the carbohydrates source, ammonium phosphate being the N and P2O5 nutrients and the strain L/25-7- 12 of Saccharomyces cerevisiae, commonly used in the ethanol commercial processes. To test the influence of the different nutrients salts, the fermentation medias were prepared using: 0.51 g/L of NH4HPO4; 1.39 g/L of (NH4) SO4; 0.63 g/L of (NH)2CO and 1.68 g/L of NH2NO3, to ensure the reported molecular composition of the Saccharomyces strain of CH1.64 N0.16 O0.52v P0.01 S0.005 [5]. The pH in all the medias tested were adjusted at 4.5 [6] with the acid selected for each test (Table 1); the medias were sterilized at 121°C for 45 minutes, cooled at 30°C, inoculated with a pure Saccharomyces strain in a relation v/v of 1/10, incubated for 48 hours without mechanical agitation. After 48 hours the fermented mash was distillated in a semi continuous set, shown in Figure 1, at 100 °C; samples of 150 ml of the condensate were collected and evaluated, the residual, as the equivalent vinasses, after de distillation were recovered from the distillation set.

Figure 1: Laboratory scale distillation system.

Lupinepublishers-openaccess-biotechnology-microbiology

Table 1. Experimental alternatives.

Lupinepublishers-openaccess-biotechnology-microbiology

In each experimental test run, the controlled parameters were:

a) For the inoculums: the cell count in a Neubauer chamber, using an optical microscope [7]; for the biomass growth the correlation of 4.87. 1010 cells /g of dry weight was used [8].

b) At the fermentation runs: Total Reducing Sugars (TRS) at the beginning and at the end of each cultivation test [9]; the ethanol content (°GL) of the fermentation mash, according to the [10] and the efficiency of the fermentation process, calculated by the relation between the ethanol produced and the true sugar consumed [11].

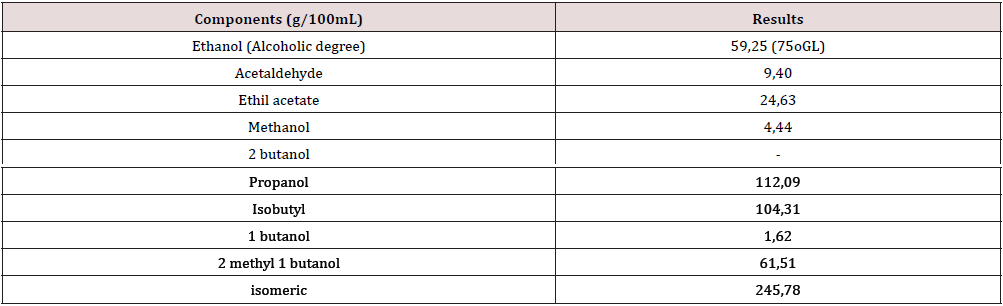
c) At the distillation: Ethanol and other compounds by capillary gaseous chromatography, by the extreme standard calculation (3-pentanol). The congeners were calculated taking as reference the alcohol content of the aguardiente (75%), for an equivalent of 59.25 g/100 ml as per the Cuban Standards [12].

d) The residual vinasses: were characterized following the standard methods for water and spends waters [13].

e) The statistical processing of the results: The results were processed by the multifunctional variance analysis (ANOVA), using the Stat graphic Centurion XV, 15.1.0.2, software [14].

f) The economic analysis: To select the most economically attractive alternative, a cost data was calculated for the ethanol recovered, based on 1 L, as an orientate behavior, taking the alternative 1 in Table 1 as reference, because its correspondence with the nutrients and acid most used in the local industry.

Results

In Ethanol Fermentation

For the pH adjustment of the fermentation the sulfuric acid was the one with the lower consumption, the nitric acid shows the highest with also the highest costs.

The Cell Count at the Ethanol Fermentation

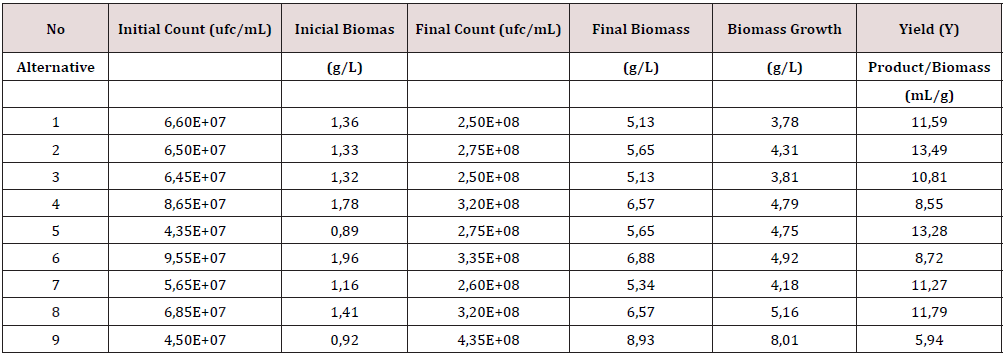
The results of the cell growth during the fermentation are shown in Table 2, the initial and final biomass was calculated by cell count. The biomass concentration at the end of the cultivation corresponds with the previous reported values reported in the literature (Table 3) [15]. The Yields product-biomass (ml ethanol/g) are in the range of the conventional values for ethanol fermentation processes, using cane molasses as a carbon source. The alternatives using urea as the N source (alternatives 2, 5 and 8) gave the highest yields.

The Fermentation Efficiency

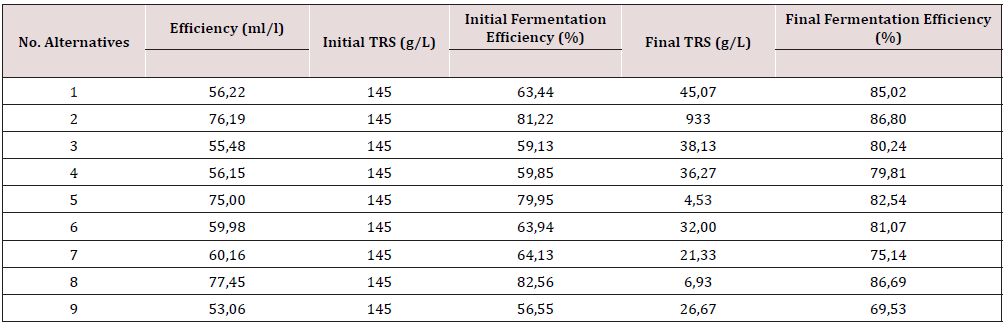
The yields and the fermentation efficiency are given in Table 3. From Table it´s possible to appreciate that alternatives 2, 5 and 8 show the higher ethanol content per L of media and when urea was used as the N source; also, alternative 8 gave the higher ethanol production (77.45 ml/l), being the one where phosphoric acid was used for pH control. On the other hand, no significant differences in the ethanol bioconversion were appreciated in the alternatives tested; but alternatives 2 and 8, using urea, showed the best behavior. The statistical results confirm that the nutrients have a decisive impact over the fermentation efficiency and that only the urea has a beneficial influence over the ethanol bioconversion. In the figures in Tables 2 & 3 is possible to conclude that the best yield product – biomass is obtained with urea as the N source, as well as the best fermentation efficiency and the highest ethanol production, so being the best alternative.

Table 2. Product yields – biomass.

Lupinepublishers-openaccess-biotechnology-microbiology

Table 3. Fermentation efficiency referred to the initial sugars content.

Lupinepublishers-openaccess-biotechnology-microbiology
Characterization of Ethanol Distillates

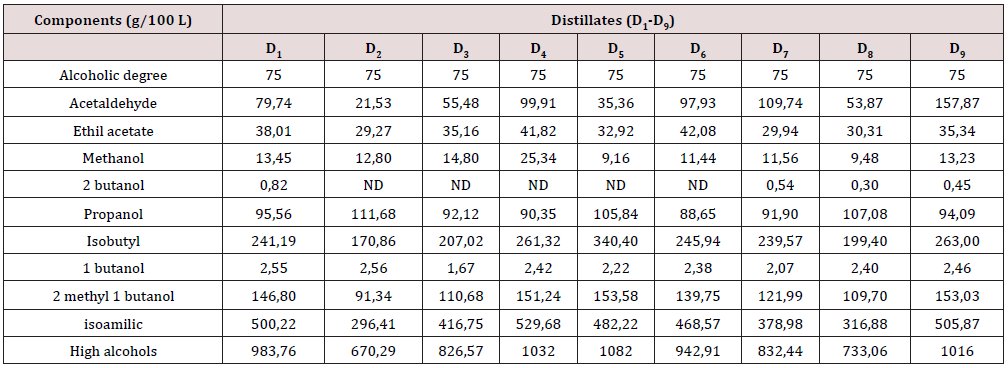
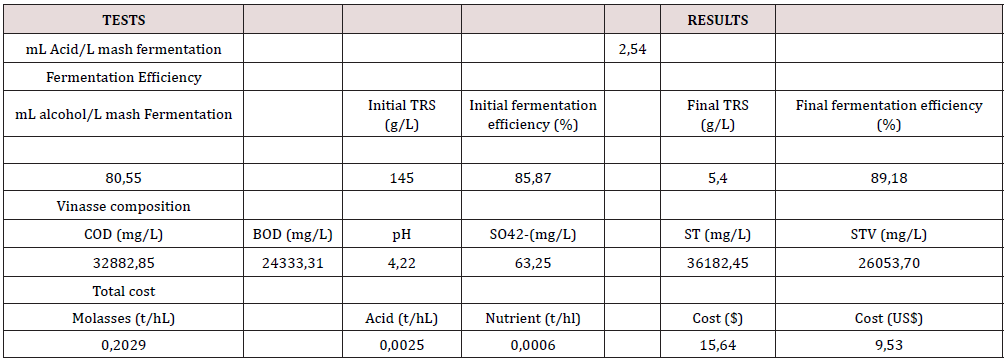
In Table 4 it´s possible to have the full composition of all the samples of the distillates obtained during the tests. The esters contents, in all the samples, were under 50 g/100 L; the range of the high alcohols content (propanol, isobutyl alcohol, 2 methyl 1 butanol and isoamilic alcohol) was within the values of the Cuban Standard [12], (175 and 350), except for the isomeric alcohol. Note that the distillate samples D2 and D8, are under the referred values; with respect to the methanol content, it is evident that only samples D5 and D8, range below the established limit of 10 g/100; of all the distillates sampled in the tests, D8 has the most attractive composition to be used in beverages.

Table 4. Components of the distillates of every alternatives studied.

Lupinepublishers-openaccess-biotechnology-microbiology
The Vinasses Composition

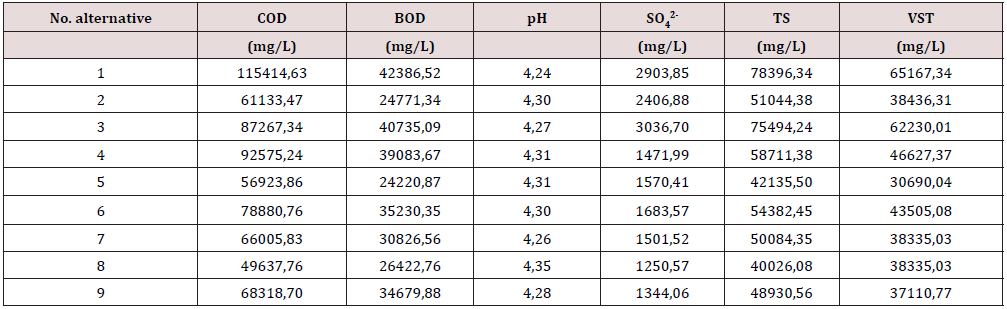
Table 5 shows the results of the influence of the raw materials over the vinasses composition [15,16]; different N and P2O5 sources were tested, also different acids for the pH control of the biosynthetic process, with the COD (chemistry oxygen demand), BOD (biological oxygen demand), pH, SO42w- (sulphate), as well as the Total Solids (TS) and Volatile Total Solids (STV) in the vinasses being the evaluated responds. It´s possible to appreciate that the relation TVS/TS was within the range of 0.75-0.96 in all the samples, a high COD value confirms their high organic matter content [17]; also, the pH values were between 4.20 and 4.35, typical values of the ethanol wastes. When Sulfuric acid is used to control the pH, during the ethanol biosynthesis, is possible to note a high sulfate content in the vinasses, the use of nitric acid for the pH control also induces a high sulfate content in the spends, the lowest values of sulfate in the vinasse are obtained when phosphoric acid regulates the pH of the fermentation. These results confirm the hypothesis that the sulfate content in the waste vinasses is highly dependable over the nutrients and the acid employed to control the pH of the biosynthesis. After a full evaluation of the alternatives tested, it´s clear that the best combination is the one using urea as a N source and phosphoric acid for the pH control.

Table 5. Characterization of the residual vinasses obtained in the test runs at the lab scale (1 L).

Lupinepublishers-openaccess-biotechnology-microbiology
The Economic Analysis

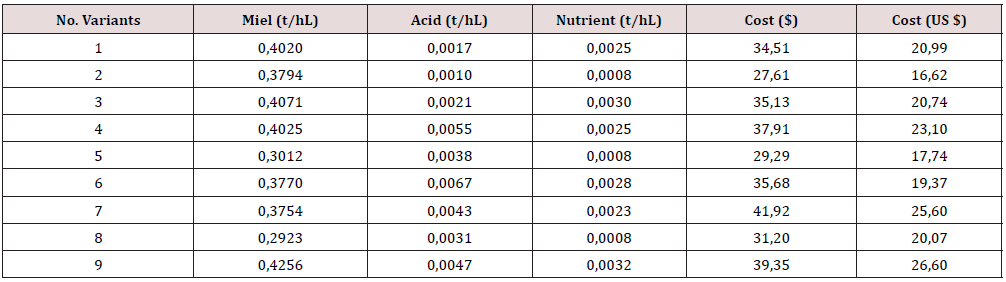
Table 6 shows the total unit costs for all the alternatives studied taking in account [18]; the reports refer to the total cost and the foreign currency component of each one, per hl of ethanol. Alternative 1 was used as a reference, due to the fact that its nutrient pattern and acid used conventionally in the Cuban ethanol industry today. The analysis indicates that Alternative 2 has the lowest unit cost, but looking for an integral behavior, Alternative 8 combines a lower cost (of $ 31.20/hl and a component of US$ 20.07), a low sulfate content in the vinasses with a high ethanol yields.

Table 6. Total unit cost of each variant.

Lupinepublishers-openaccess-biotechnology-microbiology
The Reproducibility Test

To confirm the results obtained and the confidence over the future scale-up of the evaluated hypothesis, and scale–up of 60 folds, of the selected Alternative 8, was carried out. The work done included the evaluation of the ethanol yields, the fermentation efficiency, the composition of the vinasses, the unit costs and the quality of the obtained ethanol distillates. The mean values are shown in Tables 7 & 8, referred to the main parameters evaluated.

Table 7. Results of the scale-up of the Alternative 8.

Lupinepublishers-openaccess-biotechnology-microbiology

Table 8. Composition of the distillate under the scale-up conditions.

Lupinepublishers-openaccess-biotechnology-microbiology

Conclusion

The results indicate that when the selected waste vinasses treatment is anaerobic bio digestion, the best alternative is to use urea as the N source and phosphoric acid for the pH control of the ethanol biosynthesis. This combination guarantees a high ethanol fermentation efficiency, and the obtained distillates satisfy the Cuban Standard for the use in beverage. A scale-up of 60 folds of the selected Alternative 8 confirms a tight replication of the results and the corresponding benefits of working at large volumes.

Read More About Lupine Publishers Journal of Biotechnology & Microbiology Please Click on Below Link:
https://lupine-biotechnology-microbiology.blogspot.com/

Saturday, 29 April 2023

Lupine Publishers | Necrosis as a Step of Tissue Repair

 Lupine Publishers | Journal of Biotechnology & Microbiology


Introduction

Cell death is a crucial step of tissue regeneration, but massive cell death is a cornerstone pathophysiological mechanism of tissue destruction. Let’s consider some specific aspects of tissue necrosis and its predecessors.

First of all, tissue destruction always occurs on the background of septic or aseptic inflammation. Any type of inflammation causes the increase of interstitial fluid at least due to a sodium flow from a cell. That is a crucial moment because at some point cells lose their intracellular fluid and this is the exact marker of cell destruction regardless of whether this is a consequence of cell compression or a breakdown of cell stromal components. We can state it because necrosis does not depend on the cell cycle that means that this process is not related to nuclear reactions. Based on this approach we can explain why some tissue can withstand the edema more effectively than others. For example: nerve tissue is extremely sensitive to edema, and we can assume that this is a consequence of a relatively small amount of plasmogel in a nerve cell. It exhausts its possibilities of intracellular fluid loss very quickly. A striking example of this is death of central and peripheral nerves due to edema of nerve fiber regardless of compression. Undeniably, the impact of perineurium and epineurium is incomparable with the capabilities of adipose tissue where the number of organelles is minimal and the cytoplasm is predominantly filled with liquid contents. This specificity is particularly significant for preservation of viability of parenchymal and alveolar organs with variety of pathologies and, of course, for the periphery. In my surgical practice I have often seen complete anatomical recovery of limbs after the treatment of gangrene. I mean bypass operations for people with atherosclerosis and diabetes, frostbite apical necrosis of extremities, who had indications for surgery but they refused amputations and I had to dress wounds for a long time. Wounds, even extensive, that are prone to chronic inflammatory process, are always accompanied by hyper granulation during the period of healing, while acute surgical wounds – almost never. A reasonable question “why” arises. I think that long-term leukocyte phase can form some type of memory that is why autoimmune needs for maintaining inflammation are not updated every moment but are supplied with the usual amount of cytokines protractedly. Thus, if initially cytokines “catalyzed” inflammation, then with the time immunize and, possibly, even form antibodies to TNF family, suppress the pro –inflammatory effects of a number of interleukins. Hence, necrosis clears the way for tissue repair.

Read More About Lupine Publishers Journal of Biotechnology & Microbiology Please Click on Below Link:
https://lupine-biotechnology-microbiology.blogspot.com/

Saturday, 11 June 2022

Lupine Publishers | Whole-Cell Assays for Discovering Novel Efflux Inhibitors for Use as Antibiotic Adjuvants

 Lupine Publishers | Journal of Biotechnology & Microbiology


Abstract

Antimicrobial resistance (AMR) is a growing problem worldwide. Resistance to antibiotics can occur in a number of ways, one of which is removal of the drugs from the cell via efflux pump macromolecular machineries. As such, efflux pumps can provide a background level of resistance to many different classes of antimicrobials and are a major contributor to AMR. Inhibition of efflux pumps therefore has the potential to reverse resistance to many antibiotics in one go and is an attractive potential for treating resistant infections. Whilst a number of efflux inhibitors are known, none are currently used clinically due to harmful side effects. Development of novel inhibitors is therefore imperative. The article aims to review accumulation assays and efflux assays, two of the most common laboratory techniques used to identify and characterise candidate efflux inhibitors.

Keywords:Efflux pumps; Efflux inhibitors; Efflux assays; Antimicrobial resistance; Drug discovery

Introduction

Globally, antimicrobial resistance is a rising public health challenge. Particular infections including pneumonia, Tuberculosis (TB), gonorrhoea, and salmonellosis are becoming more difficult to treat. Of new TB cases, 3.5% are either resistant to rifampicin (the most effective first line drug) or are multi-drug resistant, rising to 18% for previously treated individuals [1] Furthermore, there are fears that Neisseria gonorrhoeae has already developed resistance to all currently recommended treatments [2]. There is a desperate need for new antibiotics to treat these most resistant of infections, but the huge costs, long timescale and high attrition rate of drug discovery means that this is a slow process. Twenty classes of antibiotics were discovered between 1940 and 1962, yet only two have been developed since then [3]. Moreover, for any novel antibiotic developed, it is likely that resistance will quickly emerge once it is brought into clinical use, especially with the frequent misuse of antibiotics which drives selection for resistance. Therefore, other strategies must be taken in parallel to antibiotic development, or there will be a continuous arms race of drug development and resulting gain of resistance, a battle we are currently losing.

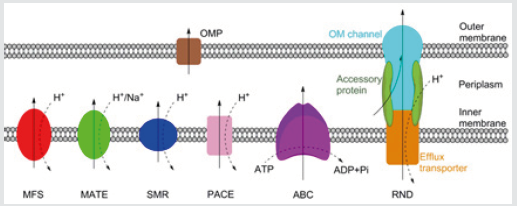
Figure 1: Schematic representation of the MFS, MATE, SMR, PACE, ABC and RND families of bacterial efflux pumps, plus an outer membrane protein channel (OPM), shown here in a Gram-negative bacterium. RND family efflux pumps comprise of a tripartite complex formed from an inner membrane efflux transporter, an outer membrane channel, and a periplasmic accessory protein. All six families, with the possible exception of the PACE family, also have representatives in both Grampositive and acid-fast bacteria. Bold arrows indicate the direction of drug efflux, and dashed arrows show ion movement.

Lupinepublishers-openaccess-biotechnology-microbiology

Antibiotic resistance can occur via acquired or intrinsic mechanisms. Acquired resistance, typically via horizontal transfer or spontaneous mutation, often functions by altering the drug target or production of enzymes which degrade the antibiotic. Acquired resistance, gained in response to antibiotic treatment, is usually only effective against a single drug. Intrinsic resistance, on the other hand, refers to the non-specific mechanisms of antibiotic resistance evolved ancestrally, including the impermeable outer membrane of Gram-negative or acid-fast group of bacteria, and drug efflux pumps which remove drugs from the cell [4]. There are currently six families of bacterial efflux pumps identified: the ATPBinding Cassette (ABC) family, the Major Facilitator Superfamily (MFS), the Multidrug And Toxin Extrusion (MATE) family, the Small Multidrug Resistance (SMR) family, the Resistance-Nodulation-Cell Division (RND) superfamily and the Proteobacterial Antimicrobial Compound Efflux (PACE) family, which has not yet been structurally characterised. The ABC family hydrolyse ATP directly to drive efflux, whereas the other five utilise transmembrane ion gradients [5]. Whereas the RND family directly effluxes antibiotics across both membranes, the other five families only transport antibiotics across the inner membrane. From the periplasm, drugs can exit the cell via outer membrane protein channels or by entering the RND complex (Figure 1).

Efflux pumps are often non-specific, and as such can provide resistance to a wide range of antimicrobials. They have been implicated in contributing towards the multi-drug resistant phenotypes of Mycobacterium tuberculosis [6], Pseudomonas aeruginosa [7], Neisseria gonorrhoeae [8], and Streptococcus pneumoniae [9], amongst others. Inhibition of drug efflux is therefore an exciting prospect for treating drug resistant bacteria and may enable old antibiotics to re-enter clinical usage. There is compelling evidence that the use of efflux pump inhibitors as an adjuvant may aid treatment of resistant infections of many types [6-12]. However, despite a number of potent efflux inhibitors being known, none have entered clinical use. In most cases this is because the compounds are toxic at the concentrations required to inhibit efflux [13]. There is therefore a pressing need to develop novel clinical efflux inhibitors. To achieve this, assays are needed to validate the inhibitory activity of novel compounds. One way this can be achieved is by using standard antibiotic susceptibility testing, such as the resazurin-based microplate assay to determine if the putative inhibitor, at sub-MIC concentrations, is able to lower the MIC of a known antibiotic. This method has the benefit of being relatively easy and high-throughput; furthermore, it is possible to combine this method with mutants of efflux pumps to confirm that the effect on the MIC is occurring specifically via inhibiting efflux, and even to identify which efflux pump is inhibited [14]. However, using reduction of MICs to identify and validate efflux inhibitors is fairly insensitive, and so is of limited use. Only large changes to efflux will likely have an effect on MICs, and so less potent inhibitors may be dropped out. Furthermore, as this method does not measure efflux, it is difficult to directly attribute changes in MIC to efflux inhibition [15]

A more direct way is therefore needed to study the effect of candidate inhibitors on efflux. One way is to follow the movement of an efflux pump substrate, often a fluorescent molecule, into and out of bacterial cells, and use this as a measure of efflux activity. Many different molecules are used to measure efflux, with ethidium bromide and Nile red being two of the most common. Ethidium bromide fluoresces strongly when bound to DNA, and Nile red fluoresces when in non-polar environments such as the membrane [16,17]. This therefore gives these molecules the advantage that they fluoresce differentially in extra- and intracellular environments, providing a sensitive indication of rate of efflux from the cell, and helping eliminate background fluorescence. These methods fall into two main categories; those which follow the accumulation of the molecule within the cell, and those which follow its efflux.

Accumulation Assays

Whilst there are variations, most accumulation assays typically follow a similar procedure. At the start of the assay, there is no dye added to the bacteria. This is then added to the reaction, and its accumulation within the cells followed over time, typically by measuring the fluorescence with dyes such as ethidium bromide. Eventually, accumulation will tail off, with fluorescence reaching a steady state. This reflects an equilibrium being achieved between influx and efflux of the dye. This assay can be performed with added efflux inhibitors [18]. By inhibiting efflux, more dye accumulates within the cells compared to untreated ones, with steady state being achieved at a higher fluorescence. This assay can therefore be used as a very simple test to validate the inhibitory activity of a candidate efflux inhibitor [19]. Similarly, accumulation assays are often used to observe changes in efflux ability in knockout, knockdown or overexpression mutants.

If a knockout/knockdown mutant accumulates more dye, it can be assumed that the gene encoded a protein important for drug efflux, or a regulator of these, and vice versa with overexpression mutants. These two approaches can be combined, with different mutants treated with efflux inhibitors to see if they have a greater or lesser effect on dye accumulation than for wild-type cells. This can help determine which efflux pump the inhibitor affects [7]. However, there are problems with using accumulation assays, the most important being that accumulation is not a direct measure of efflux. Rather, it reflects a number of factors, predominantly the balance of influx and efflux rates. Influx depends greatly on the permeability of bacterial membranes, which can vary greatly between even closely related strains due to differing membrane compositions [20]. Therefore, unless influx rates are known, kinetic data cannot be obtained from accumulation assays and results remain qualitative. Whilst this limits usage of accumulation assays to comparisons between isogenic mutants, or groups treated with different inhibitors, the assay remains a conclusive way to determine if a molecule possesses inhibitory activity, and so is frequently used to validate new efflux inhibitors.

Efflux Assays

If a quantitative measure of efflux is required, then a more direct efflux assay should be used. This follows a similar premise to accumulation assays, but instead involves preloading the cells with dye and following its subsequent efflux. To achieve this, cells are incubated with a dye or other efflux pump substrate, and a known efflux inhibitor such as CCCP. This causes the dye to accumulate to a maximum level. Then, the cells are washed to remove the inhibitor and any remaining extracellular dye. The cells are then reenergised, typically with glucose, which restarts efflux. The movement of the dye out of the cells can be followed by recording the decreasing fluorescence [15]. As this method is a direct measure of efflux, kinetic data can be obtained for efflux rates, which allows comparisons to be made more broadly, rather than just between isogenic species. In much the same way as with accumulation assays, modifications can be made to study the effects of putative inhibitors or different mutations on efflux rates [12,21].

Efflux assays are very sensitive, and they allow for validation and characterisation of novel inhibitors, which may potentially have clinical usage. Whilst the efflux assay is widely used, it is not always applicable. Non-fermenter bacteria, including Pseudomonas and Acinetobacter, are unable to metabolise glucose, and so cannot be easily reenergised. This means that efflux assays can be unsuitable for some bacteria, and instead accumulation assays are more commonly used [7,22].

Limitations with these Assays

A fundamental problem with both types of assay is that using ethidium bromide or another dye to measure efflux or accumulation is of limited clinical relevance, and may not reflect well the efflux of any particular antibiotic. This can be due to the dye and antibiotic having very different kinetics of efflux, and furthermore, they may not even be substrates for the same efflux pumps. In addition, as ethidium bromide intercalates with DNA, there is a lag time in efflux in which it dissociates, followed potentially by a two-step efflux mechanism in which it is first transported to the periplasm. This can lead to underestimates of efflux rate, and so may be a poor reflection of efflux rates of antibiotics [23]. Therefore, where possible, it is better to use the antibiotic of interest itself as a direct measure of efflux, although this tends to be far more difficult experimentally. Certain antibiotics, such as fluroquinolones and tetracyclines have endogenous fluorescence which enables their accumulation to be followed [24]. For non-fluorescent antibiotics, Mass-Spectroscopy (MS) can be used to directly study their accumulation. A recent proposed joint protocol for spectrofluorimetric and MS analyses suggests that the two methods are complementary and together can accurately measure antibiotic accumulation, demonstrated with fluroquinolones [25]. MS analyses, rather than spectrofluorometric, may also provide a better way to screen natural compounds for efflux inhibitory activity. Many natural compounds have endogenous fluorescence, which can make it hard to isolate and interpret fluorescence changes due to dye accumulation or efflux. As before, the actual antibiotic, rather than a dye, could be used, and MS used to determine how much accumulates with and without the candidate inhibitor.

One of the biggest problems facing the development of novel efflux inhibitors is the lack of high-throughput assays to validate putative compounds. Whilst both the accumulation and efflux assays are relatively easy to perform and can reliably confirm if inhibition occurs, both are limited on throughput. Therefore, whilst some in silico screening has been performed [26], limitations in throughput have so far prevented large-scale screening of libraries in vitro. Instead, the search for novel inhibitors has relied extensively on prior knowledge to select candidates for validation. Whilst the hit rate with this has been relatively high, the overall number of new inhibitors found has been low, and it is rare to identify completely novel inhibitors in this way. This is in part why no inhibitors have made their way into clinical usage, as many are closely related and as such are similarly toxic. Development of high-throughput screening assays for novel inhibitors is therefore necessary if efflux inhibitors are to progress clinically. Recently, the Back assay was developed, which uses a 96-well plate format combined with MS. This was able to test in triplicate 12 compounds at 4 concentrations each, for two different Escherichia coli strains [27]. This progression to more high-throughput screening is likely to be the driving force behind development of novel efflux inhibitors, and further work needs to be done to optimise assays before large scale-screening of compound libraries can be performed. Ultimately, the development of clinical efflux inhibitors used therapeutically as antibiotic adjuvants may be what turns the tide in the battle against antibiotic resistance.

Acknowledgment

The authors would like to thank the British Society for Antimicrobial Chemotherapy, without whose funding this work would not have been possible. We also wish to thank Dr Arundhati Maitra for her time and advice when writing the article, as well as for help with ChemBioDraw.

Read More About Lupine Publishers Journal of Biotechnology & Microbiology Please Click on Below Link:
https://lupine-biotechnology-microbiology.blogspot.com/
Thursday, 12 May 2022

Lupine Publishers | Preparation of Generated DNA (Streptomyces Griseus) Crown Cells (Artificial Cells) and Antibiotic Production in Its’ Co-Cultures with Yeast (Beer)

 Lupine Publishers | Journal of Biotechnology & Microbiology


Abstract

DNA crown cells are artificial cells which the outside of the membrane was covered of DNA. Such DNA crown cells (artificial cells) could be prepared by incubating within egg white with a sphingosine (Sph)-DNA-adenosine mixture. Also, the DNA crown cells could easy synthesized. Update, many kinds of DNA crown cells have been synthesized using various DNA. On the other hand, it is unclear whether such DNA Crown Cells. could be contribute to applied fields, Present report described that DNA crown cells using DNA of antibiotic produced Streptomyces griseus were synthesized and that the antibiotic was produced in the co-culture with yeast (beer) with egg white which contained DNA crown cells. Now, though it is studying on whether DNA crown cells were associated with the production of antibiotic, however, it was suggested that the system of the present co-cultures may be contribute to applied fields, the production of antibiotic or functional beer.

Keywords: Antibiotic; DNA Crown Cells; Sphingosine-DNA Streptomyces; Gniseus

Introduction

There has been significant progress in the generation of artificial cells since the first studies in the 1960s [1-4], yet to date, artificial cells that can replicate autonomously have not been reported. Recently, the approaches for generating fully operational (self-replicating) artificial cells have been reported [5-7]. On the mechanism on underlying the formation of artificial cells, it was demonstrated that the artificial cells were covered with DNA, (named DNA crown cells,) [8] and were generated when they were incubated with white-egg. Thus, DNA crown cells are artificial cells which the outside of the membrane were covered with DNA and could replicated within egg white. These DNA crown cells were formed as follows: first, Sph-DNA mixtures aggregates with adenosine-lipids. From aggregates, DNA crown cells were constructed with lipids [9,10]. Thus, the mechanism on the formation of DNA crown cells became clear. Un-limited DNA crown cells could be theoretically prepared. and using the methods, the several kinds of DNA crown cells have been synthesized [11-14]. The detail on DNA crown cells (discovery, biological preparation, synthesis and the mechanism of the formation, and so on) have been described [6,15-18]. On the other hand, it is not clear whether such DNA crown cells can contribute in the applied fields, such as biomedicine or bio-industry. Here, to research these problems, it was tried to prepare the DNA crown cells (named DNA (S. griseus) crown cells) using DNA from Streptomyces griseus which produce several kinds of antibiotic and .it was examined whether such DNA crown cells were associated with the production of antibiotic. In present experiments, it was described that DNA (S. griseus) crown cells could be prepared with the method described previously and the antibiotic were produced in the co-cultures of yeast (beer).

Materials and Methods

Materials

The following materials were used:

I. The materials to prepare DNA crown cells: Sph (Sigma, USA), DNA (extracted from Streptomyces griseus), adenosine (Sigma, USA and Wako, Japan), monolaurin (Tokyo Kasei, Japan) Edible white leghorn eggs punched from a market. A-M compound (synthesized with the mixtures of adenosine and monoraulin) [10].

II. The materials to prepare the sample in co-cultures: Yeast: Dry Ale Yeast (Safale S-04) (Formentiis Bergy). Medium (Molt): Black Rock PISENER (New Zeiland) (These materials were involved in Handmade-beer kit (AUBERCRAFT, Okazaki, Japan) and was prepared as indicated in explanation.

III. The materials to test antibiotic

a) Medium: Potato Dextrose Agar (kyodo-nyugyo, Tokyou, Japan).

b) Tested bacteria: Dry Bacillus subutiis natto (Daikokuya, Nagoya, Japan)

These bacteria were suspended in distilled water (10mg/ml).

Methods

Preparation of DNA (S. griseus) crown cells: The generation of artificial cells using Sph-DNA-A-M was tested as described above [10]. Briefly, 90ml of Sph (10 mM) and 40ml of DNA (1.7mg/ml) were mixed and the mixture was then heated. A-M compound (50ml) was added, then the mixture was injected into the white (albumin) of an egg. After injection, eggs were incubated at 37℃ for 7days.

Observation of St DNA (S.grisses) Crown Cells: After incubation at 37 °C for 7 days, 1–2ml of egg white potentially containing artificial cells was transferred to Dulbecco’ modified Eagles’ Medium containing 10% bovine serum (DMEM) and incubated at 37 °C for 2 days. A drop of precipitate in culture medium was placed on a glass slide after the addition of ethidium bromide solution and observed using phase contrast microscopy and fluorescence microscopy.

Maintenance and storage of DNA Crown Cells: DNA crown cells were transplanted by inoculating a sample of egg white (0.5ml) containing the cells into fresh egg white every about 1 month. The part of the white albumin was storage at a storage at temperature of 4℃.

Preparation of sample (beer) tested antibiotic: Dry yeast (3g) and white egg (15ml) which contain DNA (Str. griseus) crown cells in 3 generations were mixed and incubated for 5 hours at 37℃. Then, 30ml of beer molts were added and incubated for 2 weeks in room temperature. After 2 weeks, old medium was deposit. Then, 30ml of new molts were added and continue to incubate for room temperature. In each time, medium was mixed and about 5~6 ml was removed for testing.

i. Sample a: culture fluids after 2 weeks (before medium change)

ii. Sample b: culture fluid in 1 week after medium change

iii. Sample c: culture fluid in 2 weeks after medium change

iv. Sample d: culture fluid in 3 weeks after medium change

Preparation of plate to assay antibiotic: Antibiotic assay was carried out with agar well methods Tested bacteria (5ml) were added to agar (200ml) and mixed. Then, about 15ml of agar were pored to a dish. After fixing, a well of about 2cm in diameter each dish. were prepared. Then, tested fluid (400μl) were pored to each dish and incubated for 18 hours at 37℃. After incubation, inhibition zone was observed.

TLC study on antibiotic: To prepare the samples of TLC, Acetone was added to 50ml of sample d. Then, ethyl acetate was added to the fluid and concentrated in 5ml. Extracted sample was dried and resolved in acetone (100μl) The 20μl was applied on TLC plate with Streputomaysin and Chromomysin as a control. Then, the plates were developed with chloroform/methanol (80:20) and then detected with UV 365 and 254.

Results and Discussion

Preparation of DNA (S. griseus) Crown Cells

Lupinepublishers-openaccess-Agriculture

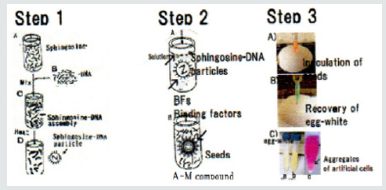
Figure 1: Summarized procedures to prepare and synthesize generated artificial cells (DNA crown cells) [7,12].

Step 1: Sph is added to DNA. Sph-DNA particles are obtained following heating of the mixture.

Step 2: To prepare artificial cells (DNA crown cells), a binding factor is added to the Sph-DNA particles. To synthesize DNA crown cells, adenosine-monolaurin (A-M) is added to the Sph-DNA mixture (Sph-DNA-A-M), then monolaurin is added.

Step 3: Sph-DNA-A-M mixtures are injected into egg white. After incubation for 7 days, cells are recovered from the egg white.

The methods on preparation of DNA crown cells (artificial cells) have been established using several kinds of DNA [10,12,13]. Summarized procedures to prepare artificial cells (DNA Crown Cells) have been shown in previous report [7], however, the methods were again shown in Figure 1

a) Step1: Sph and DNA were mixed, and heated, Sph-DNA particles were obtained.

b) Step 2: Binding factor was added to Sph-DNA particles.

Here, A-M compounds as a binding factor were added to Shp- DNA particles.

Sph-DNA-A-M mixtures were formed. After the addition of monolarin, DNA crown cells were formed without egg white.

c) Step 3: Multiplication of DNA crown cells within egg white

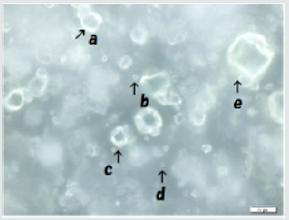
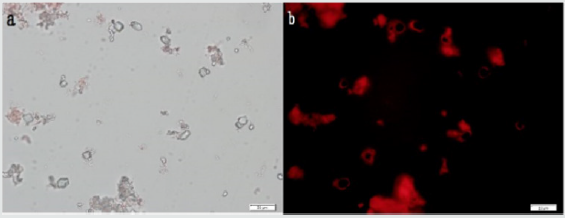
DNA crown cells could be multiplied within egg white: In use of DNA from Streptomyces griseus, Sph was mixed with DNA (S. griseus) and heated. Then, A-M compounds were added to Sph-DNA mixtures. the mixtures were incubated in egg-white. After 7days of incubation, the egg-white was removed and then incubated within egg white of new egg. After the transplantation of 3~5 times (3~5 generations), egg white were removed and DNA (S. griseus) crown cells were recovered from egg white with the incubation of D-MEM. DNA (S. griseus) crown cells in three generations are shown in Figure 2. Many cells of various sizes (approximately 2~30μm) were observed in rings like shape (Figure 2). Typical cells were shown in Figure 3. Ring shaped cells were observed under phase contrast microscopy (Figure 3a), Russell light was observed in the cells under fluorescence microscopy (Figure 3b), suggesting that they contain DNA. These findings indicate that DNA (S. griseus) crown cells were formed from the Sph-DNA-A-M mixtures.

Lupinepublishers-openaccess-Agriculture

Figure 2: Preparation of generated DNA (S. griseus) crown cells. Sph was added to DNA. After heating, A-M was added to the Sph-DNA mixture, followed by the addition of monolaurin. The mixtures contained DNA crown cells were incubated in egg white. The egg white was transferred into a new egg every 7 days. An aliquot of third generation egg white (2ml) was cultivated in Dulbecco Modified Eagle’s Medium containing 10% bovine serum at 37°C for 2 days. The precipitates were observed using phase contrast microscopy and fluorescence microscopy. Various-sized cells were observed under phase contrast microscopy (Figure 2). a and c is approximately 20 μm b and d is approximately 4 μm. e is approximately 30μm.

Lupinepublishers-openaccess-Agriculture

Figure 3: Typical DNA (S. grises) crown cells were observed using phase contrast microscopy (Figure 3a). Russert light was observed on the surfaces of the cells using fluorescence microscopy, indicating the presence of DNA on the surfaces of the cells (Figure 3b). Figures 3a and 3b show the same field of view. Scale bar is 20mm.

Obvious characteristics of DNA (S. griseus) crown cells are

a) The structure is a large loop of DNA

b) The cells can replicate in egg white.

These observations are similar to those of other DNA crown cells which were described previously.

Antibiotic production in co-cultures

Update, it was described that many kinds of DNA crown cells could be prepared. However, it is unclear whether these DNA crown cells could be contributed in applied fields, especially, bio-industry. Here, to research these problems, first, it was tried to prepare DNA crown cells (named DNA (S. griseus) crown cells) using DNA of Streputomysec griseus which produced Chromomycin or Strepuomycine. The second, it was examined whether antibiotic was produced with the co-cultures of yeast and egg white contained DNA (S. griseus) crown cells. The methods to obtain sample were shown in Figure 4 .

Lupinepublishers-openaccess-Agriculture

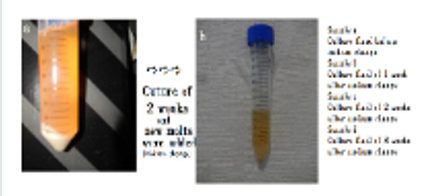
Figure 4: Preparation of sample tested antibiotic Yeast was mixed with egg white which contain DNA crown cells. The mixtures were incubated at 37 oc for 5 hours. Then, new molts were added (A) and incubated for 2 weeks at room temperature. After 2 weeks, old medium was removed, and new molts were added and continue to incubate in room. At each time point, about 5-6ml of medium was removed for testing (B).

i. Procedure 1: Yeast was mixed with egg white which contained DNA (S. griseus) crown cells. Then, the mixtures were incubated for 5 hours at 37℃.

ii. Procedures 2: After incubation, the upper fluid in the mixtures were removed and new molt was added to the mixtures. Then, the mixtures were incubated for 14 days at room temperatures (approximately 20℃).

iii. Procedures 3: After 2 weeks of incubation, the old molt was removed, and new molt was added (medium change). The part of the old molt was collected and used as a sample (a).

The molt which was carried out the medium change were further incubated at room temperatures. Then,

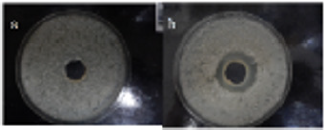
After 1 weeks of incubation, the upper fluid was collected and used as a sample (b). After 2 weeks of incubation, the upper fluid was collected and used as a sample (c). After 3 weeks of incubation, the upper fluid was collected and used as a sample (d). Each sample was collected three times within a 2~3 days and antibiotic assay was tested. Here, the prove on whether antibiotic was produced were based on whether the clear zone was observed. No antibiotic was found in sample a (Fluid after 2 weeks incubation). Also, no antibiotic was founded in sample b and sample c. The result in sample b was shown in Figure 5a as a negative example. No clear zone was founded, indicating that antibiotic was not contained in the sample. Samplings in sample d were carried out three times and antibiotic were found in a sampling of one time. The clear zone was observed as shown in Figure 5b, indicating that antibiotic was contained in sample d. Thus, the results indicated that antibiotic was produced with the co-cultures of yeast and egg white which contained DNA (S. griseus) crown cells.

Lupinepublishers-openaccess-Agriculture

Figure 5: Antibiotic production Tested bacteria (Bacillus subcilis (natto) were added to agar. Then, it was pored to a dish. After fixing, a well was prepared. Tested sample (400μl) was pored and incubated for 18 hours at 37oc. After incubation, inhibition zone was observed Inhibition zone was not observed in sample a (Figure 5a), suggesting that antibiotic was not produced. Inhibition zone was not observed in sample b and c, respectively (Data not shown). Inhibition zone was observed in sample d (Figure 5b), suggesting that antibiotic was produced.

TLC study on antibiotic

Sample (d) was treated with acetone and concentrated. Bactericidal ability did not lost with the treatments (data not shown). The sample was spotted on the TLC plates. Then, the plates were developed. Band of samples were not fond in the RF value of Chromomycin and Streptomycin, respectively. (Data was not shown). The facts showed that antibiotic which was produced with the co-cultures differ from Chromomycin or Streptomycin. It is well known that DNA from bacteria is transferred into eukaryotes in trans-king dome conjugation) [19,20]. Therefore, I expected that the Chromomycin or Streptomycin were produced with the transfer of DNA crown cells (or their DNA) to yeast. However, in present experiments, it is not possible to clear whether the transfer occur. Therefore, now, there are several unresolved problems on the mechanisms of antibiotic production. Especially, why dose it takes for long time (over 5 weeks) until antibiotic was produced, During the time, what happen between DNA crown cells and yeast. Also, antibiotic production was observed in one case. why antibiotic production was not observed in all cases. Thus, it is unclear whether DNA crown cells are directly associated with the production of antibiotic or egg white-components are associated. It is under studying to resolve these problems including the identification of antibiotic, its’ biological functions (anticancer, antibacterial spectrum and so on) of the antibiotic and weather DNA crown cells or the components were incorporated into yeast, moreover, yeast which produce antibiotic could be cloning. Thus, though it is studying on the mechanisms on the antibiotic production, it may be told that antibiotic of new type or potential antibiotic were produced with yeast in the co-cultures. On the other hand, it may be good results for apply these cells, or their egg white in the fields of bio-industry, because the procedures is very easy, and then beer containing antibiotic were produced in large scale. Namely, the production of antibiotic or functional beer with antibiotic was produced with present co-culture systems. If obtained antibiotic was effective and beer were proved in the safety, it may be actually used in the fields of medicine or healthy drink. Moreover, the present experiments expected to develop in the fields of fermented industry using Yeast.

Conclusion

Here, first, it was described that generating DNA (S. griceus) crown cells could be prepared. Second, it was demonstrated that antibiotic was produced in the co-cultures of white egg which contained DNA crown cells and yeast (beer). Now, it is unclear whether DNA crown cells are directly associated antibiotic production. However, it is expected that the production of antibiotic or beer with antibiotic was developed. The present experiments showed a possibility which it may be applied in the fields of bio (fermented) industry using yeast.

Acknowledgement

I would like to thank M. Hayakawa and H. Yamamura (Yamanashi University) for the supply of Streptomyces grises and for useful discussion. Also, I would like to thank I. Monna (Rizo Inc.) for assistance in extracting samples for adenosine analysis and for useful discussions, S. Higuchi (Saitama Industrial Technology Center Northern Laboratory, Japan) for assistance with analysis of the TLC and for useful discussions, and Tokyo Metropolitan Research Industrial Technology Institute for the use of laboratory space and fluorescence microscopes.

Read More About Lupine Publishers Journal of Microbiology Please Click on Below:
https://lupine-biotechnology-microbiology.blogspot.com/
Friday, 11 March 2022

Lupine Publishers | Perspective of Postgraduate Biology Students About Onychomycosis

 Lupine Publishers | Journal of Biotechnology & Microbiology


Abstract

Aim and objective of the current study was the awareness about onychomycosis. The comprehensive of 68 subjects engaged in prevalent study. Subjects were the postgraduate biology students of Bahauddin Zakariya University Multan, Pakistan. We composed the questionnaire and inquire their perspective about onychomycosis. It was completed from the prevalent investigation that onychomycosis was a fungal disease and recessively found among the male individuals.

Keywords: Onychomycosis; Perspective; Blemish; Medication; Dermatophytes

Introduction

Onychomycosis is a fungal contagion of the nail. White or yellow nail blemish or discoloration, thickening or buttress of the nail or segregation of the nail from the nail mattress are the signs of the onychomycosis. The most affected areas of the body are toenails and fingernails. But the toenails are most reported to be affected by this. Onychomycosis or tinea is an infection of nails bed, matrix, or plate. It causes the many types of entanglement including cellulitis of lower legs and causes the plate, stitch, discomfiture etc. Although it is a function but without any pain [1]. This disease can also produce the visible and professional curb and trim the quality of life span. The superficial fungal infection is taken intently as it causes the epidemic health problems such as they produce the fungal stock that can be hand on through shoes and direct union. As a result, it can be transmitted from the toenails to other parts of the body. It occurs in 10% of adult population and is found more in males than in females [2]. Dermatophytes and fusarium are some fungus which the causes of the onychomycosis are. There may be three organisms of the fungal infection which causes the damage to the skin, hair, and nails, and they only feeds on the nails called the dermatophytes, yeast and non-dermatophytes but all these causes the similar and chronic functions. That is why only the visual appearance cannot explain which variety of the infection is caused by the which organism [3]. But the estimate of their infection is that the yeasts are responsible of 8% and non-dermatophytes are for 2%of fungal nail infection. Athlete’s foot and other nail disease are some of the hazard’s situations with the exposure to the peripheral vascular disease and impoverished immune function [4]. To find the reason the toenail to be infected we must know the dermatology of the nail. The place where the nail starts called the nail matrix is where the cell starts to multiply and keratinize before that they incorporated into fingernail or toenail. That matrix of the nail starts under the skin 5mm below the nail fold, and they surround the area called the lunula. The place where the finger or toe conformed to the nail called the cuticle which is adapted skin to blend them [5]. The nail bed is the spongy tissue underneath the nail and is protected by the nail plate and the nail bed anchoring the nail plate. Nail itself is the nail plate. Medication of the fungal nail is difficult due to the slow growth of the nail with a little blood supply. Cure in the past was less effective because of the upper drawbacks, but the recent researches allowing us the number of treatments with the option of oral intake and topical. Topical antifungals are applied to the skin and infected areas to kill the fungus and other pathogens [6].

Newer oral medicines have improved the treatment of fungal nail infection with the rate of cure is high even with a narrower medicine with some of the risks. Its cure is also available through surgery and laser treatment where some of the chemicals are applied to remove the contagious nail. The chemical that is urea compound can remove the thick nail and surgery treatment is not effective without any additional therapy that is why to attain the effective results the combination of oral, topical and surgical are used [7]. Some of the home remedies are also used such as coconut oil, tea tree oil, white vinegar, baking soda, lavender oil, garlic, orange oil but with little data to support it. Unluckily, it is impossible to prevent from getting this infection. But some of the preventive measures are that avoid from barefoot, wash the hand after greeting with the infectious person and use the antifungal spray in gym shoes [8]. Sixteen European countries found to be infected by onychomycosis according to the 2003 survey of disease on foot with prevalence of 27% and it was increased with age. Its prevalence is 6.48% in Canada. One third Diabetic patients are affected by it and 56% in those people which are suffering from psoriasis. The aim and objective of the current study was the awareness about onychomycosis.

Materials and Methods

We made the questionnaire to guestimate awareness about analysis of onychomycosis

a) Do you think onychomycosis is a viral disease?

a) Yes b) No

b) Onychomycosis is a bacterial disease

a) Yes b) No

c) Onychomycosis is a fungal disease

a) Yes b) No

d) Onychomycosis is a genetic disease

a) Yes b) No

e) Onychomycosis is a metabolic disease

a) Yes b) No

f) Had you ever suffered from Onychomycosis?

a) Yes b) No

g) Had your family member ever endure from onychomycosis?

a) Yes b) No

h) Your any relative ever undergoes to onychomycosis

a) Yes b) No

i) Is there any neighbor who is flagging with onychomycosis?

a) Yes b) No

j) Any of your friend go through onychomycosis

a) Yes b) No

k) Do you think that onychomycosis is transmitted through blood transfusion or contact?

a) Yes b) No

l) Can it be transfer from parents to offspring?

a) Yes b) No

m) Is it treated by the medicines?

a) Yes b) No

n) Onychomycosis can be handled by surgery

a) Yes b) No

o) What do you think that there is no need of treatment for onychomycosis?

a) Yes b) No

Statistically Analysis

Numerical investigation (statistical analysis) was fulfilled by adopting MS Excel.

Results and Discussion

Figure 1:

Lupinepublishers-openaccess-Agriculture

Figure 2:

Lupinepublishers-openaccess-Agriculture

Figure 3:

Lupinepublishers-openaccess-Agriculture

Figure 4:

Lupinepublishers-openaccess-Agriculture

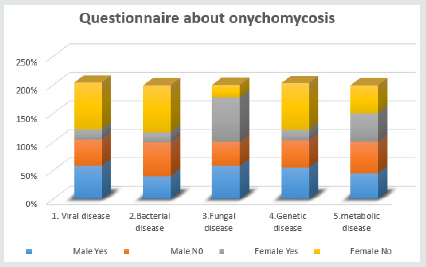
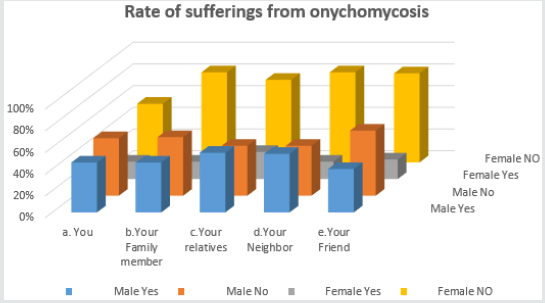
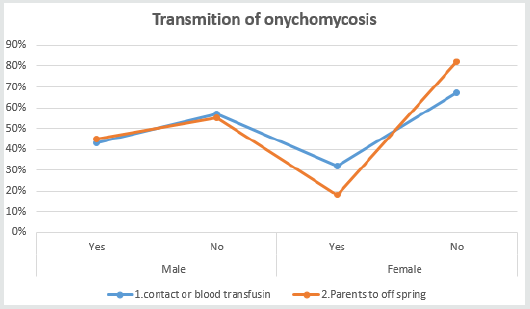
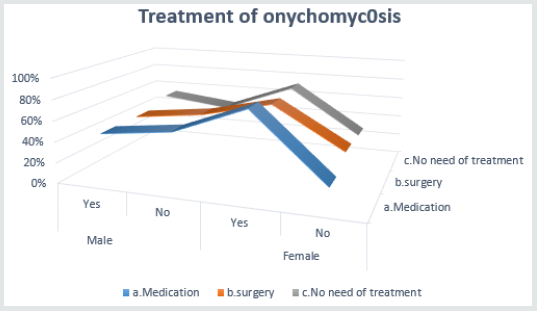
Perspective of postgraduate biology students about onychomycosis is given below in graphical representation (Figure 1). The graph above represents that onychomycosis is a fungal disease in views of 78% female and 58% male. 46% and 82% males and females respectively, assumed it not to be a viral bug and 40% males and 18% females took nail coloring as a bacterial stroke [9]. According to the current observation of its nature, 55%males,18%females estimated it to be genetic contagion and 45%amles and 50%females imagined it to be metabolic disorder (Figure 2). This graph illuminated that 46%males,16%females had an infection of onychomycosis and their family member and 55% and 25% their relatives also 54% and 16 % of their neighbors and 40% and 18%of the friends of males and females respectively tainted with onychomycosis [10] (Figure 3). The graph shows that onychomycosis never be transmitted through blood contact according to 43% males and 32%females. It also not be transmitted from parents to offspring in perspective of males and females (Figure 4). These ratios reveal that onychomycosis could be cured through surgery, medication or it had no harmful effect if it remained uncured in a viewpoint of 46%,46%,54%males and 81%,70%,71%females accordingly. Questionnaire based studies have given an important advancement in recent researches. Different numbers of researches have been done on the onychomycosis such as Figures 1.

Conclusion

It was completed from the current inspection that onychomycosis is a fungal disease. Both males and females suffered from it.

Read More About Lupine Publishers Journal of Biotechnology & Microbiology Please Click on Below Link:
https://lupine-biotechnology-microbiology.blogspot.com/
Thursday, 27 January 2022

Lupine Publishers | How Blood Group Influence Hair Texture?

 Lupine Publishers | Journal of Biotechnology & Microbiology


Abstract

Objective of present studies was to correlates blood grouping with hair texture. Total 181 subjects participated in present study. The subjects were students in Baha Uddin Zakariya University Multan, Pakistan. Blood groups are chemical system used in blood transfusion and determination of parentage. Two types of blood groups are discovered yet, ABO and Rh. A survey was performed among subjects of different blood groups to determine their hair texture. Each subject told either they had curly or straight hair with his consent. It was concluded from present study that females having B+ blood group had maximum straight hair while A- subjects (males and females), B- subjects (males & females), AB+ males, AB- subjects (males and females), O- males had minimum curly hair similarly AB- and O- males had minimum straight hair.

Keywords: Blood Group; Curly Hair; Straight Hair

Introduction

Blood groups are the complex chemical system that are present on the surface of blood cells. All bloods have the same basic components as red blood cells, white blood cells, platelets and plasma. There are two types of blood group system. ABO blood group and Rh. ABO blood system has four types. A (A+, A-), B (B+, B-), AB (AB+, AB-) and O (O+, O-). Blood group A has antigen A with anti-B antibodies. Blood group B has B antigen with anti-A antibody. AB blood group has both A and B antigen with no antibodies. Blood group O has neither A nor B antigen but with A and B antibodies. It is the most important blood group system for the blood transfusion in humans. O blood group individuals are called universal donor while AB blood group individual are called universal recipients [1]. Another type of blood group system is Rh blood group also called Rhesus system. It is encoded by the three genes C, D and E. The red blood cells in Rh system contain another antigen which is called Rd. antigen. It may be positive or negative. If it is present, then blood group will be Rd. positive but if it is absent then blood group will be Rd. negative. Hence, there will be eight blood groups such as A Rd. positive (A+), A Rd. negative (A-), B Rd. positive (B+), B Rd. negative (B-), O Rd. positive (O+), O Rd. negative (O-) [2]. Both these blood group systems were discovered by Landsteiner and used in blood transfusion and determination of parentage.

Hair is a protein which grows from the follicle present in dermis. It is very important biomaterial made up of protein called alpha keratin. Different varieties of hair textures are present but three most important are curl pattern, volume and consistency. According to some scientist’s shape of hair shaft determine hair texture i.e. either they are straight or curly. If hair shaft is round, then straight hair grows but if it is flatter then curly hair grow. Hair volume may be thin, normal or thick. In hair consistency, fine hair has smallest circumference, coarse hair has largest circumference while medium hair has circumference between these two. According to Andre Walker system, there are 4 types of hair. Curly, straight, wavy and kinky. Curly hair has “S” shape, depend on climate and can easily be damaged. Straight hair has beautiful and flexible hair texture. It becomes difficult to curl them. Wavy hair is between straight and curly hair. Kinky hair type is fragile and has tightly coiled curl. When they are wet, they shrink. Objective of present studies was to correlates blood grouping with hair texture.

Materials and Method

Blood Grouping

First of all, took needle and prick on the upper portion of finger for blood extraction. After this took a slide and add three drops of blood and 3 drops of anti-sera A, B and D on that slide. Anti-sera A and anti-sera B was used to check the blood type while anti-sera D was used to check the positivity or negativity of that type. Those anti-sera that showed precipitate formation would show our blood group type.

Project Designing

A survey among subjects of different blood groups to determine their hair texture was performed. Each subject told either they had curly or straight hair with his consent. Total 181 subjects participated in present study. The subjects were students in Bahaudin Zakariya University Multan, Pakistan.

Statistical Analysis

Statistical analysis was performed by using MS Excel.

Results and Discussion

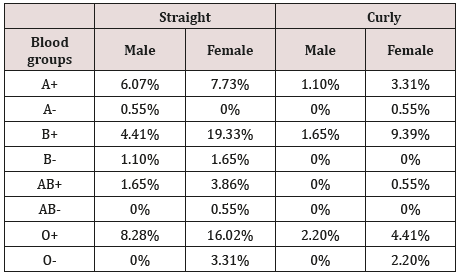
Blood group influence on hair texture is given in Table 1. Questionnaire based studies had given an important advancement in recent researches. Similar researches were also done by S Miyasaka et al from Forensic Science Institute in May-Jun 1987 and L Potsch-Schneider et al. Z Rechtsmed 1986 [3-10].

Table 1:

Lupinepublishers-openaccess-Agriculture

Conclusion

It was concluded from present study that females having B+ blood group have maximum straight hair while A- subjects (males and females), B- subjects (males & females), AB+ males, ABsubjects (males and females), O- males have minimum curly hair. Similarly, AB- and O- males have minimum straight hair.

Read More About Lupine Publishers Journal of Biotechnology & Microbiology Please Click on Below Link:
https://lupine-biotechnology-microbiology.blogspot.com/
Thursday, 20 January 2022

Lupine Publishers | Different Blood Groups Have Different Obesity Levels

 Lupine Publishers | Journal of Biotechnology & Microbiology


Abstract

Objective of this study was to correlate blood grouping with obesity. Total of 178 subjects were participated in this survey. The subjects were the students of Baradin Zakariya University Multan, Pakistan. Presence or absence of antigens on the surface of red blood cells is called blood group system. For checking the obesity level of different blood groups, I performed a survey in different subjects.

Keywords: Obesity; Blood grouping

Introduction

Blood group system is defined based on presence or absence of antigens present on the surface of red blood cells. Two types of blood group system are present ABO and Rh. The ABO blood group system was discovered by Karl Landsteiner. This blood group system is encoded by gene I which is single polymeric gene present on chromosome 9. Blood group A has an antigen on the red blood cells while have B antibody in the plasma. Blood group B has B antigen but with An antibody. Blood group O has no antigens but both antibodies are present in the plasma. A person with blood group A receives blood from A, O and donates to A and AB. A person with blood group B receives blood from B, O and donates to B and AB. As the persons with blood group O are called universal donor so they will donate blood to the all types but receives only from O. While AB persons are called universal acceptor, so they will receive blood from all the types but donate blood only AB persons [1].

Rhesus system is the second type of blood group system which is used in blood transfusion in humans. It has Rd. antigen. The person with Rh factor is called Rh positive while person which do not have Rh factor are called Rh negative. Rh+ donor is fully incompatible for Rh- recipients [2]. Genetic analysis of blood groups helps to solve the cases of disputed parentage. Obesity is the most worldwide problem. Since 1980 it becomes double throughout the world. A person gets excess fats in body and gains weight greater than normal healthy body weight. This condition is called obesity. Over eating, lack of exercise, diet high in fats, drinks, fast foods etc. all are the causes of obesity. Fat is necessary for our body to get energy but excess fats cause obesity. Obesity increases the risk of cancer, blood pressure, cholesterol levels, respiratory problems, heart diseases etc. Childhood obesity causes the premature death and disability in adulthood. Objective of this study was to correlate blood grouping with obesity.

Materials and Method

Blood Grouping

First a needle was used for pricking the finger and extracting blood from it. Then we placed three drops of blood on the slide. Three anti-sera A, B and D were used to check the blood group of the subject. Second, we placed these three anti-sera on the blood slide. Anti-D was used for checking the positivity or negativity of the blood and anti-A and anti-B were used for blood type. Precipitates formation showed the blood type of that subject.

Project Designing

For checking the obesity level of different blood groups, we performed a survey in different subjects. Each subject told me either he was obese or not. Total of 178 subjects were participated in this survey. The subjects were the students of Baradin Zakariya University Multan, Pakistan.

Statistical Analysis

Statistical analysis was performed by using MS Excel.

Results and Discussion

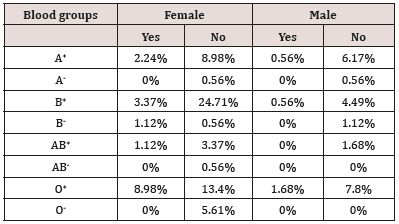
Different blood groups have different obesity levels are given in the Table 1. Questionnaire based studies in the recent researches have given an important advancement. Similar surveys were also done by Kumar Ganesan, Sharmila Banu Gain, G V Siva Krishnakanth, Dr. Umesh Pralhadrao Lad [3-10].

Table 1:

Lupinepublishers-openaccess-Agriculture

Conclusion

It was concluded that O+ females had highest obesity level and O- and AB- males had lowest obesity level.

Read More About Lupine Publishers Journal of Biotechnology Please Click on Below Link:
https://lupine-biotechnology-microbiology.blogspot.com/