Tuesday, 22 September 2020

Lupine Publishers | Intervarietal Hybridization and Genetic Diversity of Rice by Molecular Markers

          Lupine Publishers | Current Investigations in Agriculture and Current Research


Abstract

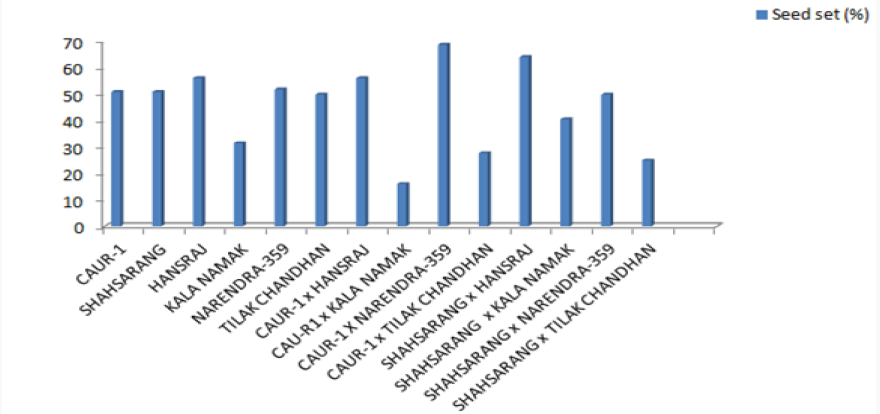
Cross ability of various accessions of Oryza sativa L. on the basis of pollen development and seed set was studied along with genetic diversity by RAPD and SSR markers. The variety Kalanamak had maximum number of fertile pollen (82.25%) whereas the variety Narendra-359 had the least number (61.03%). The cross of CAU R-1 with Hansraj (83.67%) gave the highest germination % after 1 hour. The cross of CAU R-1 with Narendra-359 gave the maximum seed set (68.96%). The pollen tube growth at 1 hour after pollination had a positive correlation with seed set. In general, selfing showed more pollen germination and pollen tube growth as compared to inter-varietal crosses with respect to seed set. Fourteen RAPD and eight SSR primers were used to assess the genetic diversity of 17 rice varieties. A total of 78 RAPD and 16 SSR amp icons were generated. The value of Jacaard’s similarity coefficient for RAPDs ranged from 0.284 to 0.766 with an average value of 0.526 whereas for SSRs it ranged from 0.071 to 1 with an average value of 0.396. The UPGMA cluster analysis grouped the 17 rice varieties in four clusters in case of RAPDs and three clusters in case of SSRs. The results of principal component analysis were comparable to the cluster analysis. In the Principal Component Analysis (PCA), for RAPD the first three components explained 65.86% of the total variation, with 53.21% explained by the first component and 7.23% by the second component, whereas for SSR the first three components explained 68.98% of the total variation, with 41.27% explained by the first component and 17.71% by the second component. The correlation coefficient and the significance of the correlation of the matrices based on RAPD and SSR data tested by the Mantel test showed that non-significant correlation (r=0.45) existed between both matrices.

Keywords: Crossability; Indica rice; pollen tube; Fruit set; RAPD; SSR

Introduction

Hybridization is one of the most commonly used breeding methods for improvement, mainly of open pollinated and often cross pollinated crops. The genetic improvement through hybridization and seed selection has been the main objective in the breeding programmes in rice. Inter-Varietal crosses have been used almost exclusively in the development of varieties by hybridization. The process of pollination and pollen germination leading to fertilization determines seed setting, and these processes are negatively affected by high temperature stress coinciding with a thesis [1]. Shi Qiang [2] reported that the rice pollen grain starts to germinate at 2min after pollination and the pollen tube penetrated stigma into style in 5-10 minutes, 30 minutes later the end of pollen tube reached the bottom of ovary, and only some pollen tubes arrived at embryo sac at 40 minutes after pollination. Variation in pollen tube growth rates in the pistil is frequently cited as a phenotypic manifestation of differences in gametophytic quality, leading to differences in the reproductive success among male gametes [3,4]. Jaitly, Khanna [5] reported that inadequate pollination, low % pollen germination and to some extent slow pollen tube growth and pollen tube abnormalities affect crossability in inter varietal crosses and the backcrosses in Oryza sativa accessions.

RAPD marker was first described by Williams, et al. (1990). Usually decamer primers are used to amplify the homologous sites of the target genomes. Polymorphisms are detected as presence or absence of bands. These markers have been used widely in many species because of their applications without prior sequence information. However, RAPD is very sensitive to reaction conditions and dominant in nature. Simple sequence repeat is an important tool for genetic variation identification of germplasm [6,7]. SSR markers have some merits such a quickness, simplicity, rich polymorphism and stability, thus being widely applied in genetic diversity analysis, construction of fingerprints [8,7], genetic purity test (Peng, et al. (2003)) and analysis of germplasm diversity [7,9,10] and utilization of heterosis, especially in identification of species with closer genetic relationship. Kibria et al. [11] studied molecular marker based genetic diversity analysis in aromatic rice genotypes by both SSR and RAPD markers through Marker Assisted Selection (MAS). They found that SSR markers are more effective in getting higher genetic diversity; however OPA 02 and 67 AB10G7 (RAPD) primers gave 100% polymorphism.

Materials and Methods

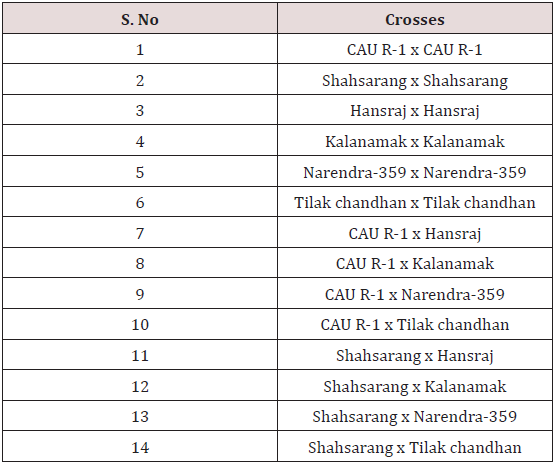
The experimental material used in the present study comprised of seventeen cultivated indica varieties of Oryza sativa L.viz. Pant dhan-10, Pant dhan-11, Pant dhan-12, Pant dhan-14, Pant dhan- 16, Pant dhan-17, Pant dhan-18, Pant dhan-19, Hansraj, Tilak chandhan, Kalanamak, KRH-2, CAUR-1, Shahsarang, Narendra-359, Basmati-370, Govind (Table 1). CAU R-1 and, Shahsarang were taken as female while Hansraj, Kalanamak, Narendra-359 and Tilak chandhan were taken as male. Emasculation was done in the morning and evening hours in a few selected florets from randomly selected plants. For each cross 15 panicles were randomly chosen from plants. Pollinations were performed from February to April and care was taken to avoid any damage to the stigma or ovaries. Spikelets from the top of the main axis of panicles, the primary rachis, as well as those belonging to the secondary and tertiary ones were detached, taking care that at least 35-45 florets from well defined portions of the panicle were retained; the florets were emasculated when the anthers were still pale green. The next day when the stigmas were feathery and receptive the pistils were hand pollinated with pollen from dehiscing anthers of the male parent. Eight to ten spikelets were taken at random from seven parental varieties and kept in vials containing 70% ethanol. The anthers from spikelets were squashed in a drop of 2% acetocarmine and observed under the microscope. The pollen grains which absorbed stain were classified fertile and those that did not absorb stain were classified sterile. The size of the pollen grain was measured with the help of a micrometer. In order to observe pollen germination on the stigma, pollen tube development in the style and entry of tubes into ovules, the spikelets were detached after 10 minutes and 60 minutes following hand pollination and fixed in 1:3 glacial acetic acid alcohols for 24 hours for further use. For further studies the spikelets were rinsed in distilled water and pistils were separated from the spikelets after which they were kept in a drop of 1N HCl for 10-15 minutes. They were again rinsed in distilled water and stained in cotton blue [12]. The pistils were then rinsed in distilled water and mounted in pure lactic acid. The pollen grains and pollen tubes stained deep blue.

Table 1: List of crosses made.
Lupinepublishers-openaccess-Agriculture

Genomic DNA from cucumber leaves was isolated using CTAB method of Doyle, Doyle [13]. Young actively growing leaves of 15- 20 days old plants were collected and used for DNA extraction. The quantification of DNA were done by staining DNA with ethidium bromide after electrophoresis in 0.8% agarose gel at 80V for 1 hour in TBE buffer (0.04M Tris borate, 0.001M EDTA, pH 8.0) using known DNA concentration standards. One per cent agarose gel was prepared by dissolving appropriate amount of agarose in 1 X TBE buffer for RAPD markers while 2% agarose was prepared for SSR markers. EtBr was added to a final concentration of 2μl/ ml and mixed well. The melted agarose was poured into a gel mould and the gel was mounted in an electrophoresis. A pre run of 15 minutes at 50 volts was given to the gel. The gel loading dye was mixed with DNA samples in 1:1 ratio and loaded in the gel with a micropipette. Electrophoresis was done at 90V for 1-2hrs. The gel was visualized and photographed in a Gel Documentation system. Molecular weights of bands were estimated by using 1Kb ladder for RAPD and 100bp for SSR. The homology of bands was based on distance of migration in the gel. RAPD and SSR amplicons obtained from each entry were resolved as multiple and a single band on the agarose system, respectively and the data set were used to calculate pair wise similarity coefficients following Jaccard [14]. The similarity matrices constructed were subjected to cluster analysis by unweighted pair group method of arithmetic average (UPGMA) analysis to generate dendrogram. These computations were performed using NTSYS-PC ver. 2.02 j, Exeter Software [15]. Mantel’s correlation test was performed by calculating correlations between Jaccard’s similarity coefficients and cophenetic values for each pair of comparisons [16]. The raw data matrix was used to calculate correlations between variables. The correlation matrix was subjected to “Eigen” vectors analyses, following which the principle components were extracted using the “Projection” module in NTSYS-PC. The first three most important PCA were used to construct a three dimensional plot of the accessions.

Result and Discussion

Pollen fertility

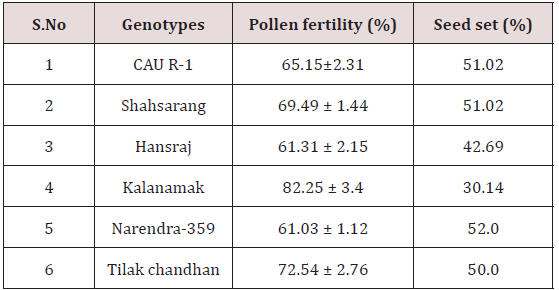
Pollen fertility was recorded in all the six parents. The fertile pollens picked up the acetocarmine stain and were stained red.

The variety Kalanamak had the maximum number of fertile pollen (82.25%) whereas the variety Narendra-359 had the least number (61.03%) (Table 2).

Table 2: Pollen viability in parents (10 X).
Lupinepublishers-openaccess-Agriculture

Pollen grain size

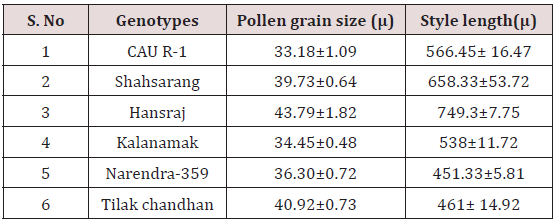
The size of the pollen grain did not show much difference among the parents. The diameter of the pollen grain size ranged from 34-44μ. Among the parents (Table 3) the pollen grains of Hansraj (43.79μ) were the largest and those of CAU R-1 were the smallest (33.18μ).

Table 3: Pollen grains size and length of styles (μ) in parents.
Lupinepublishers-openaccess-Agriculture

Pollen germination

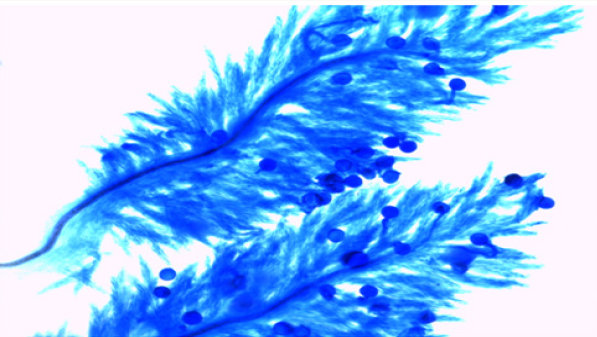
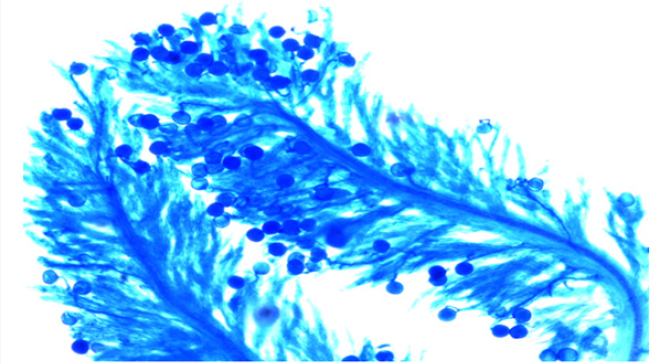
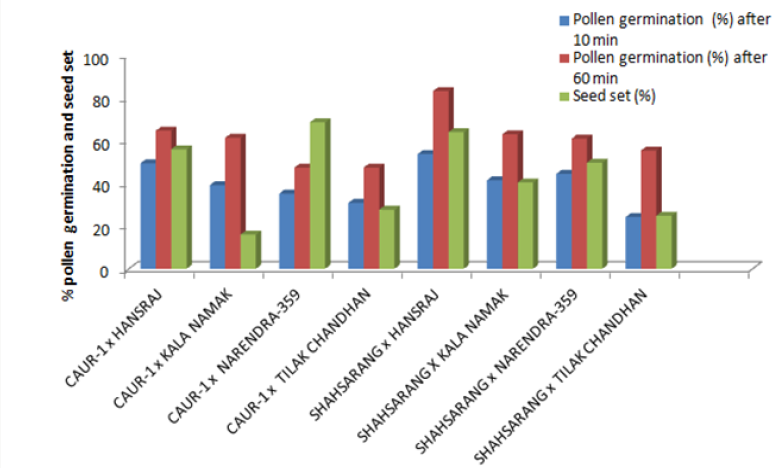
The onset of pollen germination did not show much variability among the parents. The least pollen germination percentage among parents after 10 min. was recorded in Shahsarang (23.33%) and the highest was in CAU R-1 (42.78%) whereas after 60 min of pollination Shahsarang has the highest pollen germination (55.67%) and Narendra-359 has the lowest (43.67%). Among the crosses, after 10min Shahsarang x Tilak chandhan has the lowest germination percentage (24.33%) and Shahsarang x Hansraj (54%) and has the highest. After 60 min. CAU R-1 x Tilak chandhan (47.67%) has the lowest and again Shahsarang x Hansraj (83.67%) has the highest germination percentage (Figures 1-9).

Figure 1: Pollen germination in CAU R-1 10 min after pollination (10X).
Lupinepublishers-openaccess-Agriculture

Figure 2: Pollen germination in selfing of Narendra-359, 1 hour after pollination (10X).
Lupinepublishers-openaccess-Agriculture

Figure 3: VOLVO heavy truck running on Dimethyl ether.
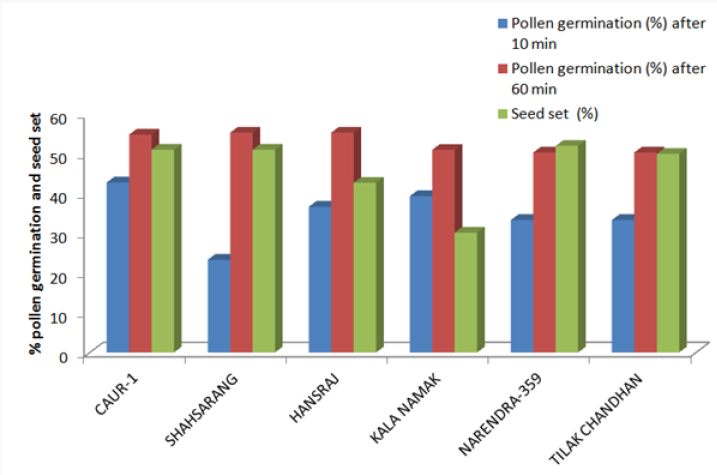
Lupinepublishers-openaccess-Agriculture

Figure 4: Percent pollen germination and seed set at different timings on crosses.
Lupinepublishers-openaccess-Agriculture

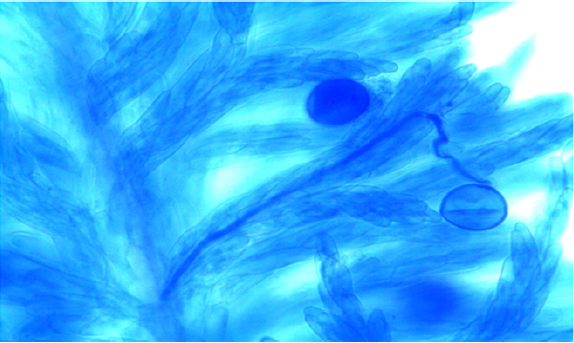
Figure 5: Pollen tube growth in CAU R-1 x Narendra-359 1 hour after pollination (40 X).
Lupinepublishers-openaccess-Agriculture

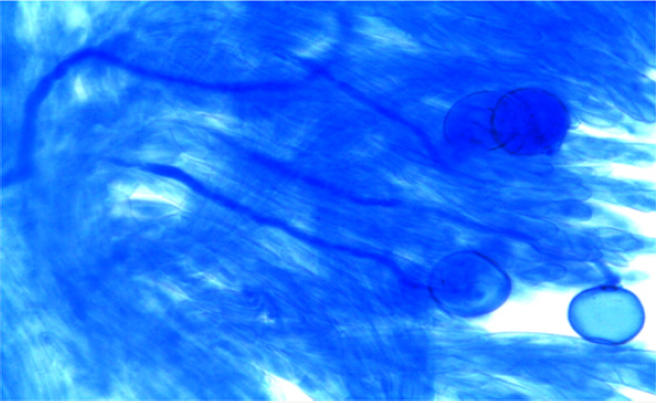
Figure 6: Pollen tube growth in CAU R-1 X Narendra-359 1 hour after pollination (40 X).
Lupinepublishers-openaccess-Agriculture

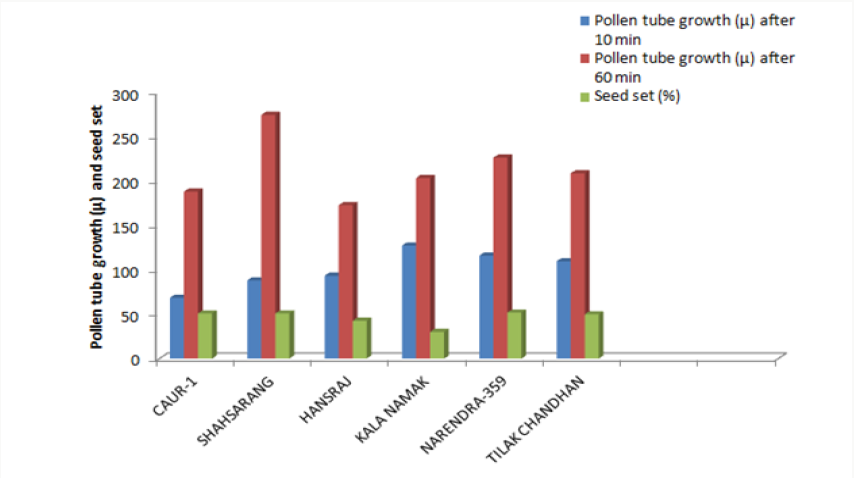
Figure 7: Pollen tube growth and seed set at different timings in selfing.
Lupinepublishers-openaccess-Agriculture

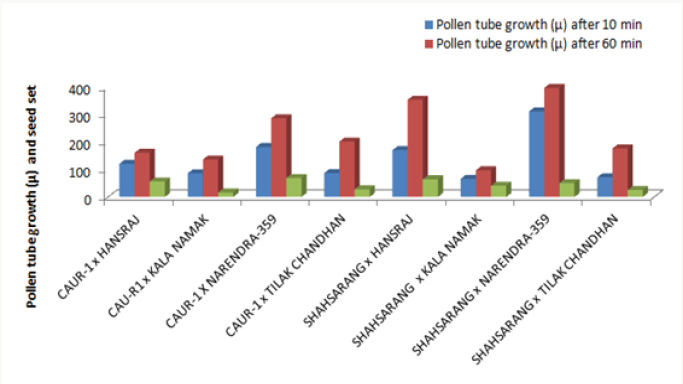
Figure 8: Pollen tube growth and seed set at different timings in crosses.
Lupinepublishers-openaccess-Agriculture

Figure 9: Seed set percent on selfing and crosses.
Lupinepublishers-openaccess-Agriculture

Correlation

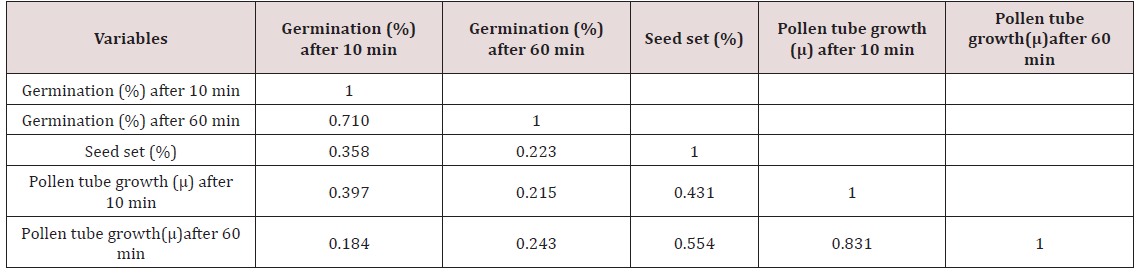
The correlation studies were done for the pre fertilization factors in the inter varietal crosses performed for the seed set. A positive correlation of seed set with pollen tube growth after 60 min was established. A positive correlation with pollen germination was established which was nonsignificant at 5% level of significance (Table 4).

Table 4: Correlations for various characters in inter varietal crosses of Oryza sativa.
Lupinepublishers-openaccess-Agriculture

RAPD Analysis

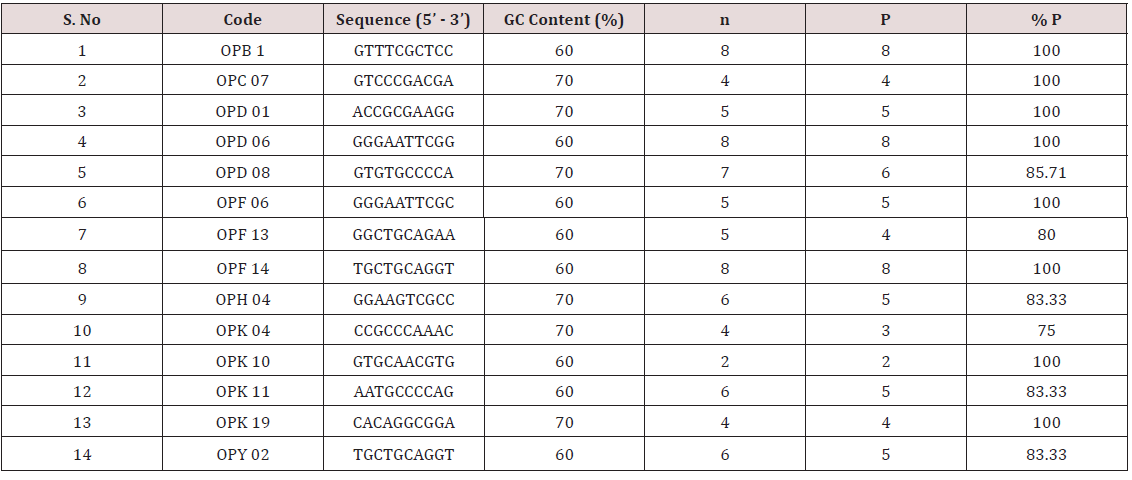
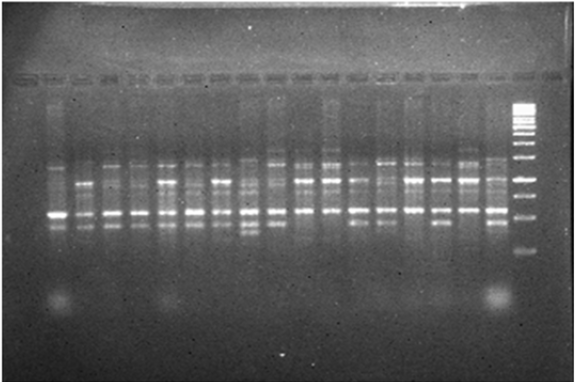
All the 17 cultivars were subjected to PCR amplifications using 14 RAPD primers. A total of 78 amplification products were scored in the 17 cultivars with different primers, which exhibited an overall 92% polymorphism (Table 5). The average numbers of amplification products formed were 5.57 with a maximum of 8 (OPB 1; OPD-06; OPF 14) and a minimum of 2 (OPK 10). The size of the amplification products varied in case of each primer and the range was 0.10 kb to 1.85kb. In general, the extent of polymorphism found was high. Eight out of 14 primers showed 100% polymorphism. Three primers (OPB 1; OPD-06; OPF14) were found to be most polymorphic whereas OPK 04 was the least polymorphic primer (Table 5). The data obtained from RAPD analysis were subjected to UPGMA analysis to find out the relationship between the cultivars analyzed. The value of Jacaard’s similarity coefficient ranged from 0.284 to 0.766 with the average value of 0.526 (Figure 10).

Table 5: Sequence, Total no. of amplification product (n), Total no of polymorphic products (P), percentage of polymorphism (% P) of RAPD markers.
Lupinepublishers-openaccess-Agriculture

Figure 10: RAPD profile generated by OPD 08. M = molecular size ladder, 1kb.
Lupinepublishers-openaccess-Agriculture

Figure 11: Phenogram generated using UPGMA analysis showing relationship between 17 cultivars of rice using RAPD markers.

Lupinepublishers-openaccess-Agriculture

Figure 11 shows the clustering pattern obtained from the UPGMA analyses of the data. Overall, four distinct clusters were formed. Three cultivars (Pant dhan 10, Pant dhan 14 and Govind) grouped in cluster IV and appear to be the most distinct from all others. Basmati 370 and Narendra 359 were present in cluster I. Cluster II comprises of 11 cultivars. Cultivars within cluster II are further grouped in three sub- clusters. The first sub cluster comprises of two cultivars, Tilak chandan and Kalanamak and both of these are landraces. Pant dhan 12, Pant dhan 16 and Pant dhan 18 forms a different sub cluster in cluster II. CAU R 1 and Shahsarang from North-east region and four other cultivars are present in another sub cluster. Cluster III comprised of a single cultivar i.e. Pant dhan 11. The Goodness-of-Fit of the UPGMA dendrogram generated with RAPD data were tested by 2-Way Mantel test [16]. High support for clustering patterns was observed for the cluster with Matrix correlation (r) as 0.82.

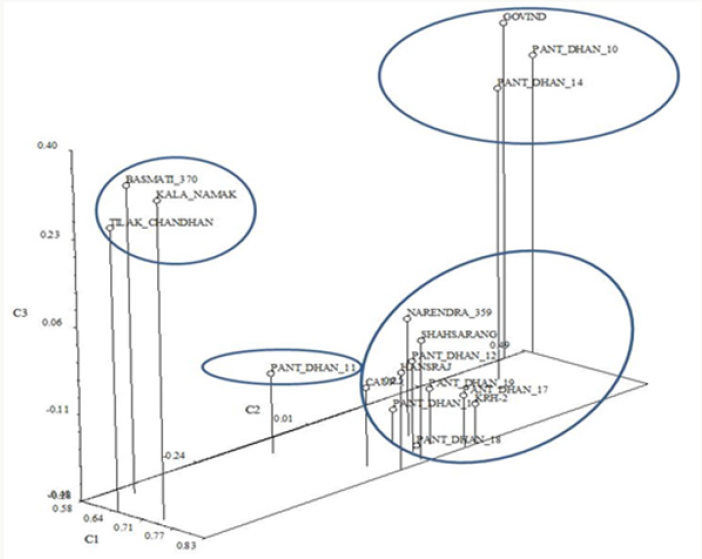
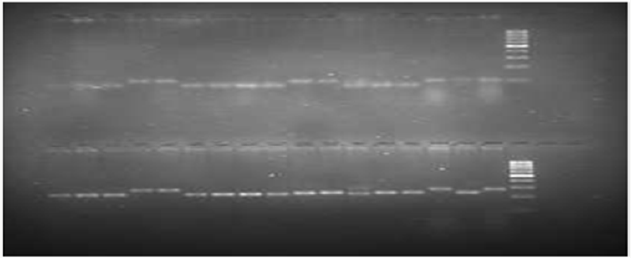
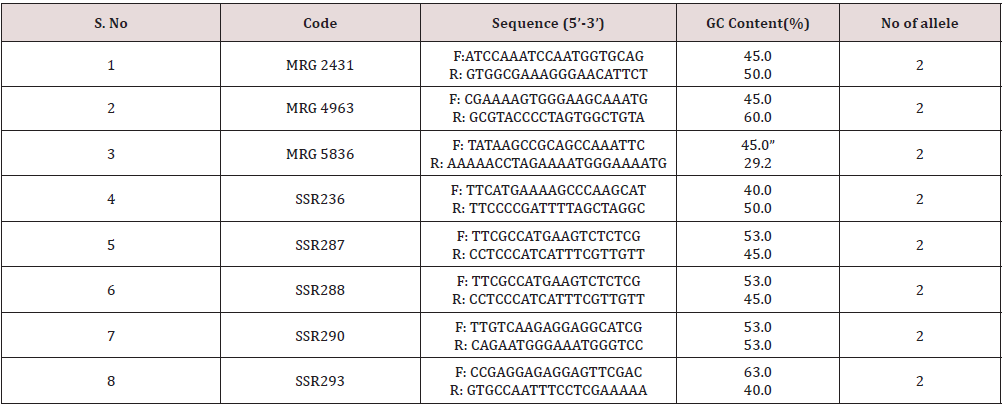
In the Principal Component Analysis (PCA) (Figure 12), the first three components explained 65.86% of the total variation, with 53.21% explained by the first component and 7.23% by the second component. In the three-dimensional plot the grouping pattern of Kalanamak, Tilak chandan and Narendra 359 were different as compared to the UPGMA cluster analysis. For SSR analyses, out of 8 primer pairs used for the genetic diversity analysis, 8 were found to be polymorphic. The polymorphic primers generated a total of 16 alleles. All 8 primers had two alleles (Table 6). The data obtained from SSR analysis were subjected to UPGMA analysis to find out the relationship between the cultivars analyzed. The value of Jacaard’s similarity coefficient ranged from 0.071 to 1 with the average value of 0.396 (Figure 13).

Figure 12: Phenogram generated using UPGMA analysis showing relationship between 17 cultivars of rice using RAPD markers.
Lupinepublishers-openaccess-Agriculture

Figure 13: Phenogram generated using UPGMA analysis showing relationship between 17 cultivars of rice using RAPD markers.
Lupinepublishers-openaccess-Agriculture

Table 6: Forward and backward primer sequence for polymorphic STMS primers.
Lupinepublishers-openaccess-Agriculture

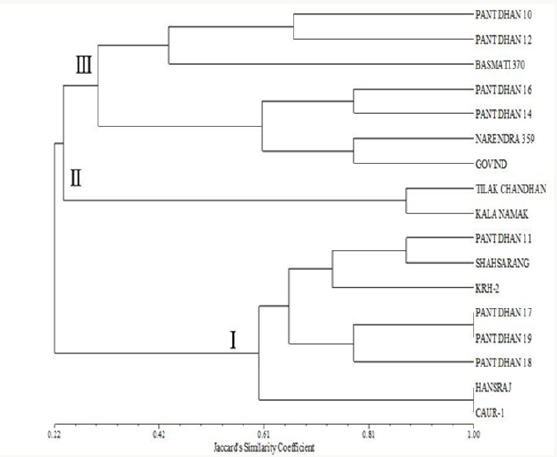
Figure 14: Phenogram generated using UPGMA analysis showing relationship between 17 cultivars of rice using SSR markers.
Lupinepublishers-openaccess-Agriculture

Figure 14 shows the clustering pattern obtained from the UPGMA analyses of the data. Overall, three distinct clusters were formed. Two cultivars (Tilak Chandan and Kalanamak) grouped in cluster II. Cluster I comprises of 8 cultivars. Cultivars within cluster I are further grouped in three sub clusters. The first sub cluster comprises of two cultivars, Hansraj and CAU R1. Pant dhan 17, Pant dhan 18 and Pant dhan 19 forms a different sub cluster. KRH-2, Pant dhan 11 and Shahsarang were present in another sub cluster. Cluster III comprised of 7 cultivars. Cultivars within cluster III are further grouped in two sub clusters. The first sub cluster comprises of three cultivars, Basmati 370, Pant dhan 10 and Pant dhan 12. Pant dhan 16, Pant dhan 14, Narendra 359 and Govind were present in another subcluster.

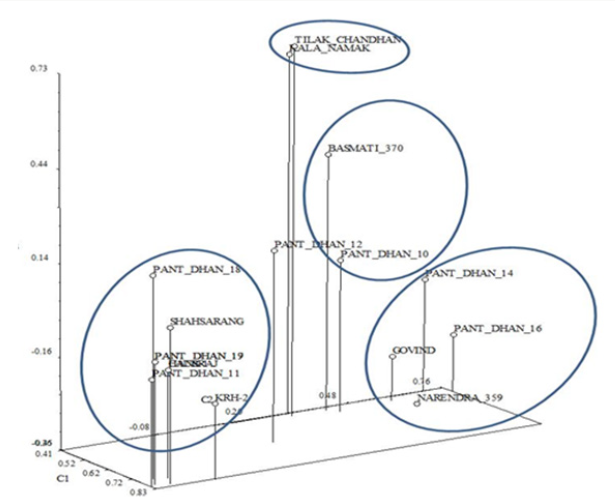
The Goodness-of-Fit of the UPGMA dendrogram generated with RAPD and SSR data were tested by 2-Way Mantel test [16]. High support for clustering patterns was observed for the cluster with Matrix correlation (r) as 0.92. In the Principal Component Analysis (PCA) (Figure 15), the first three components explained 68.98% of the total variation, with 41.27% explained by the first component and 17.71% by the second component. In general, the three dimensional plot grouping pattern, except for Pant dhan 12, was comparable to the UPGMA cluster analysis. The correlation coefficient and the significance of the correlation of the matrices based on RAPD and SSR data tested by the Mantel test showed that non-significant correlation (r=0.45) existed between both matrices.

Figure 15: Three-Dimensional plot of first three principal components extracted by Principal Component Analysis of 16 SSR amplification products from the SSR analysis of 17 rice cultivars.
Lupinepublishers-openaccess-Agriculture

Read More Lupine Publishers Agriculture Journal Articles:

Monday, 21 September 2020

Lupine Publishers | Perceived Effects of Resource-Use Conflicts on Rural Women Farmers in South-east Agro-Ecological Zone of Nigeria

         Lupine Publishers | Current Investigations in Agriculture and Current Research


Abstract

This study analyzed specifically the effects of resource-use conflict especially, land on rural women farmers in Southeast, Nigeria. .A total of 300 rural women farmers were purposively selected from 3 states in southeast where conflicts have occurred. Data collected were analyzed descriptively–using percentages, mean and standard deviation. Results got showed that farmerfarmer conflicts, pastoralists– farmer conflicts and communal conflicts were predominant in the study area with 100% response. The major causes of resource use conflicts were increasing population (M=3.37), overgrazing of farmland (M=3.35), breakdown of moral economy (M=3.57), pollution of water (M=3.46), among others. The effects on women included reduced crop yields (M=3.37), burning of crops (M= 3.38), reduced farm, reduced income (M=3.01), loss of human lives (M=3.56), rape/abduction of women (M=3.00), hatred (M=2.63), fear (M=2.57), widowhood (M=2.93) among others. The following strategies were identified, giving financial assistance to victims (M=2.65), creating job opportunities (M=2.53), proper land use planning (M=2.63), compensation to land owner (M=3.67). These farmers could be helped provision of credt facilities and proper land use planning programme.

Keywords: Conflicts; Farmers; Agriculture; Health; Women

Introduction

Worldwide, land remains an important natural capital for every nation and individuals, and because of this, it’s not unusual that there is land conflict across the world, especially in developing nations where a huge population depends on agriculture for their livelihood [1]. Land-related conflicts are increasingly becoming a threat to rural economic activities such as agriculture in most sub- Saharan African countries [2,3]. The prevalence of these conflicts is escalating at a time when crop yields are stagnant or even declining for some countries in the region [4]. It is therefore apparent that, as governments grapple to enhance technology adoption and revamp the agriculture sector’s performance to meet the high and increasing demand for food, land tenure security becomes crucial in attaining this goal [5].

In most African countries, land conflict commonly arise at the countries’ boarder level, district boarder, among ethnic groups, in the community over common land, between individuals over boundary [6]. Land conflict between individuals is the most common type of conflict in the rural community, and yet in many cases, conflict at this level lacked sufficient attention from the authority. On the other hand, countries’ boarder conflict, district and inter-ethnic land conflict received major response, which tends to result into immediate solution due to political dimension involved [6]. Because of lack of attention by the authorities over land conflict at the rural community, some vulnerable people like women and orphans have continued to lose their rights to land to the greedy people. Some people have lost their lives due to land fight and some incidences of land conflict creates hatreds among the parties involved which goes on from generation to another. Moreover, the individuals who lose their rights to land due to conflict find themselves in deep poverty, due to decline in productivity, food insecurity and a fall on the income level. The increase in the incidences of land conflict in Africa is largely being attributed to the failure of existing land tenure systems to address the challenges that hinders use of land in more effective way, which would permit investment and enhance productivity ref. The struggle for land is also being exacerbated by increase in population, resource scarcity and other factors like technological change, improved terms of trade for agriculture and demand for land for non-agricultural use [7] also looked at exclusion and relative deprivation as major cause of conflict in Africa.

Nigeria has experienced conflicts of grave proportions among several ethnic and religious communities in different regions and states. In the far north, for instance, a conflict of religious nature continues to break out at locations like Kano, Katsina, Zaria and Kaduna, and more recently, Maiduguri among other places [8]. In the Southwest there were violent communal conflicts at Sagamu, Lagos, Ife -Modakeke, etc. In the South-East, the Umuleri-Aguleri conflicts were most noticeable. The communal and oil-induced conflicts in the Niger Delta also increased in scope and intensity [9]. However, a research conducted by Elaigwu (2005) confirms that some states in the Northern Nigeria have experienced one or more ethno-religious conflicts except Kogi and Zamfara States. These conflicts have adversely affected the country’s development and security.

Land is probably the most important resource needed by man for his day-to-day existence. All human livelihoods and activities are directly or indirectly dependent on land at varying thresholds [8] Land connotes different meanings to the various user groups. For instance, builders, manufacturers, fishermen, miners, hunters and farmers have different specifications in their requirement for land for their production/services. Out of all user-groups, agricultural production perhaps exhibits the highest form of sophistication in its use of land [10]. Not only must agricultural land be capable of supplying crop-specific nutrient and water; soil temperature, structure, texture and pH levels are inevitable requisites in the choice of land for agricultural production activities; yet, land is a limited, somewhat scarce resource with natural access and usage barriers.

These factors of specifications, multifarious uses of land and its limitedness have necessitated that various shades of competition for its utilization must ensue. Thus, competition for land between and within various user groups has been the bane of mankind since time immemorial. Non-agricultural user groups compete with agricultural user groups on one hand, while there are various levels of intra user -group competition on the other hand. Indeed competition for land use is becoming keener and fiercer, largely due to increasing human and animal populations [11]. It has been illustrated that increasing population growth rate has continued to exert great pressure on available land resources with varying environmental and socio-economic implications [12-14].

Farmer-herdsmen conflict has remained the most preponderant resource-use conflict in Nigeria [15,16]. The necessity to provide food of crop and animal origin, as well as raw materials for industry and export in order to meet ever- growing demands, has led to both intensification and intensification of land use [17]. The competition of these two agricultural land user-groups, however, has often times turned into serious overt and covert manifestation of hostilities and social friction in many parts of Nigeria. The conflicts have demonstrated high potential to exacerbate the insecurity and food crisis particularly in rural communities where most of the conflicts are localized, with reverberating consequences nationwide.

Ajuwon [15] reported farmer – herdsmen conflict in Imo State, Southeast Nigeria. He noted that between 1996-2003, nineteen (19) people died and forty two (42) people injured in this rising incident of farmers–herders conflicts and the violence that often accompanies such conflict is an issue that can be regarded as being of national concern [15]. These conflicts were threats to both peace and national stability. Again, in a study carried out in Nigeria’s Guinea Savannah, Fiki & Lee [14] reported that out of 150 households interviewed, 22 reported loss of a whole farm of standing crops, 41 reported losses of livestock, while eight households from either sides reported loss of human lives. Their study also indicated that stores, barns, residences and household items were destroyed in many of the violent clashes. Serious health hazards are also introduced when cattle are made to use water bodies that serve rural communities.

Statement of the Problem

The effects of conflicts world over have been documented in scholarly literature. These include death, displacement, health, and education [18]. In the view of Yahaya [19] conflict disrupts markets, banking, and credit systems. In the absence of all these facilities life becomes unbearable for the society at large but women and children face the consequences more than men because of cultural roles assign to them. Nevertheless, even when exposure to actual armed violence is limited, the effects in terms of loss of security, income and service access, displacement, and other such phenomena are considerable. Notwithstanding this, little attention have been given to the socio-economic, health and psychosocial effects of land conflict on women in Southeast states of Nigeria where land conflicts of different categories have occurred. It is in line with this that this paper sought to examine the socio-economic effects of land conflict on women and children in the three southeast states namely Abia, Imo, and Enugu. The general objective of the paper is to examine the socio-economic effects of land conflict on women and children in the study states. The specific objectives were to

a) Identify the various forms/types of conflicts in the study states.

b) Ascertain perceived causes of land-related conflicts in the areas.

c) Describe effects of land-related conflicts on agricultural production, health and psychosocial well-being of the respondents and

d) Identify strategies for cushioning the effects land-related conflicts on the respondents.

Methodology

This study was conducted in southeast agro-ecological zone of Nigeria, characterized by tropical rainforest. The Southeast agroecological zone lies within latitudes 5oN to 6oN of the equator and longitudes 6oE and 8oE of the Greenwich meridian. Southeast Nigeria is made up of five (5) states-Abia, Anambra, Ebonyi, Enugu and Imo. The zone occupies a total land mass of about 10, 952, 400 hectares with a population figure of 17, 381, 729 person in 2016 projected from 2006 National Population Commission Census figure [20]. The multi-stage (4-stage) sampling technique was adopted in the process of sample selection. The first stage was the purposive selection of three states from the Southeast agro ecological zone, where cases of conflicts including farmer-pastoralists conflicts have occurred and were reported. Here, Abia, Enugu and Imo States were selected since conflicts occurrences have been recorded and reported widely.

Again, Enugu was selected because it is the gateway through which the nomads enter southeast from the North-central, settle and graze before moving to the other states of the Southeast. The second stage involved the purposive selection of the Local Government Areas where these conflicts occurred. In Abia State, two Local Government Areas were selected, namely Umunneochi and Ugwunagbo Areas. In Enugu, Uzo-uwani, Nkanu West and Udi Local Government Areas were also selected for the study, while in Imo State, Ohaji/Egbema, Owerri West, and Okigwe Local Government Areas were chosen as well.

The third involved the purposive selection of the communities in the Local Government Areas, where conflicts between crop farmers and pastoralists have occurred. In Abia, Isuochi and Lokpanta communities were chosen from Umunneochi Area, while Uturu was selected from Ugwunagbo Area. From Enugu State, Nimbo (Uzo-uwani), Ishi-ozalla (Nkanu West) and Ogui-Agueke (Udi) communities were chosen from the three Local Government Areas. From Imo State, Awarra and Umuapu (Ohaji/Egbema), Irete (Owerri West) and Ihube (Okigwe) communities were selected. The fourth stage involved the proportionate selection of 105 crop farmers from a total of 1050 affected farmers from Abia state, 69 crop farmers from a total of 695 crop farmers from Enugu state and a selection of 126 affected crop farmers from a total of 1260 affected farmers from Imo state.

This gave a total sample size of 300 crop farmers selected from the household lists of 3,005 crop farmers affected by the conflicts obtained and compiled by various agencies of the three States (Office of the Governor on Peace and Conflict Resolution; Local Government and Chieftaincy affairs). The primary data were collected through questionnaire (survey), observation, and interview schedule. The data were collected from women farmers only. The secondary data were obtained from publications, such as research reports, academic journal and conference proceedings found relevant to this study. Descriptive statistical tools such as percentages presented in frequency distribution tables, bar chart, mean and standard deviation were used to achieve. Mean was computed on a 4-point Likert type rating scale of strongly agree, agree, disagree and strongly disagree assigned weight of 4,3,2,1 to capture the perceived causes of the conflicts.

The values were added and divided by 4 to get the discriminating mean value of 2.5. Any mean value equal to or above 2.5 was regarded as a major factor causing conflict, while values less than 2.5 were regarded as minor factors. Mean was also computed on a 3-point Likert type rating scale of major effect, minor effects, and no effect assigned weight of 3,2,1 to capture the perceived effects of land-related conflicts on the respondents. The values were added and divided by 3 to get the discriminating mean value of 2.0. Any mean value equal to or above 2.0 was regarded as major factor effects of land-related conflict, while values less than 2.0 were regarded as no effects. Mean was computed on a 4-point Likert type rating scale of strongly agree, agree, disagree and strongly disagree assigned weight of 4,3,2,1 to capture the perceived strategies to cushion the effects of land-related conflicts (objective 4). The values were added and divided by 4 to get the discriminating mean value of 2.5. Any mean value equal to or above 2.5 was regarded as a major strategy for cushioning effects of land-related conflict, while values less than 2.5 were not regarded as strategies.

Results and Discussion

Types/dimensions of Conflicts in study states

Table 1 showed that the respondents have witnessed conflicts of different dimensions in the study area. The commonest being communal conflicts, farmer–farmer conflicts and pastoralists–crop farmer’s conflicts (100%). These 3 types of conflicts are regularly occurring in the study with grave consequences on individuals living. The 3 types of conflicts identified are mostly occasioned by land use competition and control. Other forms of conflicts were religious conflicts (36.6%), political/civil unrest/disturbances (21.3%) and farmer-conservationists conflicts (3.3%) which occur in forest reserves and settlements where farmers fell trees for staking yam and homestead buildings. According to Mohamed and Ventura (2000 conflict on land and other natural resources can be a result of disputes within one or among several communities, such as boundary dispute between the community and outsiders, boundary dispute between members of the community, resource use dispute between community and outsiders, resource use dispute between community members, land use dispute between community and outsiders as well as land use dispute between community members. This means that conflicts inland uses and other natural resources are typically associated with opposing interests over the type of land use, limited access and use rights, unclear ownership and property rights, and the delineation of boundaries.

Table 1: Types/dimensions of Conflicts in study states Field survey, 2016.

Lupinepublishers-openaccess-Agriculture

Perceived causes of land-related conflicts in the study states

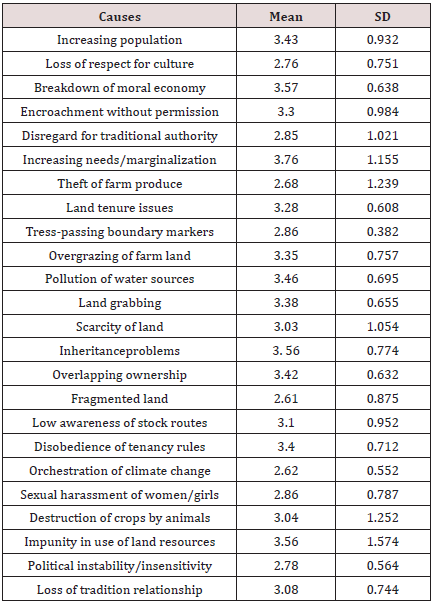
Table 2 showed the distribution of respondents by their perceived causes of land-related conflicts. Based on a discriminating index of 2.50, the causes of land–related conflicts were varied and many. They are increasing population with a mean response 3.43, loss of respect for culture (M=2.76), breakdown of moral economy (M=3.57), encroachment without permission (M=3.30), land tenure issues (M=3.28), trespassing boundary markers (M=3.35), land grabbing (M=3.38), scarcity of land (M=3.03), inheritance problems (M=3.56), overlapping ownership (M=3.42), fragmented landholdings (M=2.61), disobedience of tenancy rules (M= 3.40), and loss of traditional relationship (M=3.08). These are major causes of land – related conflicts when those involved are all crop farmers.

Table 2: Causes of land-related conflicts, Field survey, 2016 Mean=2.50 above were major causes.

Lupinepublishers-openaccess-Agriculture

Again, when pastoralists are involved the following are possible causes conflicts, theft of farm produce for poverty alleviation by pastoralists (M=2.68), pollution of water sources (M=3.46), this happens when cattle defecate on rivers/streams, regarding land as common property (M=3.10), sexual harassment of women and girls (M=2.85), and destruction of crops by animals (M=3.04). Other causes of land related conflicts could be climate change issues (M=2.62) which affects the distribution of natural resources such as water and grasses, increasing needs for land and marginalization (M= 3.76). Again, political instability/insensitivity (M=2.78) could also cause conflicts when there is change in policies of government and when the government cannot live up to its responsibility in protecting the citizenry.

When resources are scarce or abundant, political instability makes countries much more vulnerable to conflict. Instability impacts not only the governance structure, but also all other infrastructures that depend on government control and oversight, such as the banking system, national oil-production facilities, highways and ports. Population growth, environmental degradation, and resource inequality can combine to weaken an already unstable government’s capacity to address the needs of the populace and thus fuel conflicts. And abundance of natural resources can provide the incentive for increased conflict over control of the incomegenerating sources [21].

Furthermore, political conflicts that turn violent often result in destruction of the environment and infrastructure that increases the scarcity of resources, which in turn increases the potential for violent conflicts over the scarce resources. Conflicts often damage infrastructure, such as pipelines or oil fields, and decrease productivity of mining, thus furthering the downward spiral in economies affected by conflict. In addition, poor management and oversight resulting from political instability accelerate the economic decline.

Perceived effects of land-related conflicts on agricultural production of respondents

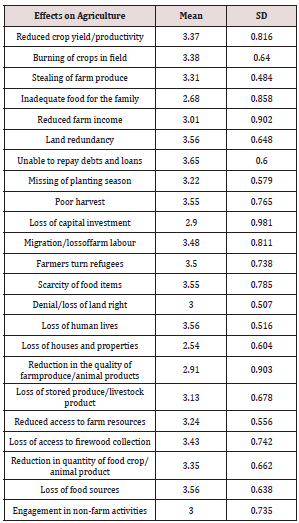
Table 3 showed that all the respondents suffered the consequences of land–related conflicts as it touched their livelihood activity–agricultural production. The effects of the conflicts on agricultural production were reduced crop yield/ productivity (M=3.37), burning of crops in field (M=3.8), stealing of farm produce (M=3.31), inadequate food for the family (M=2.68), reduced farm income (M=3.01), land redundancy/abandonment (M=3.56), unable to pay debts and loans (M=3.65), missing of planting seasons (M=3.22), poor harvests (M=3.55), loss of capital investments (M=2.90),migration/loss of farm labour (M=3.48), farmers turn refugees (M=3.50), denial of land rights (M=3.00), loss of human lives (M=3.56), loss of houses and property (M = 2.54), reduction in the quality of farm produce (M=2.91), loss of stored produce/livestock products (M=3.13), reduced access to farm resources (M=3.43), loss of access to firewood collection (M=3.43), reduction in quantity of food for human consumption (M=3.35), loss of food sources (M=3.56) and engagement in nonfarm activities (M=3.00).

Table 3: Perceived effects of land–related conflicts on Agricultural Production,Field survey, 2016 mean score 2.50 above are major effects.

Lupinepublishers-openaccess-Agriculture

Since rural community, rely on their produce mainly for home consumption, reduced production result into food scarcity/ insecurity. The victims of land conflict are therefore vulnerable to malnutrition, as result on inadequate food, which are known to affect women and children most and is a main factor for 60% death of children under five years of age [22]. More so, in the course of conflict resolution, the victims have to spent money or saving which reduces the capital investment. Sometimes, they failed to pay for family needs such as school fees for their children and some food stuffs. Reduced production also undermines potential for future growth.

In addition, certain members of households and communities have less access to regular food sources or emergency rations because they are relatively powerless as a result of their age or gender status. These include women, children, and the elderly, who are the most frequent victims of hunger in food wars, because they are left behind when active males migrate in search of food or are commandeered into military service where they are fed. Women often are forced to give up local assets (land, seeds), go without extra labour (especially of absent males), suffer lack of protection (against violence, as local community moral and social structures are destroyed), and enjoy less health care. Both women and children suffer disproportionately from illness, where malnutrition and destruction of healthcare services render them more vulnerable, especially if, in the end, they are forced to flee in search of survival.

Health effects

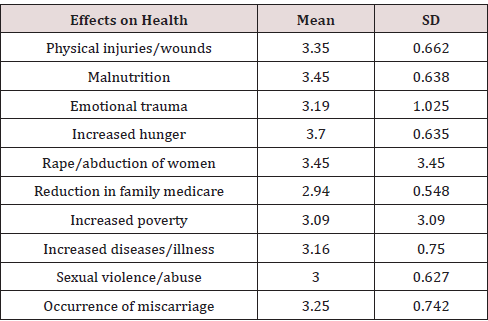
The health effects of land-related conflicts on women farmers were as follows: occurrence of miscarriages/bleeding (M=3.25), physical injuries/wounds (M=3.45), emotional traumas (M=3.19), increased hunger (M=3.70), rape/abduction of women (M=3.45), reduction in family medicare (M=2.94), increased poverty (M=3.09), increased diseases/illness (M=3.16), sexual violence/ abuse (M=3.00) and malnutrition (M=3.45). The narratives above are in line with the findings of Justino & Verwimp [23] in their studies when they concluded that armed violence conflict leads to severe injuries, spread of infectious disease, and increases in permanent physical disabilities mostly among women and children. This according to them may also result in large decreases in household welfare leading to poverty. Households may also have to draw on existing savings to pay for medical bills, which will pose severe financial burden on already vulnerable households (Table 4).

Table 4: Perceived effects of land –related conflicts on Health of Respondents,Field survey, 2016 Mean 2.50 and above were major effects.

Lupinepublishers-openaccess-Agriculture

Psychosocial effects

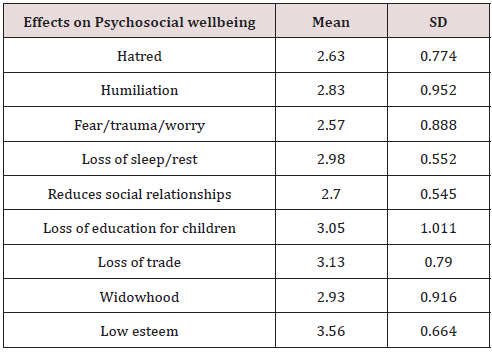
Land–related conflicts also have psychosocial effects on women farmers. The following psychosocial effects were identifiedhatred (M=2.63), humiliation (M=2.83), fear/traumas worry (M=2.57), loss of sleep/restlessness (M=2.98), reduction of social relationships (M=2.70), loss of education for children (M=3.05) loss of trade (M=5.13), widowhood (M=2.93) and low esteem (M=3.56). The findings of Fearon & Laitin [24]confirms this result when they noted that most conflicts lead to killing and displacing of populations, often limiting the access of households to employment and earnings and increasing levels of instability and loss of trust. In this case the women and children are disadvantage because of the conflict since they have to move from their place of abode to a new place in search security and jobs to earn a decent living. The result of this study is consistent with that of Akresh & de Walque [25] in their study which shows that the conflict had a negative effect on schooling outcomes of children, with exposed children completing half a year less the normal in their education. In the same vein, Shemyanika [26] study supported the findings when it was noted that conflict has negative effects on children education and presents evidence of the negative impact of armed conflict on schooling in the case of Tajikistan. Sany [27] findings also revealed that education services were also disrupted in conflict areas, where half of school-age children were deprived of education (Table 5) [28].

Table 5: Effects of land –related conflicts on Psychosocial Wellbeing of Respondent,Field survey, 2016, Mean=2.50 above are major effect.

Lupinepublishers-openaccess-Agriculture

Strategies to Cushion the Effects of Land-Related Conflicts

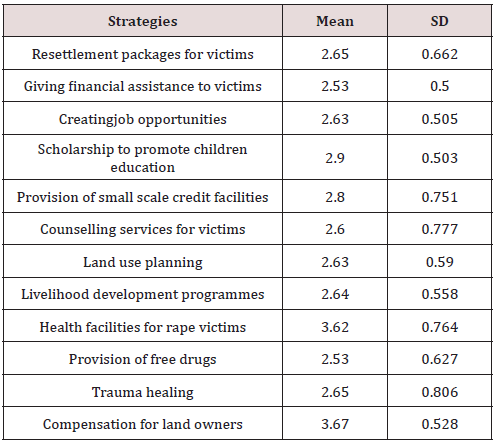
Table 6 showed that victims of violent land-related conflicts could be helped to manage their situations if certain provisions are put in place [29]. These provisions included resettlement packages for victims (M=2.65), giving financial assistance to victims (M=2.53), creating job opportunities (M=2.67), scholarship to promote children education (M=2.90), provision of small scale credit facilities (M=2.80), counselling services for victims (M=2.60), land use planning (M=2.63), livelihood development programmes (M=2.64), health facilities for rape victims (M=3.62), provision of free drugs (M=2.53), trauma healing (M=2.65) and compensation for land owners (M=3.67) [30,31].

Table 6: Strategies to cushion effects of land-related conflicts,Field survey, 2016 Mean=2.00 and above as major strategies.

Lupinepublishers-openaccess-Agriculture

Conclusion

The most predominant form of conflicts in the study area were communal conflicts, farmer/pastoralist conflicts and farmer/ farmer conflict with grave consequences for the women farmers. The major cause of conflict was use of resource–land, water, and grasses. These conflict leads to loss of human lives, agricultural produce, illness/health problems and many more. These conflict could be managed by use of strategies such as proper land use planning, and victims helped by provision of aids in various ways.

Read More Lupine Publishers Agriculture Journal Articles:

Wednesday, 16 September 2020

Lupine Pubishers | Dimethyl ether as Zero Emission Fuel-Synergies with Biogas and Biomass Plants

        Lupine Publishers | Current Investigations in Agriculture and Current Research


Introduction

In Iceland a methanol plant named in honour of the noble prize laureate [1] operating since 2011. As substrate they use carbon dioxide and hydrogen producing methanol. Methanol is the simplest alcohol and well know since the developments of Paul Sabatier and the catalysis processes [2], in liquid phase at environment pressure and temperature, and is a synthetic alcohol. In the Georg Olah Plant [3] carbon dioxide and hydrogen are mixed 1mol:3mol together to form a syngas, being compressed and transformed under the help of catalysts to methanol (methanol synthesis).

.

Lupinepublishers-openaccess-Agriculture

In most processes the methanol synthesis is running at a pressure range 30 bar up to 100bar and a temperature range 200 °C up to 400 °C. The conversion rate is given in the range of 25% up to 35% and therefor recycling of the unconverted gas in the methanol reactor back, to increase the conversion rate of synthetic gas and production rate. Leaving the methanol reactor, the product gas will be cooled down andthe condensate mixture of water and methanol is distilled and separated into water and product methanol. The methanol synthesis with carbon dioxide hydrogen is needed, generated by wet electrolysis.

Lupinepublishers-openaccess-Agriculture

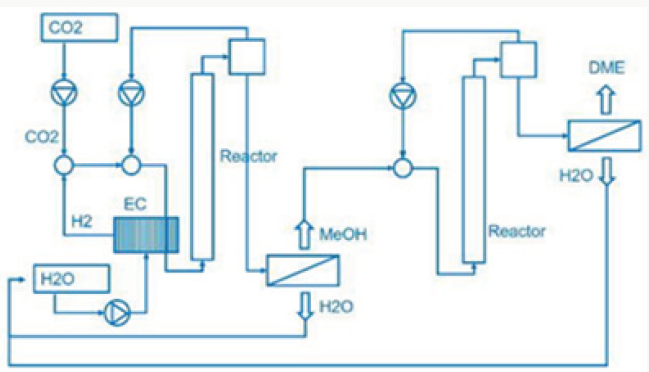
Figure 1: Methanol and Dimethyl ether from carbon dioxide and water.

Lupinepublishers-openaccess-Agriculture

From water and the electric power needed for the electrolysis is generated by geothermal heat conversion to electricity (Figure 1). This is a special property of Iceland. Now the question arises, where does the carbon dioxide come from? In the most common case. Carbon dioxide is separated from exhaust gas from fossil fuelled power plants and industrial processes. Using fossil carbon dioxide in plant process the George Olah plant [3] is now accelerating the consumption of fossil fuels if we use methanol as a fuel. Therefor methanol should be used in chemical industry fixing carbon dioxide [1]. But if we use methanol as fuel in transportation, the combustion of methanol leads to carbon dioxide and water being transferred to normally carbon dioxide transferred to the environment is a dilution of carbon dioxide in the air. We watch that methanol burned in a classical Otto motor cycle additional produces compared to fossil diesel fuel in a diesel engine higher pollution, dust, soot and a higher amount of carbon dioxide in the exhaust gas. Therefor methanol is converted to dimethyl ether by extraction of water under acid conditions [4,5].

Lupinepublishers-openaccess-Agriculture

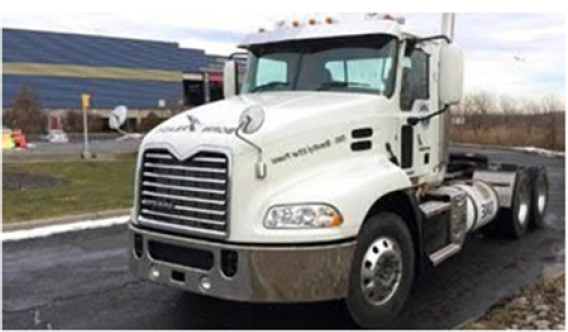
Dimethyl ether is often mentioned as the ideal Diesel fuel [8], tested over long years from VOLVO [6] and by MACK TRUCK [7] in heavy trucks on the road. Dimethyl ether is the simplest ether a synthetic fuel, certificated by the ISO 16 681:2013 by the IDA, produced from methanol or by direct synthesis (Figure 2).

Lupinepublishers-openaccess-Agriculture

Figure 2: Mack truck testing Dimethyl ether.

Lupinepublishers-openaccess-Agriculture

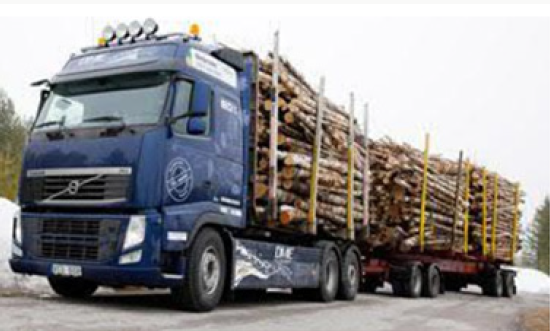
In most cases there is no application of methanol in transport, civil, agriculture and forestry, because they are running on fossil diesel. Heavy strong robust power machines are needed and the diesel engine is the ideal power machine. Methanol cannot substitute fossil diesel directly. But dimethyl ether has this needed property. As shown from MACK TRUCK (New York) [7] testing Dimethyl ether in heavy trucks [7]. Since VOLVO (Sweden) [6] started in using Dimethyl ether in heavy trucks in 2008, running over five years the trucks on the road (Figure 3), and moved then to the USA at MACK TRUCK [7], it is well known that dimethyl ether is a story of success and dimethyl ether is the ideal Diesel fuel [6,7].

Figure 3: VOLVO heavy truck running on Dimethyl ether.

Lupinepublishers-openaccess-Agriculture

Ethanol, Biodiesel

Using corn from agriculture bioethanol is produced with fermentation. Corn is a food product not agricultural waste. Bioethanol has the same combustion and emission problem as methanol: it can only be used in a gasoline engine and leads to higher pollution, lower efficiency, soot dust, and high carbon dioxide than dimethyl ether. In Europe biodiesel is mixed with fossil diesel. Biodiesel is produced from oil and fatties over catalytic esterification, but again biodiesel has the same combustion problem as methanol: although biodiesel can be used in diesel engines, biodiesel leads to higher pollution, lower efficiency, soot dust, and high carbon dioxide than dimethyl ether [6].

Biogas

The anaerobic fermentation process enables to produce biogas, consisting of methane and carbon dioxide (CH4, CO2). Biogas can be produced from wet biogenic waste. The anaerobic process can be realized in wet phases or in dry phases but always lead to biogas and digestate, which can be recycled again. In most application biogas is used to generate electricity and heat. The electric efficiency of biogas engines is 30% up to 36%, and we have an exhaust gas, therefore no zero emission.

Forestry biomass

In Forestry wood is used for pulp and paper and for wood in civil and industry. Generating heat from wood chips with a warm water boiler is well known. In the most application biomass is used to generate heat. The thermal efficiency is low 75% up to 85%, and we have an exhaust gas and again no zero emission.

Reforming and gasification for dimethyl ether

Dimethyl ether can be produced from biogas and biomass. Biomass as waste biogenic mass can be used for gasification to generate synthetic gas and char coal. The char coal is carbon, the synthetic gas consists of CO:23%, H2:20%, CH:1%, O2 <0.1%, CxHy: 3%, Rest CO2. The heat caloric value is about 1.5kWh/m³. Charcoal can be reused again and converted to syngas over the known water gas reaction

Lupinepublishers-openaccess-Agriculture

Biogas can be used to generate synthetic gas with dry reforming:

Lupinepublishers-openaccess-Agriculture

The synthetic gas consists of CO:40%, H2:40%, CH:3%, O2< 0.1%, CxHy: 1%, Rest CO2. The heat caloric value is about 2.5kWh/ m³. In both cases syngas can be transformed to dimethyl ether over direct synthesis: 3CO + 3H2CH3OCH3 + CO2 + Q (- 254kJ/mol).

Hydrogen

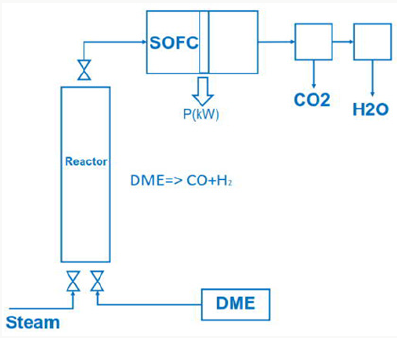
Figure 4: Dimethyl ether and SOFC Cycle.

Lupinepublishers-openaccess-Agriculture

Cheap hydrogen is the basic requirement for the production of cheap and competitive dimethyl ether from methanol (Figure 4). Hydrogen from electrolysis costs electric power ~5.0 kWh/m³ H2. Hydrogen generated from waste heat, enables to split water into hydrogen and oxygen with metals at temperatures from 400 °C up to 800 °C:

Lupinepublishers-openaccess-Agriculture

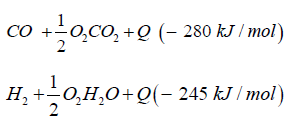
SOFC or thermionic and magneto hydrodynamic Generator Using dimethyl ether in a SOFC (solid oxide fuel cell) cell dimethyl ether has to be converted to syngas by steam reforming

Lupinepublishers-openaccess-Agriculture

The exhaust gas from the SOFC cell consists of carbon dioxide and steam.

Lupinepublishers-openaccess-Agriculture

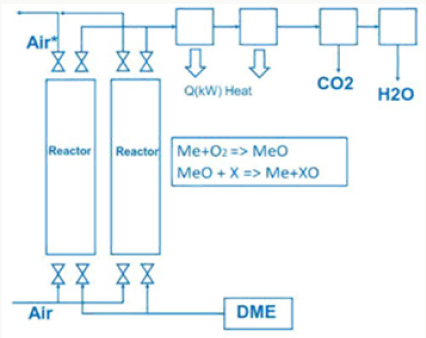
SOFC cells operate in a temperature range 800 °C up to 1000 °C, at nearly environment pressure and have an electric efficiency of 50% up to 60%. Another possibility is to generate heat with combustion of dimethyl ether in a metal oxide reactor.

Lupinepublishers-openaccess-Agriculture

The generated heat can be direct converted to electric energy with a thermionic generator. Thermionic generators have an electric efficiency from 25% up to 35%, combined with magneto hydrodynamic generators having an electric efficiency from 30% up to 40%, we gain in sum from 55% up to 75% for the direct conversion of heat to electric energy (Figure 5). In both applications we oxidize dimethyl ether to carbon dioxide and water under pressure up to 50 bars.

Lupinepublishers-openaccess-Agriculture

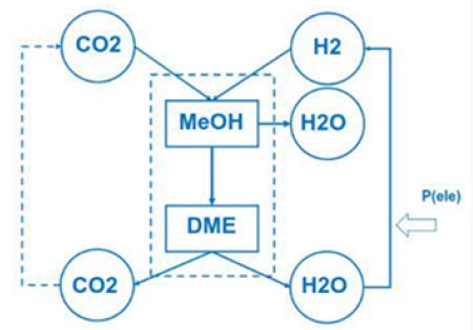
Do that the exhaust gas consisting of carbon dioxide and steam can be collected as condensate in different tanks. This enables carbon dioxide and water to be reused in such plants like the George Olah Plant [3] and Oberon plant [4] again. The step of collecting carbon dioxide and water is the closure of the methanol over the dimethyl ether processes. It is now a closed cycle collecting carbon dioxide in a tank wo be recycled to methanol and dimethyl ether process again. This closed cycle now reduces the emission of greenhouse gas like carbon dioxide and can be seen as a sustainable property of the carbon dioxide recycling. Carbon dioxide now is a substrate and a basic part in the fuel production and not a pollution in the exhaust gas anymore. Under this conditions carbon dioxide and the emission certificates connected to carbon dioxide can be used in a global trade [8].

Figure 5: Dimethyl ether and high temperature heat generation.

Lupinepublishers-openaccess-Agriculture

Closing the cycle

To reach zero emission we must convert Dimethyl ether into carbon dioxide and water. Carbon dioxide and water can be converted back (recycled) to dimethyl ether with electric energy and heat. Under this cycle we generate only this amount of carbon dioxide, connected with dimethyl ether. Using more dimethyl ether enables to reuse more carbon dioxide and the process is acting like a carbon dioxide sink. Focusing on this property of zero emission enables to save energy and substrate in agriculture and forestry, in civil and transportation (Figure 6). Using waste from agriculture and forestry, using biogenic waste from hotels, food industry and biogenic waste from municipal and civil waste, reduces the pressure on new and fresh biomass, reduces the pressure on fossil substrates. Under the property of zero emission the methanol cycle of the George Olah plant [3] will be renewable and also the dimethyl ether plants of Oberon [4,9].

Figure 6: Dimethyl ether closed cycle.

Lupinepublishers-openaccess-Agriculture

Read More Lupine Publishers Agriculture Journal Articles:

Tuesday, 15 September 2020

Lupine Publishers | Biogas and Dimethyl Ether are Providing Water, Fertilizer for an Intelligent Smart Soil

       Lupine Publishers | Current Investigations in Agriculture and Current Research


Short Communication

Biogas is well known in agriculture and food industry. In Austria we realized a project Hagenbrunn [1] nearby Vienna/ Austria, a biogas plant running on waste food and liquid biogenic waste. The electric power output is given with 1320kW ele, the thermal heat generation is given with 1800kW thermal heat realized with warm water (95 °C/60 °C), the substrate feed is given with 25, 000t/year, and the digestate coming out of the biogas plant is 35000t/year. The biogas generation of the different substrates, like waste food, grass, potatoes (e.g.) is done by measurements, testing and calculation and leads to the biogas generated by fermentation in a range of 700Nm³/h up to 800Nm³/h, with a methane concentration of 50% up to 65%. The biogas plant Hagenbrunn [1] has a deep influence on the way of irrigation, the way of fertilizing in agriculture and vine culture. The biogas plant Hagenbrunn [1] has a deep influence on the regional jobs, the regional companies, it is acting like a knot and center of competence and initiating a lot of spin offs. The main advantage of the biogas plant is using biogenic waste as input substrate and therefore the communities are glad to have a sink using and converting waste food and liquid biogenic waste to biogas. Biogas from the plant is only an intermediate step. In the first realization step biogas is converted to electricity and heat.

In the next realization step the biogas plant was enlarged with a preparation of the digestate, to distilled water, solid particles and fertilizer, and the gasification of biogenic solids and the conversion of syngas from gasification of the biogenic solids, biogas from the biogas plant, and the waste biogas from the closed digestate tank to generate syngas with steam gasification and producing dimethyl ether. Dimethyl ether is stored in two tanks, with a volume of 30,000liters, and a filling station of mobile movable bottles substituting LPG by Dimethyl ether. Heavy tank trucks are transporting Dimethyl ether to the clients. The production of dimethyl ether in Hagenbrunn [1] is given by 800L/h, using 10,000t/ year biogenic solids, 80,000m³/h waste gas (CH4=5%, CO2=95%) from the digestate tank of the Biogas plant, and 400m³/h biogas (CH4=50%,CO2=50%) from the biogas plant. Additional heat from the CHP engine is used for drying the solids biomass to a moisture lower than 10%. The electric power needed for the production of dimethyl ether, for the drying process, and the generation of fertilizer and water from digestate is produced by the gasification plant. Now the Biogas plant now can convert liquid biogenic waste and solid biogenic waste and can so take over the waste from the region.

.

Biogas plant

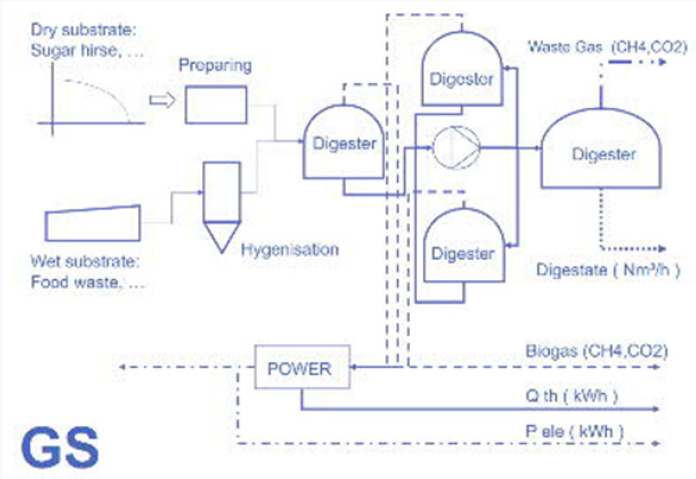
A biogas plant consists of substrate storage for at least a six months operation (Figure 1), buffering the different mass flow of substrate during the operation of a year. Additional we have a preparation of the substrates increasing the surface, and to prepare for the fermentation in the digester. Because of the wet process we have to mix the substrate with the fluid circulating in the plant between the digester by a pump (often called central pump). For the biogas process we have to understand biogas processes operating on waste, like food waste, manure, and substrates like corn, maize, beet. The process ends with a digester and the with a storage of the digestate (end product of the fermentation process). In input substrate is defined by the gas production of the fresh mass (measured, tested or calculated by formulas (Brick, Schumann)), the anaerobic fermentation process, and at the end to get back the digestate. The biogas resulting form the digester is collected and burned in a CHP engine to produce electricity and heat. But nobody needs electricity and heat, additional the earn of electricity and heat is very small, the economic situation becomes very bad. To get a feeling about the dimension, area, input, output, efficiency we have: electric power output: P=500kW ele, input feed: 17,500 t/year wet fresh substrate, output 15500 t/a digestate, generated heat Q(th)= 700kW th, generated biogas 300Nm³/h (50% CH4, 50% CO2), the agricultural area needed for supporting the biogas plant with waste is at least needed with 200 ha area. The area needed for the biogas plant itself is about 1 ha. With this correlation we plan and design the water consumption, water storage, fertilizer and soil needed. Additional the digestate resting in a tank is producing waste biogas (5% CH4, 95% CO2) with 40,000m³/year.

Figure 1: Biogas Plant.

Lupinepublishers-openaccess-Agriculture

Dimethyl ether

Dimethyl ether is well known. It is the simplest ether consisting of two carbon atoms, one oxygen atom and six hydrogen atom, molar mass MZ~ 46g/mol [2]. It is certificated by ISO 16 681: 2013 by the IDA. At a pressure of 6 bar Dimethyl ether is in liquid phase at an environment temperature of 25 °C [2] The simplest ether is synthetic and can produced with two pathways: the production in two steps in the first step over the intermediate product methanol (methanol synthesis) CO+ 2H2 ⟶ CH3OH+Q (-225 kJ/mol) and in the second step over dehydration (water removal) 2CH3OH ⟶CH3 OCH3 + H2O + Q (-15kJ/mol), or in the direct synthesis in one step 3CO+3H2⟶CH3OCH3+CO2+Q (-254 kJ/mol). The difference between both chemical processes is the energy (heat generated and needed) the resulting mass flows generated by the processes. The caloric heat value of dimethyl ether is given caloric combustion enthalpy Hc=1460kJ/mol [2], the formation standard formation enthalpy Hf =184 kJ/mol [2]. The combustion of dimethyl ether in diesel engines leads to nearly no soot, dust, a reduction of carbon monoxide and nitrogen oxide [3].

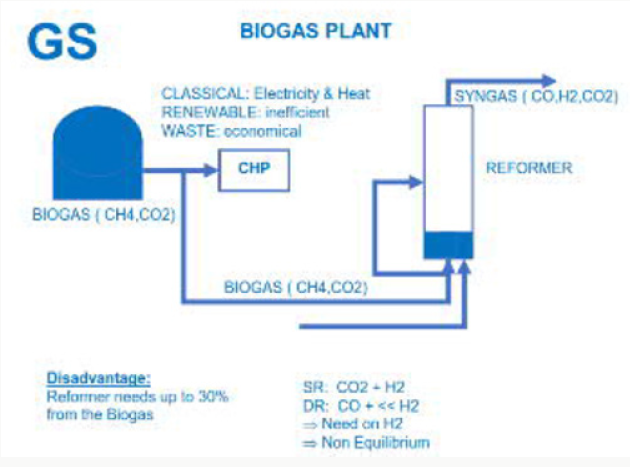
Figure 2: Biogas Plant and reformer for syngas.

Lupinepublishers-openaccess-Agriculture

Biogas to dimethyl ether

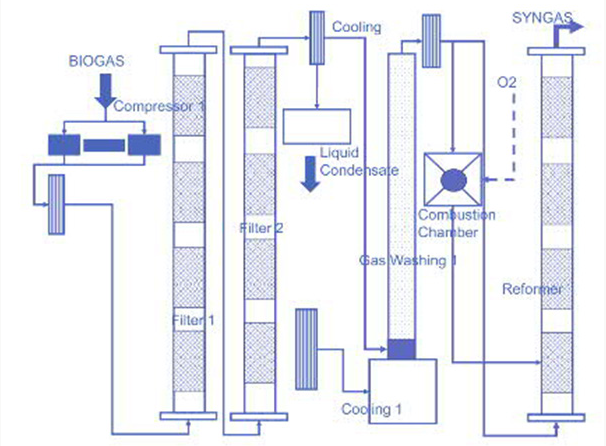
The convertion of biogas to dimethyl ether can be done in two pathways. One pathway is steam reforming of biogas, which leads to a snygas consisting of carbon monoxide and hydrogen and carbon dioxide (SR=steam reforming reaction) (Figure 2). CH4+H2 O⟶CO+3H2+Q (+316kJ/mol), or in combination with more steam (WGS = Water gas shift reaction) to carbon dioxide and hydrogen CH4+2H2O⟶CO2+4H2+Q (+ 161kJ/mol) (Figure 3). The second pathway is dry reforming of biogas to carbon monoxide and hydrogen CH4+CO2⟶2CO+2H2+Q (+251kJ/mol) [1]. In processes we need heat, generated from the biogas itself CH4+2O2⟶CO2+H2O+Q (-574kJ/mol). The gained syngas is then converted to dimethyl ether. The standard process of convertion of syngas to dimethyl ether consist of a gas compression up to 50 bar till to 100 bar, the reduction of carbon dioxide by cooling down the syngas and condensation of carbon dioxide and storing in a tank, the convertion of the syngas to methanol in one reactor, with recycling of the unconverted syngas and condensation of water and methanol mixture [1]. The condensate mixture is separated with distillation into process water and methanol. The methanol is dehydrated to dimethyl ether and the condensate mixture of dimethylether, water is separated with distillation into process water and dimethyl ether.2CH3OH ⟶ CH3OCH3+H2O+Q (-15 kJ/mol) [1].

Figure 3: Biogas Cleaning and syngas reformer.

Lupinepublishers-openaccess-Agriculture

Combination of processes

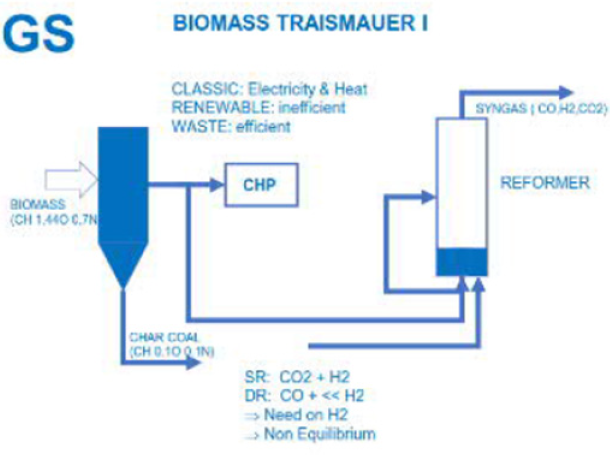
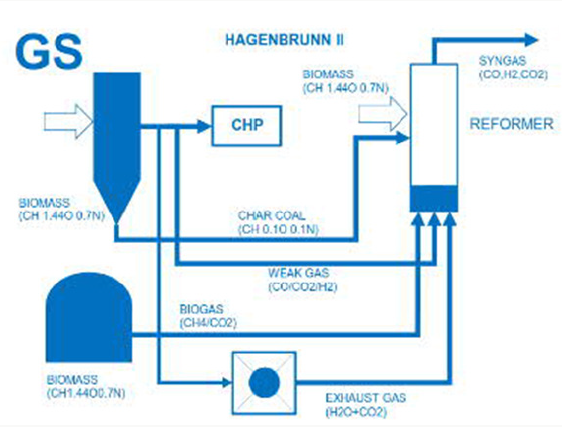
Figure 4 to increase the efficiency of a biogas plant the biogas plant is combined with a gasification plant. Such as gasification plant is realized in the project Traismauer in Austria [4]. The gasification plant converts solid biomass to weak gas mainly consisting of CO=20%, H2=23%, CH4=1%, CxHy=3%, Rest CO2, with a heat caloric value Hu~2.2kJ/m³, tar< 5mg/Nm³, dust < 5mg/Nm³ which is used to generate with a CHP engine (combined heat process) electricity and heat. Syngas from the gasification and char coal are converted with steam gasification to syngas with a steam reformer operating at nearly environment pressure and a temperature of 800 °C up to 1000 °C. The syngas composition is given by CO=30%, H2=30%, CH4=1%, CxHy=3% and the rest is CO2, with a heat caloric value Hu~2.8 kJ/m³. In the project Hagenbrunn [1] we combined the biogas plant with a gasification plant as done in the project Traismauer [2]. We call this gasification the bottom cycle producing weak gas with a caloric heat value Hu~2.2 kWh/ Nm³ (Figure 5). To generate the needed heat for steam (hv=2560kJ/ kg) and to superheat steam up to 800 °C till 1000 °C, we need a combustion chamber, in which the weak gas of the gasification plant is burned with oxygen to carbon dioxide and steam. Additional we use the biogas from the biogas plant in the steam gasifier and fine milled biomass mixed with char coal from the biomass gasifier. CH4+H2O⟶CO +3H2+Q (+206kJ/mol), C+H2O⟶CO+H2+Q (+145kJ/ mol). A very interesting property is given by using carbon dioxide in steam gasification C+CO2 ⟶2CO+Q (+180kJ/mol). The syngas has now a composition by CO=40%, H2=40%, CH4=1%, CxHy=3% and the rest is CO2 with a heat caloric value Hu~3.5kJ/m³, tar<0.5mg/ Nm³, dust<1mg/Nm³. This syngas is converted to dimethyl ether. From the CHP plant we generate the electric energy and heat needed in the enlarged biogas plant to run all processes.

Figure 4: Gasification plant and syngas reformer.+

Lupinepublishers-openaccess-Agriculture

Figure 5: Biogas Plant combined with a gasification plant and syngas reformer.

Lupinepublishers-openaccess-Agriculture

Intelligent smart soil

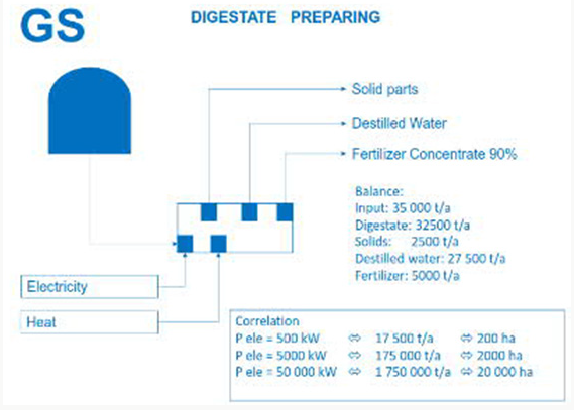
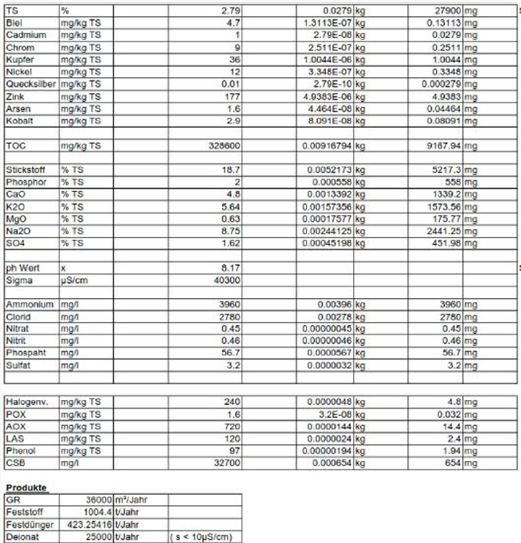
One of the main and central (Figure 6) parts of the project Hagenbrunn [1] is the conversion of the digestate into solids, water and fertilizer. The disadvantage for a classical Biogas plant, we need electric power and heat. In the project Hagenbrunn [1] we need P=150kW ele and Q=800kW thermal power for digestate 35,000 t/year. This is not efficient for a classical Biogas plant. Therefore we need additional heat and electric power and we need a high valued product like dimethyl ether to reach an energetic and financial efficiency to be worth for investment (Figure 7). First let have a look on the digestate from the Biogas Plant [1]. The digestate consist of metalöls like Cadmium, Chrome, Copper, Lead, Nickel, Mercury, Zinc, Arsenic, Cobalt, resulting from food itself. Under solid parts we understand organic particles and fibers coming out of the fermentation process, consisting of lignin, cellulose, hemi cellulose and poly sugars (called the TS=dry substance). Then we have the fertilizer parts like Ammonia, Phosphates, Calcium oxide, Potassium oxide, Magnesium oxide, Natrium oxide, Sulfates, Chlorides, Nitrates. The preparation process for the digestate is divided into two steps: the mechanical step, and the refining step of the liquid fertilizer.

Figure 6: Biogas Plant and up scaling digestate conversion.

Lupinepublishers-openaccess-Agriculture

Figure 7: Content of dig estate -Biogas Plant [3].

Lupinepublishers-openaccess-Agriculture

The first step is a mechanical separation of the solids out of the digestate. The digestate consists normally of 90% water, 3% up to 5% solid particles and 5% fertilizer solved in water. After the mechanical separation done with a sieve separator we use a fine sieve again to prepare the liquid digestate for filtration by membranes. The solid water mixture is like slurry is recycled in a water plant. The filtration process is closed with a membrane process, the ultra filtration stage (d~1μm) to clear and separate the collides from the digestate. Now we have reached a clear liquid fluid with solved minerals, oxides, carbonates, phosphates and sulfates. This is the first stage of usable for droplet irrigation. The advantage for this first stage: it is easy to reach, the electric power needed is P~50kW/Nm³ is very small. The disadvantage is we cannot influence the concentration of the solved minerals, oxides, carbonates, phosphates and sulfates itself. The clarified digestate from the first stage can be easily used for droplet irrigation, which saves more than 50% of water consumption. The needed electricity and energy is gained from the gasification plant and from dimethyl ether, which can be used as fuel for the diesel engine driven pumps transporting the water in the pipe lines on site outside the Biogas plant. So we save energy, we save water consumption and we have the possibility of installation of doplet irrigation. Those parameters are very interesting for investors and communities and companies in agriculture and food and wine industry forced to save costs, water and fertilizer. There is no need of continuing the wasting water by inefficient water irrigation and also the costs for synthetic fertilizer can be reduced.

In the second step we take now the liquid fertilizer and separate the water. We use the Nano filtration (d~0.01μm) to reach a high concentration of the solved minerals, oxides, carbonates, phosphates and sulfates, stored in a tank. Now we are in the position to dilute the high concentrate with water according to the demands of the clients. In the project Hagenbrunn [1] we also developed a step further. We are in close contact with the client and measure the moisture of the soil; we measure minerals, oxides, carbonates, phosphates and sulfates in the soil [3]. Although the biogenic plants, like a vine culture, are intelligent by it and can organize and influence the microbes by chemical substances in the soil, we now can support the plant culture with water, minerals, oxides, carbonates, phosphates and sulfates according to the measurements and the need. What do we understand under need: we measure the quality of the grapes, corn, fruits in the different growing state itself, depending on the temperatures, solar environment, and with this data we are now in the position to close the controlling cycle: the measurement of the actual state of the culture pant, the quality to be reached and the need on water, minerals, fertilizer. This all is realized in a digital process system and visualization for steady local watching and controlling. The realization of this project enables us to get a deep inside look into the structure and behavior of the soil and the growth of the plant and enables us to optimize and to increase the growth efficiency.

Closure

In the project Hagenbrunn [1] we have shown that a Biogas plant can be enlarged with a gasification [4] to generate electricity and heat, to support the production of dimethyl ether [5] and to prepare and separate the digestate from the Biogas Plant into distilled water and fertilizer [1]. Under these conditions dimethyl ether becomes a smart rural fuel with an impact on transportation, on water supply and consumption in agriculture and food industry and in the consumption of fertilizers. Additional the Biogas Plant is now converting to a center of competence influencing the regional companies and jobs and as a hot spot it is a part of a network. If we now spread of a region Biogas plants with a power of 5MW we cover up an agricultural area of 2000 ha up to 3000 ha. With Biogas Plants in the power range of 5MW up to 50 MW we can cover up a region of 2,000,000 ha agricultural area. With this network of Biogas Plant as hot spots in the region we can lower the water consumption, we can dramatically increase the production of dimethyl ether as a fossil Diesel substitute and we can reduce the synthetic fertilizer consumption. Additional we increase the jobs in the region and we supply. Biogas Plants costs investment, but the financial investment for private investors is much smaller than the investment of a congress or community in water pipe lines. Over a period of 15 years we develop the region sustainable and as an add on we save the environment. But this is not important for an investor looking for a low risk investment, and for opportunities in future. But the network of Biogas plant is not working against itself; the Biogas Plants are supporting the network, are supporting each other and therefore are stabilizing the infrastructure and environment [6-11].

Read More Lupine Publishers Agriculture Journal Articles: