Showing posts with label Agricultural Engineering Journal. Show all posts

Tuesday, 26 January 2021

Lupine Publishers| Impact of Some Fertilization Treatments on Crop and It’s Atrebuites on “Fuerte” Avocado Trees

  Lupine Publishers | Current Investigations in Agriculture and Current Research


Abstract

This study was carried out throughout two successive seasons 2015 and 2016 at Horticulture Research Station at El-Kanater El-Khayria, Qalyubeia Governorate on 20-year-old avocado trees (Persea americana Mill.) “Fuerte” cultivar grafted on Dayouk rootstock and irrigated with through farrow (surface) irrigation system. In this sequence (N1) as the control or untreated trees and other trees were treated with four treatments of different addition times of nitrogen soil fertilization (N2, N3, N4 and N5) all only once and once with boron and zinc as foliar spraying in concentrations (1, 2 and 3 g/L) beside combination between them. Nitrogen fertilization rated 1200g /tree in 3 times as (NH4No3) 33. 5%. Boron was used as sulaphate boron (17, 5%) and zinc was used as sulphate zinc (34%) each treatment was sprayed independently or in combination three times during (October, January, April). Pollen germination, fruit set as well as yield, fruit weight, flesh weight, oil content percentage and vitamin C were determined to assess the effect of the treatments. The obtained results showed that nitrogen soil application time and boron and zinc foliar spraying were significantly affected on improving all the tested parameters compared with control trees. The study also showed that, nitrogen soil application time N2 with boron and zinc combination at 1g/L/tree was more effective than the other treatments and gave significantly the highest values in comparison of other testes treatments in both seasons of study.

Keywords: Avocado; Fuerte; Nitrogen; Boron; Zinc, Foliar spraying; Application time; Fruit set; Fruit quality and oil content

Introduction

The avocado Persea Americana, Mill belongs to the family Lauraceae. It has developed into three horticultural races (West Indian, Guatemalan and Mexican [1], which are adaptable to a wide range of soil and climatic conditions. Avocado which has been referred to as the most nutritious of all fruits [2], has gained worldwide recognition and significant volume in international trade. Although relatively new in international commerce, this unique fruit has been appreciated and utilized for at least 9000 years in and near its center of origin in Meso-America [3]. Avocado is a relatively new crop in areas of the world outside its native range in the American tropics. In 2013, world production of avocados was 4.7 million tons, with Mexico alone accounting for 32% (1.47 million tons) of the total production. Other major producers include Dominican Republic, Colombia, Peru and Indonesia, together totaling 1.26 million tons or 28% of world production (FAOSTAT of the United Nations 2013). “Fuerte” is one of the most common avocado cultivars in the international market. “Fuerte” accounts for about 55% of the production in Mexico and California and is important in other countries [4] and [5]. In Egypt, the avocado was grown in limited areas in El-Delta, in 50s and 60s of the previous centuries. Only Fuertre and Dayouk were grown in these areas until recent were new areas as El-Nubaria, Ismailia and El-Khatatba started to be grown with avocado.

“Fuerte” the most spread cultivar is a Mexican _ Guatemalan hybrid, Trees are large, with spreading crowns; leaves have aniseed smell when crushed, red flecking on wood of new shoots; flower Group B, fruit pyriform with distinct neck but variable ranging from elongated with long narrow neck to dumpy with short broad neck, medium to large size weighing 170–500 g, skin thin, green, medium gloss, supple leathery texture, pimpled surface, seed size is Medium to large, conical with pointed apex, early maturing with pale yellow flesh, 75–77% recovery, excellent quality with flavoursome, nutty after-taste, good on-tree storage, but short shelf-life when ripe. The chemical composition of avocado depends on the cultivar and stage of ripening [6]. In Egypt, “Fuerte” is harvested all year round but its’ main season is from October to December. Main problems facing avocado plantations are slow to reach production, low yields in cooler climates with a marked tendency for erratic cropping and sensitivity to low temperatures during flowering and fruit set [7].

Nitrogen seems to be the most important element in avocado nutrition. Deficiencies of nitrogen in avocado result in small, pale leaves, early leaf drop, and smaller and fewer fruits [8]. In addition, nitrogen deficient trees were found to be more susceptible to frost damage [9]. Boron is essential for pollen germination, for successful growth of the pollen tube through the stigma, style and ovary to the ovule [10]. On worldwide basis zinc (Zn) is a very critical microelement because the avocado is very susceptible to their deficiency. Symptoms of Zn deficiency are observed in acid soils from which it is easily leached at a low pH and in calcareous soils in which it is fixed in unavailable forms. Early deficiency symptoms are mottled, narrow, disproportionately small leaves at the terminals, usually light green or chlorotic in color. Leaf margins are necrotic, and internodes are shortened in advanced cases [11].

Numerous fertilization regimes were proposed by several scientists to overcome cropping problems [12] studied the effect of nitrogen fertilizer application times and rates on “Hass” avocado to increase total yield without reducing fruit size and found that application time proved to be an important determinant of total yield lower annual N would reduce fertilizer expense and protect the environment. Boron sprays applied either during fall or spring on trees not deficient in boron (based on leaf analyses) have been effective in increasing fruit set in a number of deciduous tree fruit, nut crops and in avocado [13]. [14] on avocado trees proved that B and Zn were significantly improved pollen germination; fruit set number as well as yield per tree and increased fruit weight, length and breadth of fruits. They showed that the combination of B+Zn had positive synergistic effect and gave the highest values in the tested parameters. According to [15] Zn level at (0.5 %) improved fruit set wheras levels (0.25, 0.5 %) were more effective on fruit drop number and enhanced production of piryform fruits with more elongation. The scope of the present study was to illustrate the impact of nitrogen fertilization regimes with or without foliar sprays of both zinc and boron on the performance of Fuerte avocado trees.

Materials and Methods

This investigation was carried out through the two successive seasons of 2015 and 2016 on 20-year-old avocado trees (Persea Americana, Mill.) “Fuerte” cultivar grown in the experimental orchard of the Horticulture Research Station located in El-Qanater El-Khayreia, Qalubia Governorate, Egypt. Trees were planted at 7x7 meters (86 trees/ feddan (. One hundred and fifty Feurte cultivar trees grafted on Dayouk rootstock were chosen for this study. The chosen trees for the investigation were uniform in their vigor, size, shape and disease free, grown on loamy clay soil and irrigated with a farrow (surface) irrigation system. Trees were subjected to normal cultural practices recommended by the Ministry of Agriculture except for the treatments of this investigation. Experimental design followed the complete randomized block design. The following regimes were conducted each on three separate trees (each acting as a replicate).

Considered fertilization regimes

Nitrogen fertilization regimes: All trees used in this investigation were fertilized by broadcast with 1200 gm N as the recommendation of ministry of Agriculture (the fertilizer ammonium sulfate 20% N was used). Five regimes were considered based on percentage and time of application. The considered regimes were:

N1: Control as farm’s regime. Fertilizer was split into 3 doses i.e. November 400 g/tree (33.3%), 400 g/tree (33.3%) in January and 400 g/tree (33.3%) in May.

N2: Fertilizer was split into 3 doses 240g/tree (20%) in (January), 600 g/tree (50%) in (May) and 360 g/tree (30%) in (August).

N3: 600 g/tree (50%) in (January), 360 g/tree (30%) in (May) and 240 g/tree (20%) in (August).

N4: 600 g/tree (50%) in (January) and 600 g/tree (50%) in (May).

N5: 600 g/tree (50%) in (May) and 600 g/ tree (50%) in (August).

Boron and zinc regimes

B: boron the product boron sulphate (17. 5% B) was used in three concentrations (1, 2, 3 g/L) / tree i.e. (175, 350, 525 ppm) respectively as B1, B2 and B3.

Zn: zinc the product zinc sulphate (34.5% Zn) was used in the same concentrations (1, 2, 3 g/L) / tree (345, 690, 1035 ppm) respectively as Zn1, Zn2 and Zn3.

B+Zn: combination between them as (B1+Zn1, B2+Zn2 and B3+Zn3) in (1, 2, 3 g/L) / tree.

Treatments were sprayed with a mechanical sprayer until runoff each for three times, the first at the beginning of flower bud induction in (October), the second spray was at bud burst during (January) and the last and third one was at anthesis in (April). Fifty treatments were performed each on 3 separate trees as follows: N1, N1+B1, N1+B2, N1+B3, N1+Zn1, N1+Zn2, N1+Zn3, N1+B1+ Zn1, N1+B2+ Zn2 and N1+B3+ Zn3 and the same way with the treatments N2, N3, N4 and N5.

The following parameters were assessed to evaluate the comparative effects of the conducted treatments.

a) Pollen grains germination percentage

Five inflorescences were chosen randomly on each of the considered trees to assess comparative effects of conducted treatments on this parameter and the fruiting parameters. Pollen germination (%), Pollen grains were collected during anthesis stage. Flower in the male stage of the reproductive cycle were collected in paper bags then transferred to the laboratory. After anther dehiscence when pollen shed they were collected and incubated in Petri dishes on a medium containing 15% sucrose and 0.8% agar according to [16]. Pollen germination was recorded after 6 hours as the percentage of germinated pollen in a total of 500 grains from different areas of plat. Each pollen sample was replicated three times. Pollen was considered to have germinated if pollen tube length was at least twice as long as the diameters of grain, samples were observed by Optical microscope.

b) Yielding Parameters

In both seasons, fruit set was determined by marking five flowering branch ends around the circumference of each treated trees two weeks after full bloom and fruit set percentage was calculated. On the last week of August just at harvest time the number of fruit/ branches was counted to estimate the final fruit set (number of fruits per branch/number of initial flowers *100). At harvest, fruits of each tree were picked, counted and weighed with a digital balance in Kgs. The yield (Kg) was determined as total number of fruit / tree *Average fruit weight (gm)/1000).

c) Fruit quality Parameters

Mature Fuerte fruits were harvested at the 3rd week of September maturity according to [17]. Samples of five representing fruits from each considered tree are harvested, cleaned packed in carton boxes in one layer and transferred to laboratory then both of physical and chemical parameters were assessed.

i. Physical Parameters

The following parameters were determined: fruit weight (g) and flesh weight (g) by using a digital balance.

ii. Chemical Parameters

Free fatty acids were determined by comparison of retention time of the gas chromatographic peaks with these of commercial free fatty acid methyl ester standards, then automatically computed as a percentage by the data processor (Chrom card) from the ratio of individual peak area to the total peaks area of fatty acids. Vitamin C as mg ascorbic acid/100 gm fruit weight was determined and estimated/ 100 ml fruit juice, according to [18].

d) Statistical design and data analysis

Experimental design followed the complete randomized block design. The obtained data was subjected to factorial analysis according to [19]. Attained means were compared by using New LSD method at 5%.

Results and Discussion

Fruit set parameters

Table 1: Effect of nitrogen soil application time, boron and zinc foliar spraying on pollen germination percentage per tree.

Lupinepublishers-openaccess-Agriculture

Pollen grains germination (%): Data presented in Table 1 showed that pollen germination percentage significantly varied with adopt treatments. With respect to nitrogen regimes, on the average the highest significant percentage attained was dedicated to (N2) treatment amounting to (77.36 &77.74 %) for both seasons respectively whereas, the significantly the lowest percentage was due to (N1) treatment (control) amounting to (59.04 & 59.23 %) for both seasons respectively. With respect to the foliar spray treatments on the average the applied treatments increased this parameter in the first season significantly compared with control except for (B3, Zn3 & B3+Zn3) treatments whose effects were statistically equal to control. In the second season however, treatments (B1, Zn2, Zn3 & B3+Zn3) did not induce any significant effect compared with control. The other treatments resulted in significantly higher percentages. Highest significant germination percentage was attributed to (B1+Zn1) treatment in both seasons amounting to (76.59 & 77.55 %) in both seasons respectively.

Interaction between the two main factors was significant. The highest values of pollen germination percentage (84.33 & 86.13 %) and (84.50 & 84.17 %) in both of seasons respectively were dedicated to (N2+ B1+ Zn1) and (N3+ B1+ Zn1). While the lowest percentage (553.57 & 55.27%) were due to (N1) and (N1+B3) treatments respectively in the first season. While in the 2nd season they were (53.27 & 54.63%) for both with (N1+Zn3) and (N1+B3) respectively. The obtained results are in line with the finding of [20] who proved that effect of combination of these nutrients positively affected pollen germination. [21] reported that boron plays an important role in pollen germination and pollen tube growth.

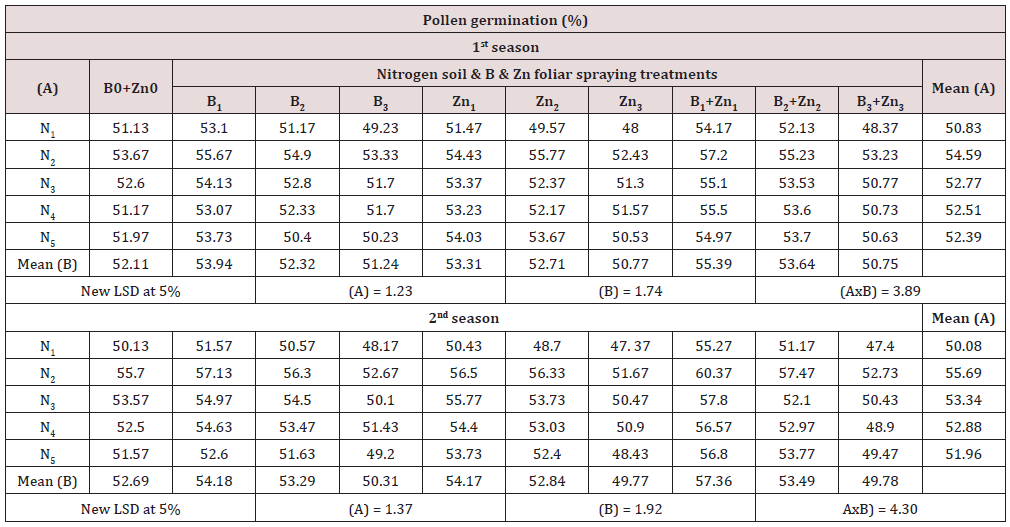
Fruit set (%): Table 2 showed that the on the average the applied nitrogen regimes in the both seasons were more effective significantly than control with (N1) which resulted in the lowest percentages (50.183 & 50.08 %) respectively whereas, (N2) treatment recorded the highest significant percentage (54.59 & 55.69 %) for both seasons respectively. With respect to foliar treatments, on the average their effects varied. Highest significant percentage in both seasons were attributed to B1Zn1 in both seasons amounting to 55.39 & 57.36 respectively and B1 treatment in the first season (53.94%) while (B3+Zn3) and (Zn3) recorded the lowest values (50.75 & 49.87 %) and (49.87 & 49.77 %) for both seasons respectively.

Table 2: Effect of nitrogen soil application time, boron and zinc foliar spraying on fruit set percentage per tree.
Lupinepublishers-openaccess-Agriculture

Furthermore, interaction between nitrogen soil application regimes and boron and zinc foliar spraying application during both seasons was significant. Data showed that the combined (N2+B1+Zn1) induced the highest fruit set percentage amounting to (57.2 & 60.37 %) in both seasons respectively. These findings are in agreement with [22] who found that increase in fruit set due to boron might be attributed to its role in maintaining high pollen viability and germination. also, it seems that the improvement in fruit set percentage could be explained as a result of increase pollen tube elongation due to boron treatments [23]. [24] on date palm found that (N, P, K and Zn) spray application can improve fruit set, yield and fruit size without thinning. In addition, zinc is involved in protein synthesis, influence on electron transfer reaction including those in the Kreb’s cycle and subsequently on energy production in the plant and also directly involved in the synthesis of indole acetic acid [11].

Yield (Kg)/tree: It is obvious from data in Table 3 that in both seasons of study on the average yield significantly varied in response to nitrogen soil application regimes. The highest significant yield (106.60 & 107.33 kg) in both seasons respectively was attributed to (N2), while significantly the lowest yield (74.49 & 75.42 kg) was obtained from (N1) treatment as control in both of seasons. On the other hand, yield of avocado varied on the average due to foliar treatments. Supreme crop was attributed to the (B1+Zn1) treatment in both seasons (102.66 & 104.59 kg). Whereas both (Zn3) and (B3+Zn3) resulted in statistically the least crop in both seasons amounting to (87.82 & 89.01 kg) and (82.58 & 84.71 kg) respectively.

Table 3: Effect of nitrogen soil application time, boron and zinc foliar spraying on fruit weight (g) /tree.

Lupinepublishers-openaccess-Agriculture

Interaction between the studied factors was statistically significant which referred to that nitrogen soil application and boron, zinc foliar spraying act dependently in this concern. The highest yield (113.9 & 116.1 kg) was attributed to from (N2+B1+Zn1) treatment in both seasons respectively, while the lowest yield (69.2 & 64.4 kg) and (68.1 & 65.7 kg) were obtained from (N1+B3+ Zn3) and (Zn3 treated in both seasons, respectively. Enhancements in crop due to the afore mentioned treatments are basically due to their effects on increasing both the pollen grain germination percentage and fruit set percentage .The available reports concerning the effect of nitrogen application time, boron and zinc foliar spraying on avocado yield are in agreement with the results of [14] on avocado and [15] on guava, they found that foliar sprays either boron or zinc increased tree yield.

Physical fruit parameters

Table 4: Effect of nitrogen soil application time, boron and zinc foliar spraying on flesh weight (g)/tree.
Lupinepublishers-openaccess-Agriculture

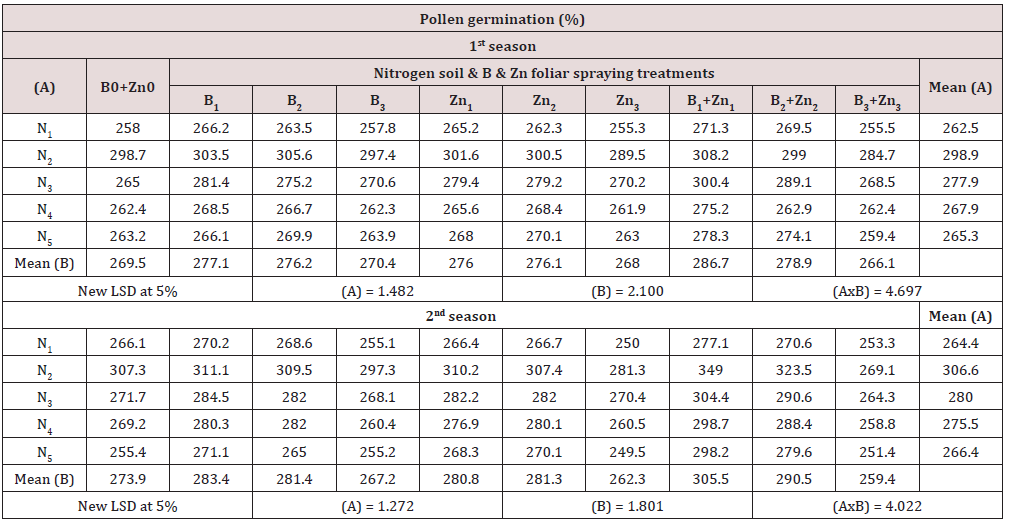
Fruit weight (g): Table 4 indicated that in both of seasons on the average all considered N regimes significantly increased the average fruit weight than control. Highest significant effect was due to (N2) treatment (298.9 & 306.6 g). While, (N1) control showed the lowest values (262.5 & 264.4 g) for both seasons respectively. With regards to boron and zinc foliar spraying treatments on the average, (B1+Zn1) induced the highest significant fruit weight in both seasons (286.7 & 305.5 g) respectively. While both (Zn3) and (B3+Zn3) treatments showed statistically the lowest values (268.0 & 266.1 g) and (262.3 & 259.4 g) respectively. On other hand, interaction between nitrogen soil application and foliar spraying of boron and zinc was significant. Data cleared that fruit weight also attained significantly the highest magnitude due to. (N2+B1+Zn1) treatment resulted (308.2 & 349.0 g) respectively in both tested seasons. Whereas control (N1) in both seasons with (Zn3) and (B3+Zn3) treatments induced the least fruit weight (255.3 & 250.0 g) and (255.5 & 253.3 g). These results are in general concurrence with [25] and [26,27].

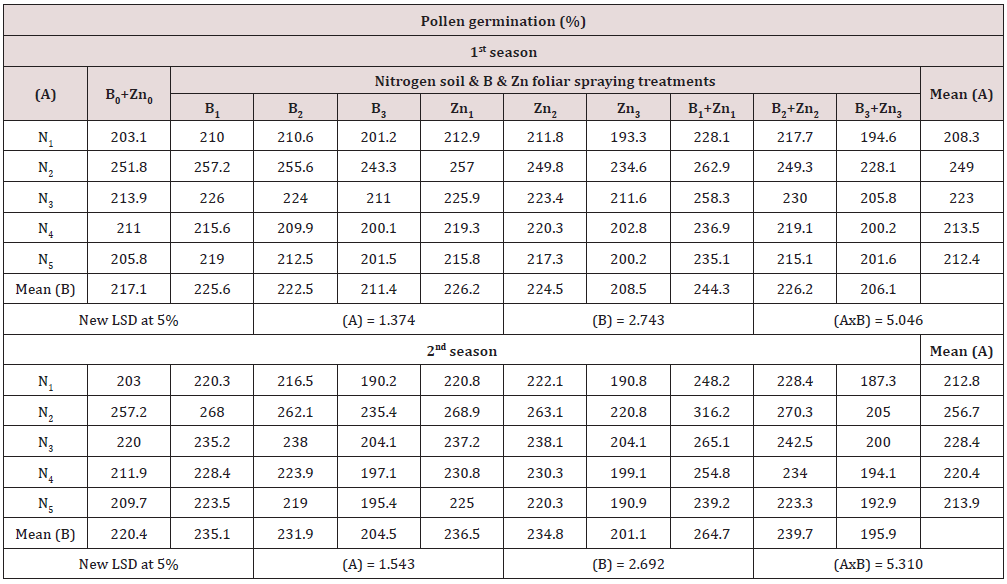
Flesh weight (g): Data in Table 5 showed that flesh weight was significantly affected by applied nitrogen regimes on the average. Significantly the heaviest flesh weight was attributed to (N2) treatment (249.0 & 256.7 g). Whereas, control in both seasons and (N5) treatment in the second one showed the lowest flesh weighted. Concerning boron and zinc foliar spraying treatments, on the average significantly the heaviest flesh weight recorded was (244.3 & 264.7 g) was due to (B1+Zn1). Whereas, (B3+Zn3) in both seasons (206.1 & 195.9 g) and (Zn3) (208.5 g) in the first season showed significantly the lowest values. Interaction between the two main factors was significant. The highest magnitude of flesh weight in both of seasons was dedicated to (N2+ B1+Zn1). The obtained results are in line with the finding of (Kumar and Verma 2004) on lichi.

Table 5: Effect of nitrogen soil application time, boron and zinc foliar spraying on flesh weight (g)/tree.
Lupinepublishers-openaccess-Agriculture

Chemical fruit characters

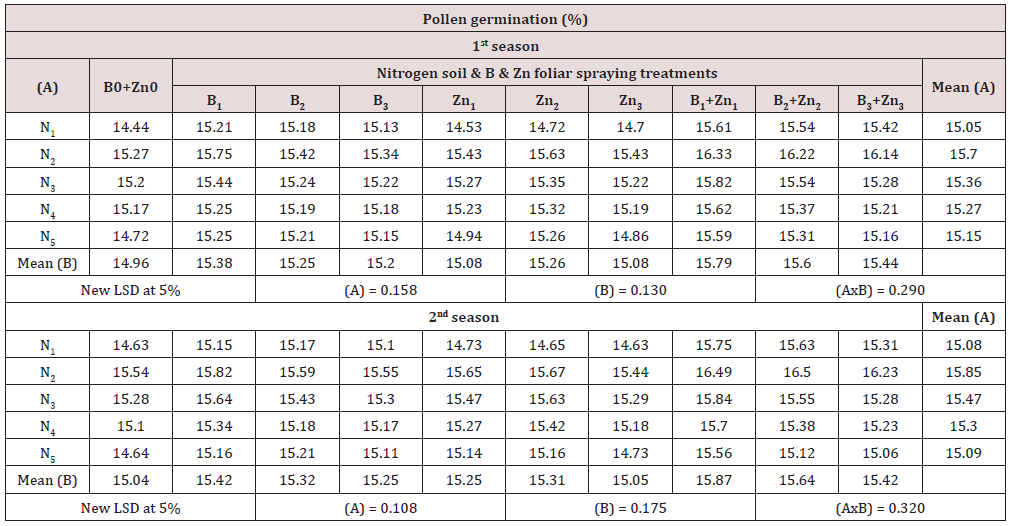
Oil content (%): Oil content as affected by conducted treatments is presented in Table 6. Data showed that on the average (N2) treatment resulted in the highest significant oil content (15.70 & 15.85 %) for both considered seasons respectively. On the contrary showed (N1) induced significantly the lowest content amounting to (15.05 & 15.08 %) for both seasons respectively with insignificant differences from (N5). As for average effect of foliar treatments, (B1+N1) treatment showed the highest significant oil content amounting to (15.79 & 15.87 %) for both seasons respectively. Whereas, unsprayed trees bore fruits with significantly the lowest oil content (14.96 & 15.04 %) for both considered seasons respectively). Differences from (Zn3) treatment were insignificant. Interaction data were significant. Data showed that highest oil content was attributed to (N2+B1+Zn1) and (N2+ B2+Zn2) treatments with insignificant differences between them. While the lowest content was attributed to N1& no spray treatment in both seasons. These results are in no agreement with those of [15] who illustrated that there was no significant different were observed in fat percentage, however this result in the line with agree with [28] and [29].

Table 6: Effect of nitrogen soil application time, boron and zinc foliar spraying on oil content percentage.
Lupinepublishers-openaccess-Agriculture

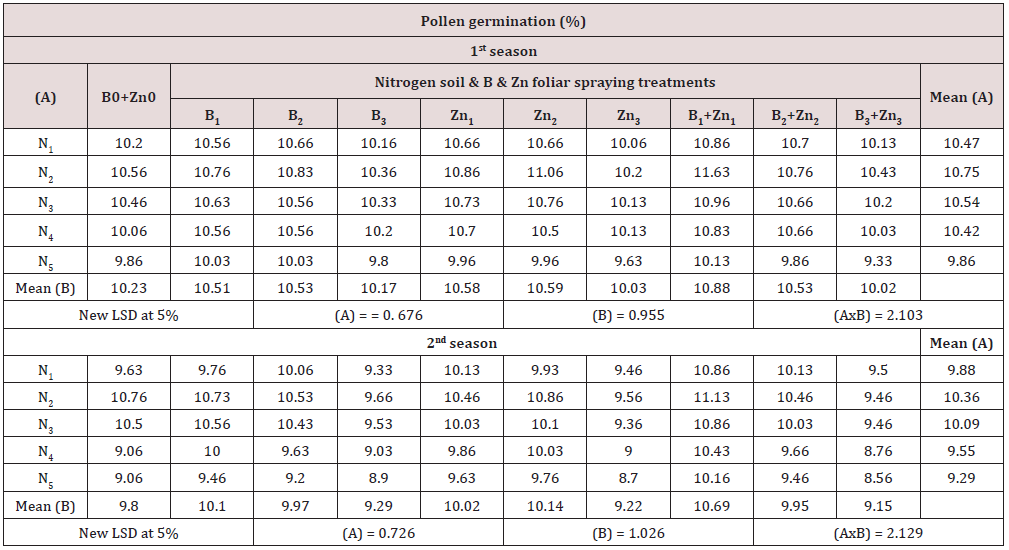
Vitamin C (mg/100g): It’s obvious from Table 7 that (N2) recorded the highest fruit vitamin C content in both of seasons (10.75 & 10.36 mg/100g). Whereas, (N5) treatment showed the lowest magnitudes. As for the average effects of spraying treatment, as (B1+Zn1) was the most effective treatment in this respect in vitamin C with values (10.88 & 10.69 %) respectively compared with the combination of boron and zinc at 3 g/L treatment. The combination of boron and zinc at 1g/L and nitrogen application time treatment (N2) as (N2+B1+Zn1) increased vitamin C fruit content (mg/100g) in both seasons (11.63 & 11.13), while the treatment (N5) with boron and zinc combination in concentration 3g/L as (N5+B3+Zn3) showed the lower values in both seasons with (9.33 and 8.56) respectively. [30] reported that B and Zn sprays enhanced ascorbic acid content in guava.

Table 7: Effect of nitrogen soil application time, boron and zinc foliar spraying on vitamin C (mg/100g).
Lupinepublishers-openaccess-Agriculture

In Conclusion the Present Study Clearly

Illustrate that nitrogen fertilization regimes clearly affect the cropping and its’ attributes in avocados. also, for foliar application of boron and zinc in combination, it showed clear enhancements in terms of increasing pollen grains germination percentage leading to increasing the crop. Also, their application showed enhancements in crop physical and chemical characteristics [31-33].

As a Recommendation

It is preferable to fertilize avocado trees cv. Feurte with nitrogen at 240g/tree during (January), 600g/tree during (May) and 360 g/ tree during (August) combined with 3 foliar application of boron and zinc at 1g/L at for three times, the first at the beginning of flower bud induction in (October), the second spray at bud burst during (January) and the last and third one was at anthesis in (April).


Read More Lupine Publishers Agriculture Journal Article:

Tuesday, 12 January 2021

Lupine Publishers | Integrated Pest Management for Rodent in Buildings

  Lupine Publishers | Current Investigations in Agriculture and Current Research

Abstract

The objectives of the study are to provide an integrated control program for rodents in buildings and to clarify the most important preventive methods that can be used in the control process and to make some important observations when the application of control methods such as mechanical control, biological and chemical to get the best anti-rodent program inside buildings.

Keywords: Integrated Control Program; Preventive Methods; Control Process; Anti Rodent

Introduction

Rats and mice can be a major pest problem in buildings. They damage food, books, documents, and clothing. Damage to a structure occurs when rats and mice gnaw on structural components, including wiring, wood, and plastics. The gnawing on wire insulation can result in electrical shorts and fires. Rodents have also been implicated in the spread of dangerous human diseases. In short, structural risks, health risks, and a general lowering of environmental quality accompany any rodent infestation. All rodents require food, shelter, and water. The shelter provides protection from predators, inclement weather, and a favorable place to bear and rear their young. Although rodents require water, those water requirements vary greatly by species. Because rodent food and cover (i.e., vegetation) can be influenced by human activities, there has been considerable development of strategies to reduce populations and damage by manipulating vegetation [1].

Follow the tips in the sections below and you will be one step closer to keeping your home permanently free of rats and mice (SRC)

Preventive Methods

The most important steps in controlling rodents are preventive methods because prevention is better than control. The following means:

a) Healthy buildings should be constructed to prevent the entry of mice and rats.

c) Repair / seal any cracks or holes small diameter or inch or larger in the foundation, walls.

d) Repair broken windows and doors - Make sure that the door seals are tight for any inhabited buildings.

e) Place the wire on all building windows.

f) All edible foods (lunch and snacks) will be stored in rodent-resistant containers and not in office drawers.

g) Cracked or unusual food will be cleaned and removed from the intake area at the end of each day.

h) Garbage containers are emptied in the dining areas daily or have narrow blankets.

i) There will be no garbage dumps in the uninhabited buildings.

j) The external garbage areas will remain clean and devoid of organic debris on the ground.

k) Remove rodent attractions such as food or shelter by ensuring that the food is stored safely and that the surrounding environment is clean.

l) Rinse food and beverage containers before disposing or recycling.

l) Rinse food and beverage containers before disposing or recycling.

n) Keep firewood away from the ground and away from structures as much as possible to mitigate shelter opportunities.

o) Fruit trees will be free of fruit that has fallen to the ground during summer and fall.

p) Birds, squirrels and other wildlife will not be fed within 200 feet of any building in the province.

q) Prevent the entry of animals into warehouses and houses.

r) Keep stove tops clean and free of food scraps.

s) Separate your home from paper, fabric, and any similar materials that attract rodents to nest.

4. Methods of Treatment

Mechanical Control

Using Traps

Using traps instead of rodent poisons gives you clear confirmation of a captured rodent and allows you to better gauge the effectiveness of treatment. You are also able to dispose of rodents immediately rather than dealing with the foul odor of rotting carcasses from poisoned rodents inside your walls or otherwise out of reach. Most important, using traps allows you to avoid rodenticides, which pose a greater threat of exposure to children, pets, and non-target wildlife, including natural predators (SRC).

Traps Description

i. Live Animal Trap: This is a catch and release system that avoids killing a rat or mouse. Some states prohibit releasing rodents into the wild. The Center for Disease Control (CDC) warns that captured rats or mice might urinate and increase risk of spreading disease. Muhammad Sarwar (2015)

ii. Snap Trap: This is the oldest type of trap and uses a springloaded bar to kill a rodent on contact. Some modern snap traps prevent risk to children and pets by enclosing the device in a plastic box.

iii. Multiple Catch Live Mouse Trap: This is a catch and release system that allows for capture of multiple mice.

iv. Glue Trap: Glue traps are not recommended because the adhesive plate that is used to capture rodents can also trap birds, baby animals, lizards, and even pets. These traps also cause undue suffering to rodents. The CDC warns that captured rats or mice might urinate and increase the risk of spreading disease. Enclosure boxes are plastic boxes that can fit a single snap trap, sometimes more, to provide an additional layer of protection for kids and pets. These boxes also hide the dead rodent, making for easier disposal of rodent, and can be re-used (SRC)

v. Electronic Trap: This battery-powered trap delivers an electric shock that kills rodents quickly. This is a newer type of trap, and models are available for both rats and mice.

vi. Important Notes:

a) Be sure to place traps in locations where children and pets cannot access them or place traps in safety enclosure boxes.

b) Place the trap sideways next to the walls.

c) Do not place the trap continuously.

d) Wash the trap after the fishing process.

e) Remove rodents by using traps be cautious with live traps as rodents might urinate which increases the risk of spreading disease.

f) Use gloves when disposing of dead rodents, nests, or any nesting material.

g) Spray the dead rodent or nesting material with a disinfectant solution and allow them to soak for 5 minutes before disposing rodent or materials in a secure plastic bag.

g) Spray the dead rodent or nesting material with a disinfectant solution and allow them to soak for 5 minutes before disposing rodent or materials in a secure plastic bag.

i) Place the plastic bag with rodent or nesting material into another plastic bag along with any wipes or rags that were used to sanitize the surrounding area.

i) Place the plastic bag with rodent or nesting material into another plastic bag along with any wipes or rags that were used to sanitize the surrounding area.

Destruction of Burrows

Pruning both for adult trees or foliage with disposal of pruning products so as not to be a cache of mice to form a nest on these wastes.

Biological Control

Using Natural predators such as cats can help to control rodent populations by feeding on rats and mice. (SRC).

Chemical Control

Conditions to be Available Before Rodent Control

a) The control process should be carried out in case of the presence of mice or their effects.

a) The control process should be carried out in case of the presence of mice or their effects.

c) You should use bra-baiting so that avoidance of poison bait does not occur.

d) The control should be performed when the population density is as low as possible [3].

e) The food available should be as low as possible.

f) The control method varies depending on the location and food available.

g) You must use a bait different from the food available in the place.

h) Use attractants if necessary.

Using Rodenticides

Rodenticides consist of different types of poisons used to kill rodents. Rodenticide baits can be lethal for any mammal or bird that ingests them and are not only poisonous for rodents. As a result, all baits pose a high risk of poisoning for non-target animals that might eat the bait or consume a poisoned rat or mouse [4].

a) The use of rodenticides must be used with preventive measures such as gloves.

b) If you choose to use rodenticides, you should be ready to deal with these potential consequences:

c) Rodents are likely to die in locations where they cannot be retrieved

d) The smell of a dead animal will persist for several weeks to several months.

e) Always read and follow the label instructions on the pesticide product. The label is the law and you could be liable for any damage resulting from not following the label instructions.

f) Indoors, only place rodenticide bait stations in locations that are completely inaccessible to children and pets-inside walls, under heavy appliances, or in enclosed crawlspaces [5].

g) It is best to use anticoagulants because they are environmentally safe [6].

h) Passage on the bait’s stations in the early morning or before sunset.

i) The lids of all bait stations must be securely.

j) All bait stations should be numbered, and their location marked on a simple floor plan map.

k) Bait stations should be inspected during every service visit for monitoring purposes and to ensure stations are not providing harborage to non-target pests [7].

l) When dead mice must be disposed of quickly because they have dangerous external parasites.

m) Once all signs of rodents are gone, remove bait stations promptly by placing in a secure plastic bag. (UCDIO) [8].

Read More Lupine Publishers Agriculture Journal Article:

Wednesday, 6 January 2021

Lupine Publishers | Market Structure Conduct and Performance of Live Cattle in Borana Pastoral area: The Case of Moyalle District, Oromiya Regional State

   Lupine Publishers | Current Investigations in Agriculture and Current Research


Abstract

The Borana Pastoralists are known as major cattle supplier of cattle for domestic and international markets, yet the benefits they get from the sector is said to be minimal. This study, therefore, was initiated to identify market chain actors and their function in the market, investigate the structure Conduct and performance of live cattle in Moyalle District of Borana Zone. Both primary and secondary data were used for this study. Primary data were collected from 223 sampled pastoralists, 25 traders and 14 brokers. Before the household survey, key informant interview and focus group discussions were conducted using 10 producers, 5 traders and 3 brokers. Descriptive Statistics and qualitative data analysis techniques were employed to analyze the cattle market structure, conduct and performance. The result shows that producers, brokers, traders and consumers were the major cattle market actors. Two major channels identified in the area were formal and informal. Both the channels are also characterized by their sub-channels.

Among the formal channels, formal market channel is identified as the preferable marketing channel with better total final price share for producers. Regarding the market structure, cattle market is known to be dominated by few traders. Although the degree of competition varies, cattle market structure varies across cattle type marketed from loose oligopoly to strict oligopoly. This shows that only few traders share the majority of market share and earn abnormal profit. Besides, cattle market is characterized by entry barriers such as distant market point, high trucking cost, seasonality of marketing, information asymmetries and unfriendly relation between actors. These imperfect nature of the market in the district provoked informal trade. As the pastoralists mainly depend on cattle for their livelihoods and other cultural values, traders take advantage of the asymmetric market information towards them. Although it varies with the type of cattle, the larger share of the market gains remains with end of traders thereby limiting the pastoralists a chance to realize the economic gains in cattle production. Hence, linking producers to market and its benefits, establishing in cooperatives and development of infrastructure could play a significant role for optimization of the sector productivity.

Keywords: Cattle; Market chain; Pastoralists; Structure; Conduct performance

Introduction

Marketing is the answer to the underdevelopment of developing countries. When adopted and practiced, marketing will help to develop appropriate technologies as developing nations provide for the needs of the people and enhance their standard of living, create job opportunities, wealth for entrepreneurs, a means towards affording education and enjoyment of leisure [1]. In the Borena Area, cattle predominantly flow in a South to North direction, regardless of their market channel [2]. However, the Borena pastoralists are known as the major cattle suppliers for domestic consumption and international trade export, till yet they could not able to be benefited from the sector due to impediments. The lengthy marketing process, high transaction cost, informal cattle trade and the like has been one of major obstacles that caused country to lose a lot of foreign currency. In addition to these, over exploitation of brokers, weak and unfriendly linkage in between the major marketing actors, lack of market-oriented cattle production is some of the main challenges.

To improve the competitiveness of cattle in pastoralist area cost-effective marketing channels and coordinated market chains, which reduce the transaction costs among different actors along the chain are crucial [3]. Majority of cattle marketing information in the pastoralist level is outdated, unreliable and as the result it couldn’t able to provide the real picture of the economic contribution of pastoralists sector for the country economy and the community engaged in the sector. More over these, the critical problem in cattle marketing sector stands in the course of formulating appropriate policies and procedures for the purpose of increasing marketing efficiency in the sector. For the pastoralists’ community undertaking research on structure conduct and performance of cattle is believed to enhance its productivity by locating economical cattle marketing routes. Available evidence shows that limited numbers of investigations have been made on local and regional cattle markets in pastoralist area and the market chain is dominated by many brokers at primary, secondary and terminal markets [4].

Most studies of market chain tend to focus on market chain of the cattle at aggregate level than dealing the market chain of individual cattle types. The present studies try to link this gap by disaggregating the cattle into various types to see the market chain opportunities and problems for each type of cattle separately. Therefore, this study will provide relevant information with respect to the value chain of various cattle types by

a) Identifying the major market actors and their function of cattle market,

b) Identifying the marketing channels,

c) Examining the market structure, conduct and performance.

Methodology

The Borana administrative zone is situated in Ethiopia’s Oromia regional state and located in Southern part at about 570 km (Yabalo town) from Addis Ababa. The capital of Borana zone is Yabello [5]. The Borana zone is made up of 13 districts, divided between two agro-ecological zones, the semi-arid lowlands to the south and the more humid lands at higher altitudes to the north [6]. Moyale is one of the Woredas in the Oromia regional state. It is located 770 km south of Addis Ababa. The Woreda has an area of 14,810 km2 and it is divided into 18 kebele 2 of which are located in Moyale town [7]. It splits the two countries: the larger portion being in Ethiopia (in the Oromia Region and Somalia region) and the smaller in Kenya (i.e. the capital of the Moyale district). It is a busy market for both informal and formal trade of food commodities and livestock [8]. In this study both secondary and primary data was used from different sources. Journals, books, proceedings, CSA and ESAP publications were secondary data sources that used in the study. Primary data sources include Pastoral household interview, traders’ interview, brokers interview and key informant interview.

The study used commodity chain analysis (CCA), which involves mapping the market chains, involved in particular production sectors, different types of activity, geographical location and actors in different roles at different levels. The major market costs considered in the study include, cost transporting, brokering cost, marketing levies and taxes imposed by local authorities [9]. For this particular study two stage sampling techniques was used. Factors like number of live-stock kept, income difference, gender, age of pastoralists, major function of actors in cattle marketing, proximity to major marketing centers and other important economic variables were important issued while selecting the representative households in the districts. The producers interviewed in the study were pastoralists. Both traders and brokers were selected purposely and interviewed. The random probability sampling techniques was used for selecting the representative producer households from the area.

Two stages sampling technique was used for selection of pastoralists Kebele identification that made through secondary data of pastoralists development office. Three Kebeles from the pastoralist area were considered in the survey. Respondent sample size per each Kebele was determined proportionally to the number of total households in the area. The sample size determination techniques employed was Rule of Thumb Techniques that estimate by using the following formula:100% for 0-100 populations,10% for101-1,000 populations, 5% for 1,001-5,000 poulations,3% for 5,001-10,000 population and 1% for more than 10,000 respectively [10]. Based on this technique the sample size of pastoralists household interviewed from respective kebels, Maddo, Maddo Miggo and Laga Sure were 100, 63 and 60 respectively. The survey study at woreda level considered 167 male (74.9%) and 56(25.1) female household heads. The sample size of male and female household heads interviewed in Maddo kebele was 78(78%) and 22(22%).

The number male and female respondents interviewed in Laga Sure kebele was 45(75%) and 15(25%). From whole interviewed respondents in Maddo Miggo Kebele 69.8% (44) was male and 30.2% (19) female. The sample size of traders and brokers was 25 and 14. Descriptive statistical analysis such as mean, mode, percentage and standard deviation of important economic variables considered in collecting information was used to analyze data. Data was analyzed using Statistical Package for Social science (SPSS Verstion.20) and Excel 2007. Besides, qualitative data obtained from focus group discussion, key informant interviews and observations were categorized into similar themes, looked for relationships and interpreted.

Results and Discussions

Socio-Economic Characteristics of Pastoralists

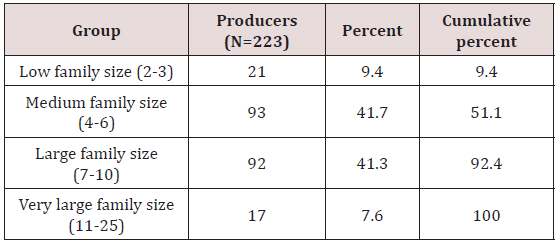
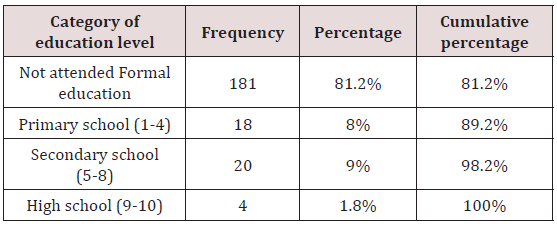
The average age of the Pastoralists household head was 42. However, it ranges in between 20 and 81. The majority of them (96.9%) are in economically active age group in the age range of 20 and 65 years. The family size distribution Table 1 shows that the average family size of Moyalle pastoralists is 7 but it ranges between 2 and 25. The majority of the households have medium and large family size. Those households with very large family size are characterized by polygamous family. The small family size households were young couples. Table 2 revealed that 81.2 percent of sampled households did not attend formal education whereas; the proportion of pastoralist household who attended formal education was 18.8%. The distribution of pastoralist households with respect to formal education attendance shows that less than one fifth they attended formal education. However, study by [11] in Yabello district shows that the proportion of pastoralists who attended formal education is by far greater (41.7 %).

Table 1: Family size of sampled producers.

Lupinepublishers-openaccess-Agriculture

Table 2: Education level of Pastoralist household head.

Lupinepublishers-openaccess-Agriculture

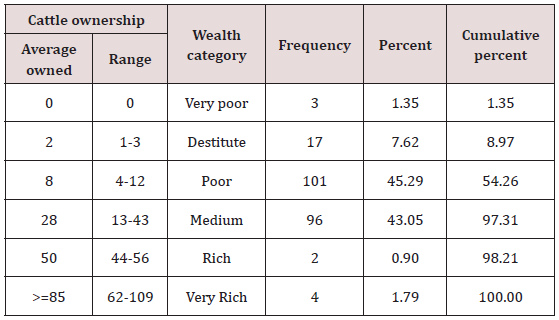
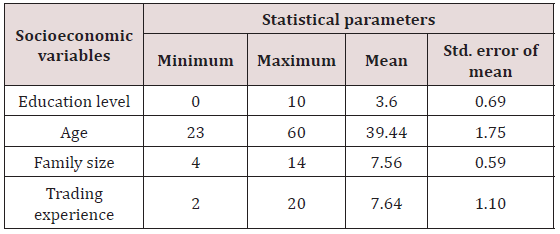
This could be due to the fact that the Moyalle District pastoralists area are less accessed to market capacity development services and infrastructures in relation to other districts in the Borana zone. The majority of households owned cattle in the range between 4 - 12 (45.29%) cattle per head. These are poor category households. This is closely followed by medium category households 43% and own 13 - 43 heads of cattle. The rich and very rich households’ own cattle heads that range from 44-56 and 57-109 respectively. However, the proportion of these households is less that 3 percent. Other study by [12], however, revealed that from the total respondents’ pastoralists in Yabello area about 7 percent were reported to be rich, 10 percent medium, 17 percent poor, and 66 percent were destitute. The socioeconomic profile of cattle traders shows that all (100%) of them were male with a mean age 39.44 years that range between 23 and 60 years. The result shows that all the cattle traders are in the bracket of active age category.

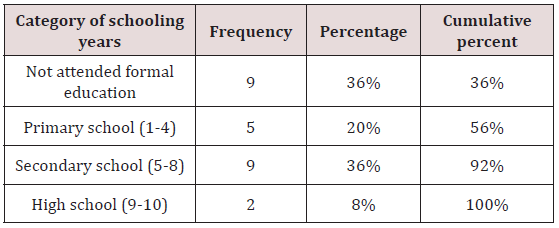
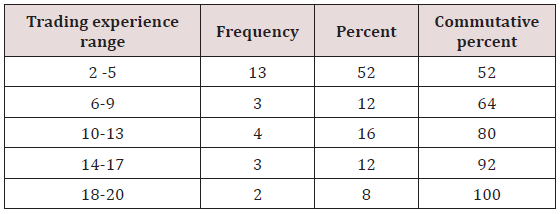
Unlike the pastoralist’s category, the proportion of the traders who attended formal education is nearly two third (64%). This means that about 36% cattle traders were illiterate, 20% attended primary school (grade 1 to 4) and 36% attended junior school (grade 5 to 8) and 8% attended secondary high school (grade 9 up to 10) respectively. This implies that in cattle trading, the importance of education cannot be over-emphasized, for it determines information dissemination and technology adoption among marketers in diverse socio-economic and biophysical environment [13]. Contrary to their education profile, the majority of the traders (52 percent) were with trading experience of less than five years. This reveals due to the infrastructure and development of policy that is relevant to cattle trade, currently attracting more traders. The study results (Tables 3 & 4) observed confirmed also that the mean trading experience for sampled traders in the area was 7.64 years. The general trading experience of interviewed traders ranges between 2 to 20 years. The percent of cattle marketers that had marketing experience ranging from 2 to 5 years, 6 to 9 years and 10 to 13 were 52%, 12% and 16% respectively. The proportion of cattle marketers that had marketing experience of 14 to 17 years and 18 to 20 were 12% and 8% respectively. Hence, the results revealed that majority of cattle traders in the area are highly experienced.

Table 3: Cattle ownership with respect to wealth Classification.

Lupinepublishers-openaccess-Agriculture

Table 4a: Years of Schooling for traders.

Lupinepublishers-openaccess-Agriculture

Table 4b: Experience of cattle traders.

Lupinepublishers-openaccess-Agriculture

Structure Conduct and Performance of Cattle Marketing

Market Structure of Cattle

a) Major Actors and Their Function in Cattle Market

Cattle market structure in Moyalle district of Borana zone is characterized by diverse actors including pastoralists, local collectors, brokers, traders, hotels and restaurants. Each actor has its own function. Pastoralists are the first actors of in the market chain of cattle. Some of major duties and responsibilities of pastoralists include supplying healthy and quality cattle. Brokers are important actors in the market chain of cattle and they play facilitation of market process, market information provision, price setting, and acting as delegates of traders such as making agreement between sellers and buyers [14]. Traders’ role is purchasing, price setting, giving final market price, controlling marketing process and market information provision.

b) Major Channels

With respect to marketing channel, both formal and informal cattle marketing channels exist in the area. As traders pay taxation fee for respected organization in the chain, cattle traveled to central Ethiopia referred as formal market channel. But, Cattle traders those trek cattle from Ethiopia to Kenya do not paying tax and transport through unknown route, the specific market chain defined as informal market channel. Both channels are dominant as in relation to proximity and long-lived history, pastoralists are accustomed to informal market channel. The formal market channel is a newly developed one and it has different sub channels.

Channel I:Pastoralist-Broker-Small Trader-Formal exporter. This cattle market channel is one of formal market channel and practiced by few pastoralists. Here, pastoralists sell to brokers and brokers sell to small traders. The small traders purchase from brokers and resale to formal exporters that come from central Ethiopia cities. Due to infrastructural development and relatively better security in current years, this market channel developed newly in the district. This sort of cattle market channel is experienced by about 5% pastoral households and observed as new opportunities.

Channel II: Pastoralist-Broker-Collectors-Informal Exporter. In this cattle market channel pastoralists sell their cattle to brokers and brokers sell to collectors. Here, collectors purchase cattle from brokers and resell to informal exporters. This market channel has long life history in the district and used to be the only route of cattle marketing before five to ten years ago. This channel is experienced by about 46% of pastoralists’ households in the district.

Channel III: Pastoralist-Collectors-Informal Exporter. This cattle market channel is one of usual market channel. Brokers are not used as mediator in but the small/medium traders in this market channel purchase from producers directly and resell to informal exporters. The proportion of sampled pastoral households accustomed to use this sort of cattle market channel amounts to 4%.

Channel IV: Pastoralist-Brokers-formal Exporter. In this channel the producers sell cattle to brokers and brokers sell cattle to formal exporters and experienced by 2% of pastoralists. This cattle market chain was also identified as newly introduced chain to the area. This sort of market chain should be appreciated and have to be due attention to boost production and productivity of cattle [15]. Here, producers undertake cattle marketing through broker mediating process to other formal exporters and consumers. Ethiopian universities and air lines institutions that come seldom to the area are some listed formal cattle buyers.

Channel V: Pastoralist-broker-informal trader. This market channel is one of channel that identified as informal. Here, Pastoralists sell cattle to brokers and brokers sell to informal exporters that come from Kenya. The proportion of interviewed pastoralists that are engaged in this type of cattle market amounts 2%.

Channel VI: Pastoralists-Other Pastoralists. In this cattle market channel pastoralists sell cattle to other pastoralists and it is known for restocking and usually undertaken around farm gate. The major aim of this market chain is replacing the aged cattle. The proportion of pastoralists that depend on this type of cattle market channel amounts to 12%. Cattle category marketed in this channel comprised of calves, heifer and bulls. Pastoralist households undertake marketing activity in this route by friendship, kinship and neighborhood pattern.

Channel VII: Pastoralists-Broker-Festival Consumer. This channel is one of the oldest and informal institutional based channels. Here the producers sell cattle to other producers, consumer traders, urban dwellers and newcomers from surrounding highlands. The purpose of buyers of cattle is for festival consumption. The proportion of pastoralists households take part in this cattle market channel is 14% of interviewed pastoralists.

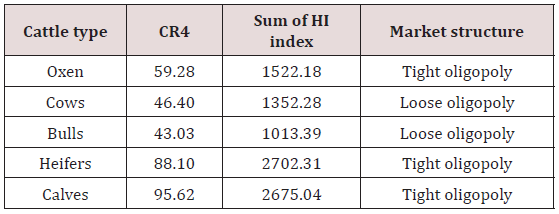
Channel VIII: Pastoralists-Broker-Butchers. This is also referred as newly developed value addition channel that formed due to existence of smuggling activity and settlement of peoples from other areas for this activity. Out of interviewed respondents Pastoralist 15% of the households of sell cattle to brokers and brokers resell the cattle to butchers. this is also referred as newly developed cattle market channel that created in recent years as new market opportunities due to mobilization of peoples to the surrounding and smuggling activity that become job opportunities for majorities. This result tells about how the cattle market chain complicated by lengthy routes that hinder not to exploit the resource at pastoralists district by producers and tilted the market toward informal trade. This study calls for systematic intervention for cutting off unnecessary market route and adopting legalized market channel toward the vicinity African countries. As indicated in the (Table 5) above (5) the market structure shows distinctive features according to cattle type marketed. Market structure for oxen, heifers and calves trade is tight oligopoly but it is a loose oligopoly for cows and bulls trade. Since heifers and calves are often marketed among pastoralists and rarely by informal traders and not by formal traders, the market structure is tight oligopoly.

Table 5a: Socioeconomic characteristics of traders (N=25).

Lupinepublishers-openaccess-Agriculture

Table 5b: Summary of Market structure for Cattle Trading.

Lupinepublishers-openaccess-Agriculture

In addition to these, calves are unable to trek long distance in the marketing route, they are not preferred by market actors. The market structure for oxen trade tight oligopoly, because pastoralists supply at bull and oxen are usually demanded only in limited festivals. The implication of this is that market actors want ox at bull stage in order to exploit value added in the chain and easily trek/truck the bulls. Consequently, traders in the area undertake marketing activity having been closely creating market relation so as to exploit benefits that belongs to producers. In addition to these, bulls trade encompasses various market actors such as informal traders, formal traders, hotels and restaurants and festival consumers, the market structure is relatively loose oligopoly. The cow trade is also including various market actors such as pastoralists and informal exporters; its market structure is loose oligopoly. This point out that tight oligopoly reduces competition and the entire market remains a “few traders game” where created wealth does not flow to all the beneficiaries in equitable ratio. Arguably, it should again be noted that failure to enjoy such benefits may distort market operations and eventually lead to collapse of the cattle production system. This calls for systematic government intervention in the sectors that could mitigate imbalance of trade benefits and help to optimize productivity through market linkage formation, adoption of value addition and development, update market information provision and cooperative formation.

c) Entry and Exit Conditions in the Cattle Market

The long market distance from pastoral areas to central towns of Ethiopia and the related high trucking cost, high capital demand, institution-based marketing and information asymmetries are some of the major entrance and exit barriers in cattle trade in the area. The number of cattle supplied to market in holidays, religious festivals and weeding occasions are also higher than that of other seasons. In order to undertake marketing activity directly; it is must to speak local language. So as to take part in cattle trade, it is also must secure large amount capital for purchasing cattle, trucking and trekking.

Market Conduct

Market Conduct refers to the strategies adopted by a player as a way of adjusting to the market conditions in order to fully enjoy the market benefits. Notably, it includes mechanisms such as price setting and terms of payment.

a) Price Setting Mechanisms

The price setting activity of cattle in pastoralist area is known to be accomplished by various actors in the market. About 62% of pastoralists confirmed that price of cattle is set by brokers based on initial price given by sellers and final price from buyers. The proportion of pastoralists recognized determination of price by buyers based on central market information, by brokers based on central area information and sellers by their own respectively is 22%, 10% and 6%. This shows that market actors had different level of influence in the role they played for setting price. It is observed that every aspect of price setting mechanism majorly is controlled by traders. This means that price setting in cattle market is often skewed toward traders and brokers. The result indicates that traders undertake non-price competitions including cattle type, trade experience, personality, financial capacity and language. The implications of this market structure are few potential traders’ accounts for large market share, market dominance by these top four traders, interdependency and collusion possible.

b) Terms of Payment for Producers

Both the household survey and key informant interview reveals that the cattle marketing by pastoral households has been undertaken in inform of cash or hand by hand currency. The proportion of producers who indicated cattle marketing carried out in the form of direct cash payment is 96%. The remaining 4% of the pastoralists marketed both in credit and hand in hand cash payment before three to five years. This justified that almost all producers market their cattle inform of direct cash transfer in current years. The main reason for ceasing of cattle trade in form of credit from previous years to current is loss of certain capital due to credit. This means that market actors in the area assured that before five-year certain informal traders had purchased cattle in form of credit did not repay the credit back. This phenomenon had ceased credit marketing system in the district.

Market Performance

Market performance refers to the impact of structure and conduct as measured in terms of variables such as prices, costs, and volume of output. Analysis of the level of marketing margins and their cost components could help to evaluate the impact of the structure and conduct characteristics on cattle market performance. The marketing margin of cattle is the difference between the revenue from the sales of cattle and the costs incurred in running the market operation. The net marketing margin of cattle (NMM) is also the percentage over the final price earned by the intermediary as his net income once his marketing costs are deducted and is one of the best tools to analyze performance of cattle market. Marketing margin was calculated taking the difference between producers and formal exporter or informal trader prices. Mathematically, producers share expressed as: PS=Pp/Pt = 1-MM/Pt where PS=producers share, Pt=price of traders, and MM= market margin.

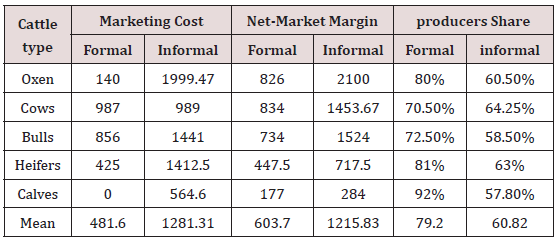
In general, producer’s share of final price in formal channel higher than that of informal, which points out that formal route is preferable for them. Since traders and brokers obtain relatively better market margin in informal route, it is difficult to compete for formal traders with informal traders in the district. In contrary to free market economy, market concentration ration and market margin estimated for cattle market shows oligopolistic nature. It therefore means that the formal or informal market cattle traders do not bare full cost involved in the market thereby leading relatively low marginal costs. This is to mean that the cattle market is disintegrated in such a manner that price levels does not relay from the cattle keepers to the terminal market traders. Indeed, it is observed that the principle of free market through bargaining is distorted once a new market entrant is discovered. For example, buying at a relatively fair price requires one to have known the local language at the farm gate market, security and cattle type marketed (non-price competition).

This means that without close relation with the market brokers; one is subjected to price discrimination. Since the market is flooded by brokers at all the chain terminals; it is very difficult to assess the efficient market price and general information. It was observed that there exists larger number of market brokers both for different live cattle and in many cases; the brokers hold much needed information so as maximize on the commissions. Monopoly market structure violates the principle of equity between the traders and the pastoralists. This is because the larger share of the market gains remains with end of chain traders thereby denying pastoralists a chance to realize the economic gains in cattle production.

Comparison of Market Margin Across Cattle Type and Marketing Channels

The market performance of cattle marketed varies across cattle type marketed and the type of channel used. The empirical result in Tables 2 & 6 indicates that the cow traders earn highest net market margin but, calve traders earn lowest net market margin in formal channel. The level of net market margin earned in informal channel is highest for ox traders, while it is lowest for calves. The proportion of producer share of final cattle price from informal market channel is 18% lower than that of formal. This indicates that it is advisable for producers to market cattle though formal channel, while it is good for trader to use informal channel that is well developed in value addition practices and linked to the largest east Africa market point, Nairobi, which by its own make difficult to compete for formal traders with informal channel that has higher market margin (Table 6).

Table 6: Comparison of Market Margin across cattle type and marketing channels.

Lupinepublishers-openaccess-Agriculture

Conclusion

Almost all market structure of cattle in the area shows the noncompetitive nature. The market concentration ratio for top four cattle trader is ranged between 43.03 and 95.02. The estimated HI index is between 1013.39 and 2702.31. This concentration ratio indicates that the market structure of cattle is imperfect, and the competition is among the few traders. This few large traders share majority of market share and earn abnormal profit. This could be one of the suspected reasons for producers for shifting from cattle to camel and small ruminants and low productivity of the sector. Hence, it is must for systematic government intervention to minimize exploitation benefits by trader’s that belongs to producers through cooperative establishment. For each cattle type there are formal and informal market channels. Among the channels the first formal channel was identified as the preferable marketing channel that has higher and better total final price share for producers. The monopoly nature of the terminal cattle market denies the efficient market principles that forces producers not to optimize productivity.

The analysis of the marketing costs and margin revealed that brokers incurred the lower marketing cost and traders the higher marketing cost in all cattle type. The market cost of trader and broker in informal market channel is higher than formal. Marketing margin of traders and brokers is different along different channels. Traders and brokers get relatively better profits in informal channels. This could be the reason for most traders to participate in informal channel. The producers’ share of final of cattle is relatively better in formal channel for producers. The study indicated that it is better for producers to sale cattle at formal channel, where they could optimize their benefits through cooperative and reduced transaction costs. By summing up, contrary to free market economy, market concentration ratio and margin estimated shows oligopolistic nature. It therefore means that the formal or informal market traders mainly for cattle do not bare full cost involved in the market thereby leading relatively low marginal costs.

By intuition therefore, it means that the cattle market is disintegrated in such a manner that price levels does not relay from the cattle keepers to the terminal market traders. The monopoly power in this case lies with the informal traders who are at the end of the chain. Since the pastoralists purely depend on cattle for their livelihoods, it was noted that traders take advantage of the market information to exploit the keepers through price discrimination. It was observed that there exists larger number of market brokers both for different live cattle and in many cases; the brokers hold much needed information so as maximize on the commissions. It is also observed that monopoly market structure violates the principle of equity between the traders and the pastoralists. This is because the larger share of the market gains remains with end of traders thereby denying pastoralists a chance to realize the economic gains in cattle production.

Read More Lupine Publishers Agriculture Journal Article:

Wednesday, 30 December 2020

Lupine Publishers | Effect of GA3 on Germination Parameters of Different Varieties of Kiwi

 Lupine Publishers | Current Investigations in Agriculture and Current Research


Abstract

Premises of the Research: Kiwi, Actidinia deliciosa is a temperate fruit with high nutritional and medicinal value which is commonly propagated through rootstock grafting. Low seed germination because of seed dormancy and chilling requirement limits seedling production which can be improved by chemical treatment and varietal selection.

Methodology: Germination response of three varieties viz. Abbot, Allison, Bruno pre-treated with 2000, 4000, 6000ppm of GA3 including control was studied in two factor Factorial Complete Randomize Design with six replications in laboratory of Lamjung Campus.

Pivotal Results: Significantly higher germination percentage (68.67%) was found in Bruno without pre-treatment of seed followed by Allison pre-treated with 6000ppm of GA3 (47.33%). GA3 alone significantly influenced mean germination rate and time. However, Allison with 6000ppm GA3 had fastest mean germination rate (0.059 day-1) and time (17 days). Statistically different germination index, coefficient of variation of germination time and uncertainty of germination was found.

Conclusion: Seed germination can be enhanced by treating 4000-6000ppm GA3 for Abbot, Allison while Bruno requires no pretreatments of seeds.

Keywords: Dormancy; Germination Percentage; Mean Germination Time; Pre-treatment; Vigor

Introduction

Kiwi fruit (Actnidia deliciosa (A Chev)) called as ‘Chinese Gooseberry’ is native to Yangtze valley where it evolved with the southeastern subtropical flora [1]. It is planted in T-bars or pergola and woody vines can go up to 9m height. The Kiwi fruits can withstand up to -15oC and flower appearance takes in the spring [2]. The fleshy fruits with seeds embedded inside are called berries which are of different size, shape, color and hairiness [3].

The global Kiwi production reached 4.27 billion metric ton in 2016 [4]. The export trade of kiwi is increasing year over year, increased 8.1% in 2016 to 2017. In 2017, the major exporter are European countries (mainly Italy and Belgium) 43.9% and Oceanian countries (mainly New Zealand) 43.7%. New Zealand is the largest exporter while China is the largest producer of Kiwi fruit. Nepal ranked 83rd in Kiwi exporter with 0.0001% world total export. The export was about $3000 only. There is a good opportunity to country like Nepal with negative net export to increase the production of Kiwi for export which would decrease the overall trade deficit (Workman, 2018). Kiwi fruit is gaining popularity and cultivated commercially by farmers of Kabrepalanchowk, Lalitpur, Kathmandu, Dolakha and Illam districts where sapling is supplied by a nursery in Kabrepalanchowk and by ICIMOD. It can be a source of cash income to farmers to improve livelihood. Also, in sloping land it helps in erosion control and sustainable land management practice. In the areas, economic yield is 40 to 60Kg per vine of 5 to 8 years old vines or 20 to 25tons per hectare [5].

Kiwifruit is propagated either sexually or asexually by grafting, micro-propagation or cutting and grafting on seedling rootstock is common commercial practices [6]. But the seed have low germination capacity [7] which makes Kiwi propagation difficult in general ways. During favorable condition and germination permissive environment too, seed germination is poor and erratic due to seed dormancy [8-12]. Stratification under cool and moist condition or gibberellic acid treatment improves germination rates [13,14]. Treatment with 2500ppm of gibberellic acid gives 31. 67% germination [15]. The higher concentration of gibberellic acid of about 2000ppm to 6000ppm for 24 hours shortens the germination period [16]. The use of GA3 primed seed is believed to increase the seed germination and seedling vigor. Since, the germination of Kiwi seed is low and there were unsatisfactory researches based on single factor it was necessary to combine several factors to increase Kiwi seed germination [17]. Thus, we used two factor CRD in this experiment to enhance seed germination of different varieties of Kiwi and specifically, to determine germination parameters of Kiwi seed.

Methodology

Preparation of Materials (seed and solution)

The fruits of Kiwi after a week of harvest were used for seed extraction: peeled, cut and crush to separate seed from pulp. These seed were cleaned (rinsed with water), dried and were packed in polythene seed packet before priming. The GA3 powder was dissolved in water using ethanol (99%) and slight heat to get required concentration viz. 2000ppm, 4000ppm and 6000ppm.

Experimental Design

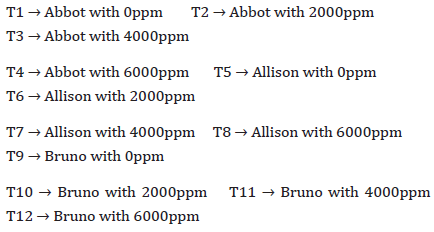
Laboratory test was performed in Horticulture Laboratory, Lamjung Campus. A two-factor factorial Complete Randomize Design with six replications were used with following treatments:

Lupinepublishers-openaccess-Agriculture

Each of treatment had 150 seeds with 25 seeds in each of 6 replications. 12 beakers each containing 150 seed of 3 variety in equal proportion were taken. Distilled water, 2000ppm GA3, 4000ppm GA3 and 6000ppm GA3 was poured twice their volume and primed for 24 hours and dried for next 24 hours. Petri-dish covered with moistened filter paper (12mm) was used. Petridish was put for germination at 22oC in darkness in germinator. Rehydration for moisture maintenance was done as required.

Data Collection and Statistical Analysis

Each day scoring of each petri-dish was recorded, counting germinated when sprout is 2mm long. The scoring was done until no germination for 3 consecutive days. Removal of molded and dead seeds were continuous in the test period. The data from the test datasheet were used for calculating following parameters using excel.

Germination Date: According to Labouriau [12], First Day of Germination: to = Time for the first germination known as First Germination of Day (FDG). Last Day of Germination: tg = Time for the last germination known as Last Germination of Day (LDG). Time Spread of Germination (TSG): It is time in days between FDG and LDG in a germination test period.

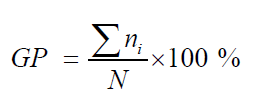
Germination Percentage (GP): According to Labouriau [12], it is percentage of seed in which germination process ends to the sample taken in the experiment conducted.

Lupinepublishers-openaccess-Agriculture

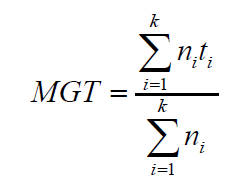
Mean Germination Time (MGT): According to Labouriau (1983a),

Lupinepublishers-openaccess-Agriculture

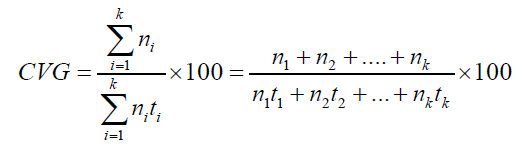
Coefficient of Velocity of Germination (CVG): It is reciprocal of Mean Germination Time. According to Nichols & Heydecker [18],

Lupinepublishers-openaccess-Agriculture

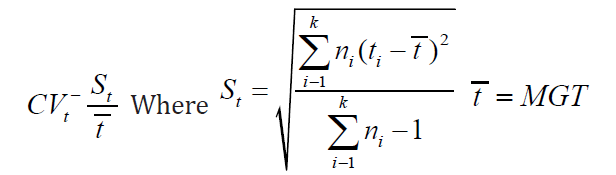
Coefficient of Variation of Germination Time (CVt)

Lupinepublishers-openaccess-Agriculture

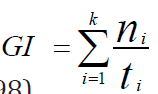
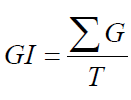
Germination Index (GI): As per Throneberry and Smith’s method, adopted by Maguire [19]

Lupinepublishers-openaccess-Agriculture and Timson Lupinepublishers-openaccess-Agriculture Ajmal Khan & Ungar (1998)

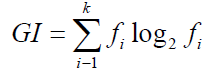
Uncertainty of Germination Process (U): According to Labouriau & Valadares [20]

Lupinepublishers-openaccess-Agriculture where fi = relative frequency of germination Lupinepublishers-openaccess-Agriculture

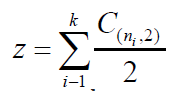
Synchrony of Germination (Z): According to Primack [21],

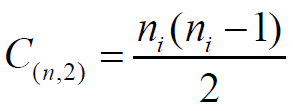
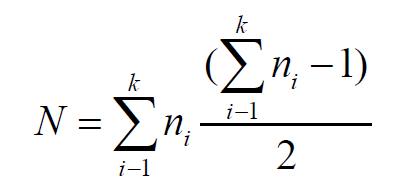
Lupinepublishers-openaccess-Agriculture where Lupinepublishers-openaccess-Agriculture combination of seeds germinated in i time

Lupinepublishers-openaccess-Agriculture

Seedling Vigor Index (SVI): According to Abdul-Baki and Anderson [22]

Lupinepublishers-openaccess-Agriculture

Where Sl = Average shoot length (cm)

Rl = Average root length (cm)

In above formulae,

ni = number of seeds germinated in the sample ith day or time observation

N = number of seeds taken in sample

ti = day or time of experiment from start to ith observation

k = last day or time of observation

G = Germination percentage and T = Germination Period

The parameters taken were statistically analyzed by Fischer test in two-factorial ANNOVA Complete Randomize Design in R - Stat 3.1.3 software package. The mean separation was performed by Duncan’s Multiple Range Test at 0.05 probability level.

Result

Number of Seed Germinated Per Day During Germination Period

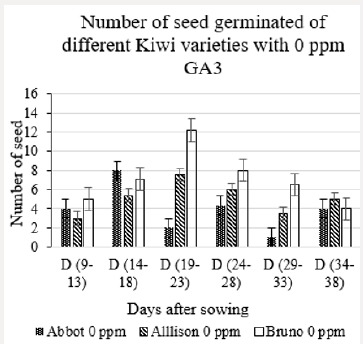
Figure 1: Number of seeds germinated of different Kiwi varieties with 0ppm GA3.

Lupinepublishers-openaccess-Agriculture

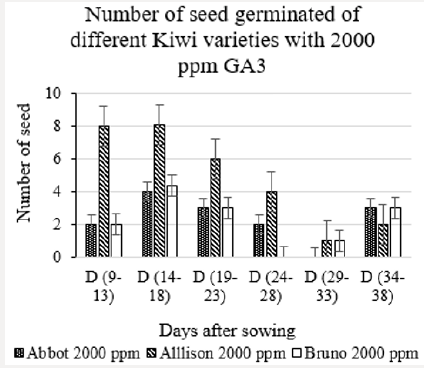
Figure 2: Number of seeds germinated of different Kiwi varieties with 2000ppm GA3.

Lupinepublishers-openaccess-Agriculture

The first day of germination was 9th day and last day of germination was 38th day after sowing. Accordingly, time spread of germination (Germination Period) was of 30 days (Figures 1-4). The experiment revealed among Kiwi varieties without pretreatment of GA3, the variety Bruno had higher number of germinated seeds per day. This was significantly higher in the period of 19th to 33rd days after sowing (Figure 1). On the other hand, among seed pretreated with 2000ppm of GA3 Allison variety showed higher germinated seed per day during period 9th to 28th day after sowing which was significant (Figure 2).

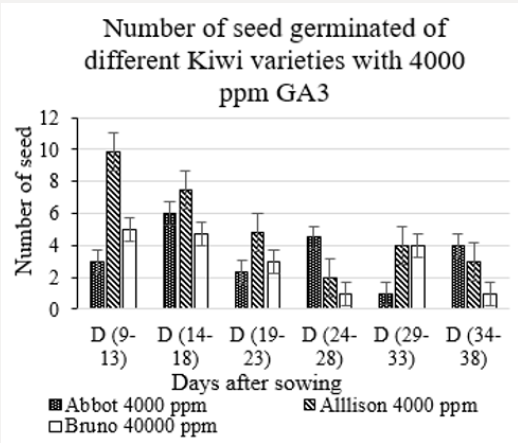
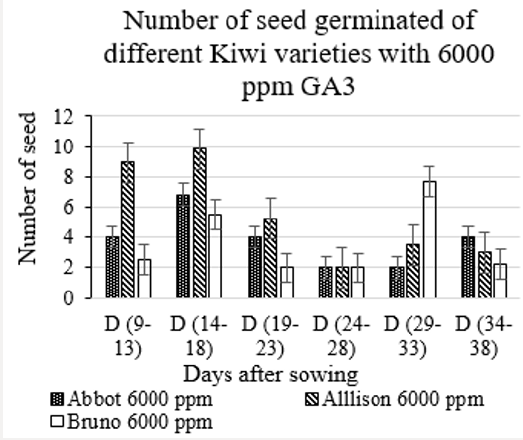
Likewise, among the seed pretreated with 4000ppm of GA3, Allison had significantly greater number of germinated seeds during period of 9th to 23rd day (Figure 3). While, both Allison and Bruno had similar and statistically higher number of germinated seeds per day than. Abbot, among the seeds pretreated with 6000ppm of GA3 (Figure 4).

Figure 3: Number of seeds germinated of different Kiwi varieties with 4000ppm GA3.

Lupinepublishers-openaccess-Agriculture

Figure 4: Number of seeds germinated of different Kiwi varieties with 6000ppm GA3.

Lupinepublishers-openaccess-Agriculture

Effect of variety and GA3 on germination parameters viz. GP, MGT, CVT, MGR, U, Z, CVG and GI of Kiwi seed.

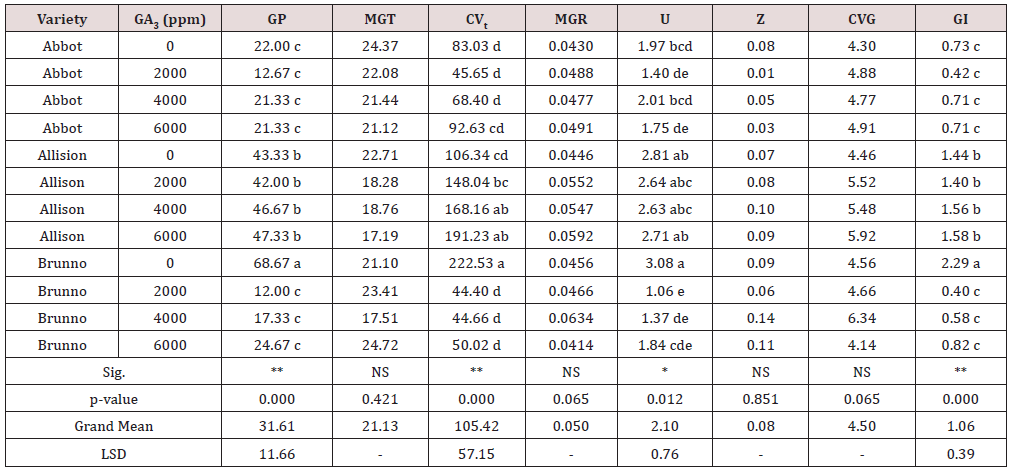
Significant difference was found between influence of variety and GA3 on the parameters of germination viz. Final Germination Percentage, Coefficient of Variation of Germination Time, Uncertainty of Germination and Germination index whereas for Mean Germination Time, Mean Germination Rate, Synchrony of Germination and Coefficient of Velocity of Germination wasn’t significant (images 1).

Table 1: Interaction effect of variety and GA3 on GP, MGT, CVt, MGR, U, Z, CVG and GI of Kiwi seed.

Lupinepublishers-openaccess-Agriculture

Note: GP → Germination Percentage (%), MGT → Mean Germination Time (day), CVt →Coefficient of Variation in Germination Time (%), MGR → Mean Germination Rate (day-1), U → Uncertainty of Germination Process (bit), Z → Synchrony of Germination (unit less), CVG → Coefficient of Velocity of Germination (%), GI → Germination Index (seed day-1)

*p – value < 0.05

**p – value < 0.01

Germination Percentage

Bruno with 0ppm of GA3 had significantly higher germination percentage (68.67%) than other treatments. It was followed by Allison with 6000ppm statistically at par with 4000ppm, 2000ppm and 0ppm. Minimum germination was found in Bruno with 2000ppm (12.00%) which was statistically at par with Abbot with 2000ppm, 4000ppm and 6000ppm; Bruno with 4000ppm and 6000ppm. This showed germination capacity of Kiwi seed is influenced by gibberellic acid concentration. Allison with 6000ppm with higher followed by continuously decreasing germination with 4000ppm, 2000ppm and 0ppm which clearly showed stimulating effect of the gibberellic acid on germination of Allison seed whereas opposite effect in Bruno variety indicated gibberellic acid at higher concentration can have inhibitory effect on germination as well.

Mean Germination Time

The overall Mean Germination Time was found to be 21 days and shortest time of germination was for Allison with 6000ppm (17 days) and longest time of 24 days was taken by Abbot with 0 ppm which was at par with 24 days taken by Bruno with 6000ppm which again showed negative effect of gibberellic acid on Bruno.

Mean Germination Rate

Mean Germination Rate is reciprocal to Mean Germination Time mathematically which was showed by analysis too which is Allison at 6000ppm (0.059 day-1) had maximum rate and Abbot with 0ppm along with Bruno with 6000ppm had the slowest rate.

Coefficient of Variation of Germination Time

Bruno with 0ppm (222.53%) had highest coefficient of germination time which was statistically at par with coefficient of Allison with 6000ppm and 4000ppm. Furthermore, both Abbot and Bruno with 6000ppm, 4000ppm and 2000ppm; and Allison with 0ppm had statistically inferior coefficient of variation of germination time.

Uncertainty of Germination

The germination was most spread for Bruno with 2000ppm with uncertainty of germination 1.06 bit which is statistically at par with Bruno with 4000ppm and 6000ppm along with Abbot with 6000ppm. The degree of spreading time of germination was least for Bruno with 0ppm followed by Allison with 6000ppm, 4000ppm, 2000ppm and 0ppm. As a whole 2.1-bit uncertainty of germination indicated Kiwi seed has a higher degree of germination in germination period.

Synchrony of Germination

The grand mean of Synchrony of Germination 0.07 indicated negligible degree of overlapping was seen in germination. Being non-significant greater synchrony was for Allison with 4000 (0.10) and Bruno with 6000ppm (0.11) and lowest for Abbot with 2000ppm (0.01).

Coefficient of Velocity of Germination

The number of seeds germinated per unit time was greater for Bruno with 4000ppm with CVG of 3.41% followed by Allison with 6000ppm, 4000ppm and 2000ppm. It is similar to the rate of germination.

Germination Index

The germination index was found to be maximum for Bruno with 0ppm statistically superior to others. All GA3 treatments of Abbot and Bruno (excluding with 0ppm) has lower germination index than Allison with GA3 treatments.

Effect of variety and GA3 on Seedling Vigor Index and Root Shoot Ratio

Seedling Vigor Index (295.18) was greatest for Allison with 6000ppm and lowest for Bruno with 6000ppm and lowest for abbot with 0ppm GA3 which had no difference statistically (Figure 5). The Root Shoot Ratio of the Kiwi germinated seed after 38th day of sowing (Figure 6). The average Root Shoot Ratio was 0.2235 for the Kiwi and variety Allison, Abbot and Bruno had 0.2310, 0.2253 and 0.2145 as Root Shoot Ratio respectively.

Figure 5: Seedling Vigor Index of Kiwi germinated seed pretreated with different concentration of GA3.

Lupinepublishers-openaccess-Agriculture

Figure 6: Root Shoot of Kiwi germinated seed pretreated with different concentration of GA3.

Lupinepublishers-openaccess-Agriculture

Discussion

Number of Seed Germinated Per Day During Germination Period

The first day of germination was 9th day after sowing which is earlier than first germination after 1 month of harvest [23]. Furthermore, last day of germination was 38th day after sowing, while findings show in control condition it takes 52 days to complete germination [24]. Accordingly, spread of germination (Germination Period) of 30 days is also shorter than that at normal condition. This result is supported by reasons that period of germination is shorten by 2000 -6000ppm of GA3 priming for 24 hours [25,16]. These shortening of first and last day of germination is due to GA3 effect on rate of germination. This effect is due to increased imbibition of water for initiation of germination and increased cell division [26]

Germination Percentage

The result for germination percentage of Bruno variety is in accordance to Mattiuz et al. [27] that low germination of 35.47% seeds treated with 6000ppm GA3 than germination of 36.85% with 2000ppm. The findings of Ozcan and Erisgin [15] that 6000ppm of GA3 has low germination (35%) than 2000ppm of GA3 with germination (44%) also similar to our result.

On the other hand, researchers have performed experiments which resulted higher germination at higher concentration of GA3 such as 79% germination at 6000ppm GA3 and 28% germination of untreated seeds [17]. This findings are in accordance to the result of variety Allison and Abbot in this experiment. The germination stimulating role of GA3 in Allison and Abbot variety is mainly due to breaking of dormancy that substituted necessity of stratification [28]. Its acts on germination promotion as it removes impermeability of seed coat [29] and it helps exposing macrosclereids cells in imbibition of water for initation of germination [26]. Its affect in cell division and dry weight gain which shows marked effect on seedling growth [28]. However, the germination retarding or negative effect in Bruno variety is due to low chilling requirement of the variety which is ill affected by higher concentration of GA3. This inhibition can be compared to findings that germination inhibition is nearly associated with stimulation which appers in different concerntration, sometimes one after another [30]. The performance of untreated seeds can further be explained from previous facts that germination is improved by activity of antioxidants like superoxide dimutase, catalase and ascornbate peroxidae which is achieved by hydro priming only [31].

Mean Germination Time

The overall Mean Germination Time was found much lower than that previously reported Kiwi seed takes 52 days for germination [24] at 15oC under controlled condition which indicates GA3 hastens the process of germination and increase rate. This finding of shorten mean germination time on seed priming is supported by result of Lawes and Sim [25] that GA3 2000 - 6000ppm shortens germination period. This is because GA3 helps in early seed emergence and growth [32,33]. Overall period and time of germination shortened because of dormancy breaking action of GA3. It stimulates hypocotyl growth by initiation of cell division and elongation by primarily acting on cell division, then on cell enlargement [34,35].

Mean Germination Rate

Findings of Ynoue et al. [14] that chemical treatments using GA3 for 24 hours or stratification increases germination rate supports this result of overall increase in germination rate which also resulted shortened mean germination time.

Germination Index

The result indicates that variety had greater influence in germination index while it is less effected by GA3 concentration. The average germination index of 1.05 (higher than 100%) showed similar germination per day of Kiwi seed in germination period. The similarity and correspondence in GP and GI show to the report that use of germination percent eliminates the effect of sample size to calculate germination index than number of seeds germinated [36].

Seedling Vigor Index

Ashraf and Foolad [37] reported seed primining enhance the seedling vigour which contrasts our findings. Also, higher superior seed vigor index and seedling dry weight than non-primed cowpea seed [38-40] contrast our finding.

Conclusion

It can be inferred from the experiment that GA3 primed seed have faster germination rate and lower mean germination time than hydro-primed seed. Seed germination can be enhanced by treating 4000-6000ppm GA3 for Abbot, Allison while Bruno requires no pretreatments of seeds.

Read More Lupine Publishers Agriculture Journal Article: