The main objective of this paper is to reveal the less known effects
of urban farming practices on income poverty reduction in
Dodoma Municipality, Tanzania. Collected primary and secondary data were
analyzed both manually and by the use of SPSS software
in which descriptive statistics and multiple responses presented by
frequencies and cross tabulation employed. The findings show
that the male raised higher income (61.7%) compared to women (38.3%)
resulted from urban farming practices. It also shows that
the majority of urban farmers use rain water compared to other sources
of water. The capital availability found to be a problem
(73.3%); has income below TZS 90,000 per month. The study also revealed
that urban farmers use poor technology in farming
activities. However, the study found that urban farmers practice
agro-forestry which help to prevent land degradation and to enrich
soil fertility as well as acting as wind breakers and shade provision.
It was found that, though urban farming practices contribute to
reduce income poverty in the study area but there are some factors which
found to hinder the improvement of urban farming such
as inadequate water supply, inefficiency laws and by laws and lack of
improved seeds due to insufficient capital. These problems
can be minimized through early seed provision from government and NGOs,
use of irrigation technology rather than depending on
rainfall, efficiency and effectiveness implementation of laws and
by-laws and increase area for urban farming as population increase
in Dodoma municipality due to concentration of colleges/universities and
government activities.
Keywords: Urban farming; Urban famers; Income poverty; Land degradation
Introduction
Background information
farming is very extensive in urban areas in developing
countries. Urban farming includes activities such as crop farming,
vegetables, gardening, livestock keeping and poultry. It is estimated
that; urban farming is practiced by about two thirds of urban
workforce in developing countries [1]. Urban farming could
contribute to mitigating the two most intractable problems facing
third world cities which are poverty and waste management. Urban
farming is one of several food security options for households.
Similarly, it is one of several tools for making productive use of
urban open spaces, treating urban waste, saving or generating
income and employment and managing fresh water resources more
effectively ibid, 2000.
The main motivation for urban farming is food production
and/or higher income for personal consumption or sale ibid,
2000. Tanzania economy is still depending on agriculture as its
main stay. In the year 2015, the contribution of the agriculture to
the total GDP has been around 29%, and contributed 70% to the
total employment and 55% of the country’s foreign currency [2].
Dodoma urban as one of the semi-arid areas in the country, through
municipal councils’ authorities set strategies on encouraging
farmers to put priority on production of drought resistant crops
such as cassava, millet, sorghum and sunflowers in all areas with an
annual rainfall between 400mm-600mm (Municipal Agricultural
and Livestock Development Officer, 2016). In Miyuji ward there was
more than 13.6 hectares which were used for growing grapes and
other plants but now only 6.2 hectares are used for these activities (Dodoma Municipal Report, 2016). This shows that there is a
decrease in urban farming practices in Miyuji ward more than half
of the area which planned for agriculture.
Statement of the problem and significance of the study
Dodoma municipal council has 196,000 hectares suitable for
cultivation but only 137,200(70%) hectares have been cultivated.
Out of cultivated area, 11433(12%) hectares are used for urban
farming and only 1509(1.1%) hectares are used by small farmers
in Dodoma municipal council. Urban farming in Dodoma was
mostly practiced by farmers in Miyuji, Msalato, Veyula, Mzakwe,
Makutupora and other areas in Urban and Peri-Urban (Dodoma
Municipal report, 2016). About 68% of the estimated 16,579 human
population (2016) in Miyuji ward are relying on arable farming and
livestock keeping.
The ward estimated to have 3832 hectares of arable land but
only 1734.7 hectares are used for farming (Miyuji WEO office
report, 2016).Despite of the hectares used for urban farming in
Miyuji ward is being decreasing, yet the living standard of people,
especially urban farmers, is very poor in the ward. Therefore, this
study intended to examine the effects of urban farming practices
on income poverty reduction in Dodoma municipality. The findings
of the study will be useful in reducing income poverty to urban
farmers by promoting urban farming through identified constraints
and opportunities facing urban farming practices and formulating
competent national policies which will be used in improving urban
agriculture, and help to add literature related to urban farming.
Research objectives
General objective: The main objective of this research was to
examine the effects of urban farming practices on income poverty
reduction in Dodoma municipality.
Specific Objectives: Specifically, the study was intended to:
Examine factors affecting the performance of urban farming
practices in the study area
Examine contribution of urban farming on income poverty
reduction in the study area.
Examine the effects of urban farming on the environment in the
study area.
Conceptual framework
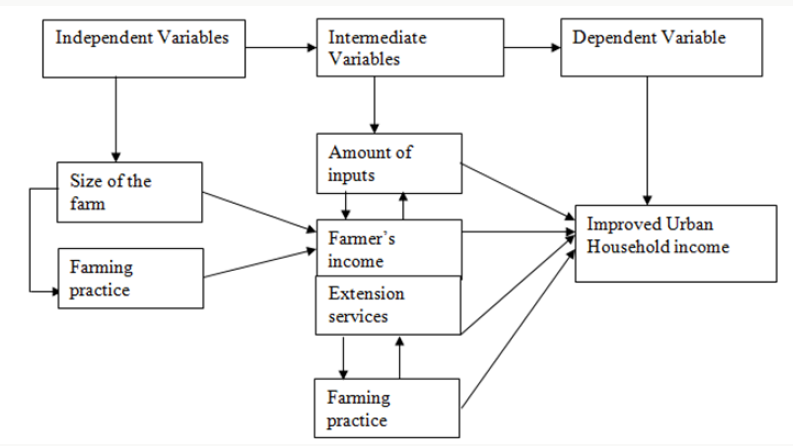
The primary interested variable of this study is the dependent
variables which is assessment of urban farming practices. The
intermediate variables will be used in attempt to explain the
dependent variables; these variables are amount of inputs, farmers’
income, Extension services and farming practice. Independent
variables acting on and operating through intermediate variables
which cause or determine or influence dependent variable to occur.
The Figure 1 below shows the conceptual framework in a clear and
simple way.
Figure 1: Conceptual Framework of the Study.
Research Methodology
The study area
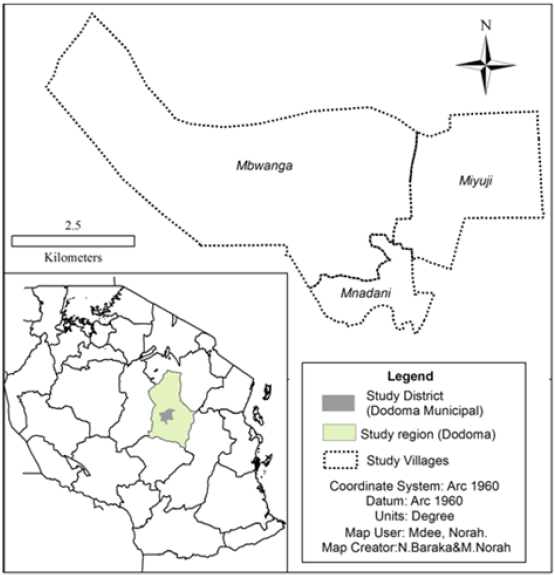
The researcher chooses Miyuji ward as the study area in Dodoma
municipality due to the fact that, it is among the area which urban
farming practices were given priority and there were planned land
for such activities (Dodoma Municipal council report, 2016). Miyuji
ward is located in urban area of Dodoma Municipality which lies
between Latitude 60–6030/ South and longitude 3503/–36002/ East.
Dodoma Municipality has an area of 421km2 of which 346km2 is arable land, 57.1km2 is residential and industrial area 17.9km2
occupied by natural resources and planted forests, mountains
and non-arable land (Figure 2). According to projection basing on
year 2012 population census, the current population of Dodoma
municipality accounts to 446, 579 inhabitants, where by 240, 481
inhabitants live in urban areas and 206, 098 live in peripheral zone
consisting of villages. The population size of Miyuji ward in 1988
was about 14,288; 2002 was about 15,779; and 2012 was about14,
965. This situation shows that the size of Miyuji was dramatically
decline for about -0.47%/year from 2002 to 2012.
Figure 2: Map of the study area.
Data types and sources
Both primary and secondary data were used. Primary data such
as income levels and farm sizes were collected in Miyuji ward by
using household questionnaire. Secondary data such as number of
extension workers, number of market centers were collected from
street and ward executive offices by reading different reports and
documents existent.
Sampling design
Sampling frame: A list of all households was used to pick
respondents where a sample of 70 respondents was taken
to represent the total population. Judgmental sampling was
categorizing samples into different groups such as household with
large arable land, household with small arable land, local leaders,
extension workers (EW) and District Agricultural Officer (DAO)
Sampling unit: The sampling unit for this study was a
household.
Sample size: The sampling size for this study was 100 (Table
1), which involves 90 households and key informants. Yamane
(1967), provides a simplified formula for calculating sample size
as follows:
n=N/1+N(e)2
Where: n=Sample size
N=Population size (Number of households in my case)
e=Level of Precision
In Miyuji ward: N=3684
e= 10% as recommended to social sciences
n=3684/1+3684(0.1)2
n= 97~100 households
Sampling procedure: Both probability and no-probability
sampling techniques was used.
Probability sampling: The method was used to obtain the
sample required by employing stratification where the population
was divided into a number of homogenous sub-population and a
sample helped the researcher to obtain 90 respondents.
Table 1: Respondent Sample Composition.
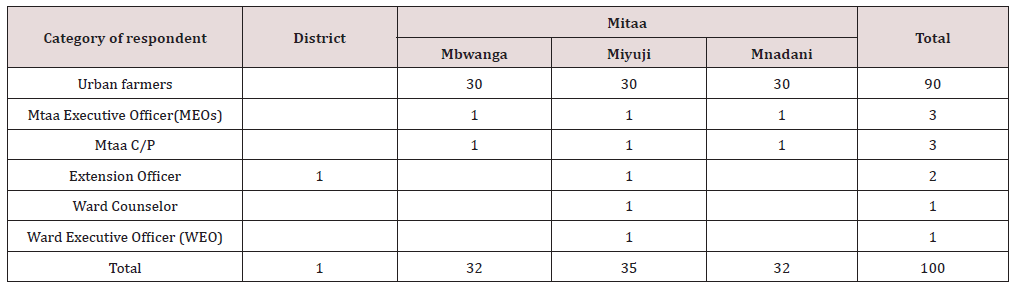
Non-probability sampling: The method was used to obtain
the sample required by employing purposive sampling technique
to select the 10 sample required to meet the objectives includes
selection of AO (Agriculture Officers), MEOs (Mitaa Executive
Officers), and WEO (Ward Executive Officer).
Data collection methods
Both primary and secondary data collection methods were
used.
Primary data: Primary data was collected by using the
following methods:
Interview: Structured questionnaire was used to enable face
to face meeting in which the interviewer asked the interviewee
questions and recorded responses. This method was used to obtain
information from different respondents.
Observations: The method was used by visiting the selected
areas to observe different things related to study such as how urban
farming is practiced.
Focused group discussion: Focused group discussion enabled
respondents to express and exchange their views on how they
practice urban farming. This group involved Mtaa C/p, Extension
officer, and few urban farmers. Group of not more than 25 people
is recommended since they will be difficult to manage [3]. Fourteen
respondents were invited to participate in focus group discussion
for Miyuji ward as follow; Ward executive officer (1), Mtaa
government chairpersons (3), Mtaa executive officer (3), Ward
agriculture extension officer (1), and prominent urban farmers (6).
Group discussions were conducted in a ward executive office where
flip charts and marker pens were available after seeking permission
from ward authorities. Questions were written on the flip chart,
and the chairman who was elected by the participants guided the
discussions by first reading the questions loudly for every member
to hear and allowed for contributions through raising a hand. The
group leader’s role also was to make sure that one person does not
dominate and influence the discussion. The researcher took notes
as well as probing questions when judged that the respondent’s
statement was ambiguous. The information collected was used to
supplement the household questionnaire.
Secondary data: Secondary data was gathered through.
Documentary review: The method was involving reading
various published and unpublished materials related with the study.
These materials include internet, books, Magazine, newspaper and
Journals.
Data Processing, analysis and presentation
Data processing: Data was processed both manually and by
computer using SPSS (Statistical package for social sciences) and
MS-Excel where the exercise involved editing questionnaires, coding,
clearing and verifying the entered data for easy interpretation.
Data Analysis: The data was analyzed manually and by the use
of SPSS Version 11.5 software. Bivariate analysis technique was
used in which the researcher examined the relationship between
two variables for example farm size and Household income by the
use of Cross- tabulation method.
Data presentation: The results from the research are
presented by using charts, tables and graphs.
Limitations of the study
Time was not enough to cover the whole ward instead only 3
streets (mitaa) were represented.
Some respondent especially key informants were reluctant to
give out the needed information as they thought that, they will be
responsible when the wrong things/issues concerned with urban
farming been recognized by the institution, however observation
and literature review overcome this difficult.
Disturbances/bureaucracy of getting permission to conduct
research in a study area.
Results and Discussion
General characteristics of the respondents
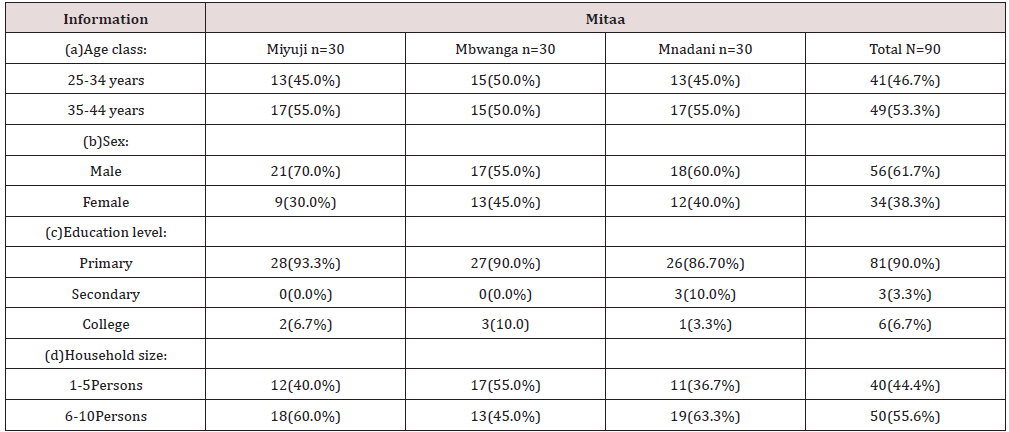
The study population comprised of males and females with
different ages, family size and education background (Table 2). Of
the household heads interviewed, 53.3% of the respondents were
between 35-44 years old and 46.7% were between 25-34 years
old. This was important because these age groups are the one who
practice urban farming; understand the historical trend of their
areas as well various indigenous technical knowledge. The study
mitaa were found to have large household sizes. Results show
that 55.6%have 6-10 persons per household and 44.4% have 1-5
persons. This is due to the behavior and culture of excluding family
plan, of which results into a lot of dependents to feed and take care
of Education background of the surveyed population is mainly
primary education (90.0%), very few had college education (6.7%),
and 3.3% had secondary education. Despite of having primary and
secondary schools but the number joining secondary schools is
small due to financial base of study population.
Table 2: General information on residents of study villages.
According to URT [4]; World Bank (2014); and Deloitte [5],
one of the signs of both income and non-income poverty in the
country is the low level of literacy and numeracy. The literacy
level in Tanzania is now estimated to be 68%, down from 90%
achieved in the 1980s. The gross enrolment rate for primary school
pupils was 77.8% in 1996, down from 90% in 1980s. the literacy
rate for youths and adults in the year 2014 was 76% and 73% for
male and female youths respectively; and 75% and 61% for male
and female adults respectively World Bank (2014).The Tanzanian
government has managed to pay teachers’ salaries and allowances
but number of teachers employed is not enough despite the efforts
made to recruit more teachers due to agenda of having at least one
secondary school in each ward and primary school in each village.
With free tuition fees in public schools, the number of girls will
be increased in schools as parents had have tendencies to choose
between boys and girls to educate before the year 2016 because of
cost sharing [6-8].
Factors affecting the performance of urban farming
practices
Water availability: Availability of water is an important
factor for urban farming practices. Miyuji ward is within semiarid
region of Dodoma where enough rainfall for urban farming
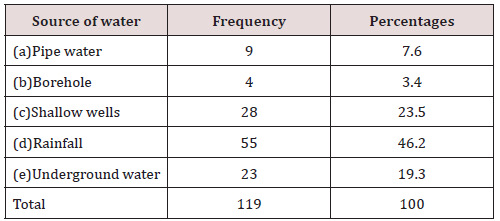
practices is a problem. The study mitaa in miyuji ward based on
multiple responses (Table 3) found to have water mostly from
rainfall (46.2%), 23.5% shallow wells, 19.3% underground water,
7.6% pipe water and 3.4% borehole. The results show that many
urban farmers in Miyuji ward prefer rain harvesting as source of
water, and due to low water table in Dodoma region, underground
water also seems to be preferred although it require some fund for
investment in it like pump machine, fuel etc.
Table 3: Main source of Water in Miyuji Ward.
Laws and by laws: The study mitaa found to have by laws that
deal with urban farming. The results Table 4 shows that 77.7% of
respondents in study mitaa understand and respect by laws present
while only 22.3% claims that they do not know if there is by laws
for making urban farming sustainable. By laws is very important
for guiding urban farming practices. The following by laws which
enforced in the study area based on multiple responses Table 5
shows that 45.3% of urban farmers responded to bylaw dealing
with protection of soil erosion by restrict quarry activities, 36%
protection of forests (cutting down of trees), 10.7% protection of
water and 8% protection of illegal farm burning. The study made
revealed that 80.4% of the urban farmers in the study area are aware with existing by-laws and its effectiveness. However, 19.6%
of urban farmers complained that the existing by-laws are not
enforced hence are not effective. It was established that 90.2% of
urban farmers want any person acting against the existing by-laws
to be penalized the rest 9.8% want any criminal to be jailed (Table
6).
Table 4: Presence of by Laws Dealing with Urban Farming.

Table 5: By laws guiding urban farming.

Table 6: Efficiency and Effectiveness of By-laws Guiding Urban Farming.
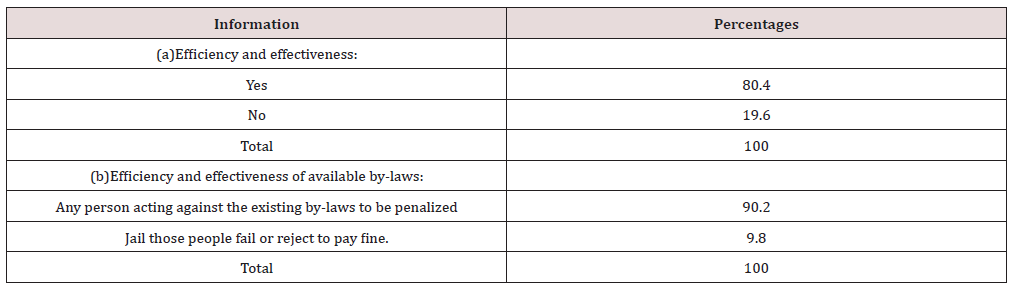
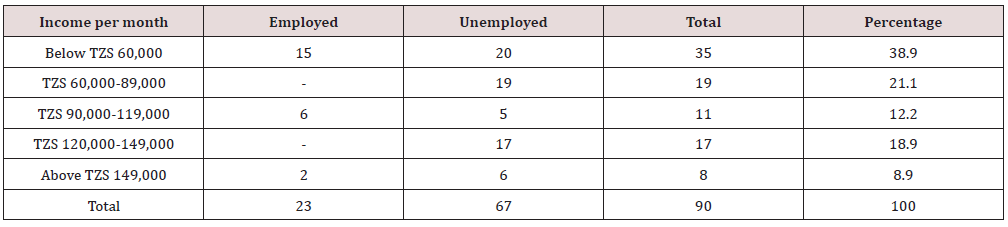
Table 7: Income level of Respondent per Month.
Capital Availability: Urban farming needs starting and
operating capital so as to harvest considerable crops per acre and
end products results from livestock and poultry. Capital helps to buy
chemicals, fertilizers and other inputs helps in farming practices
(Personal Observation). The study mitaa found to have different
income groups in which 61.1% of study population has income per
month above TZS 60,000 (Table 7). The results show that 38.9%
of the urban farmers are living in absolute income poverty for
both employed and unemployed and cannot even have power to
buy any input for farming or self-sustenance. That majority with
high income above TZS 60,000 can use the money earned to buy
different equipment. During focus group discussion it was found
that, urban farmers are not recognized in financial institutions for
providing them loans unless they form a group of five persons or
above and follow long procedures until given that loan. Also these
urban farming practices are also done by employed people so as to
raise household income, reduce income poverty and provide food
to households’ members who are large in number. Also the study found
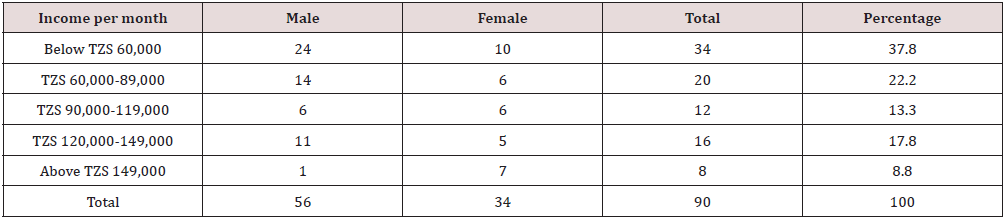
that, urban farmers in Miyuji ward are practiced by both men
and women from all income groups where by the majority of them
were from below TZS 60,000 income earners as shown in Table 8.
It was established that those urban farmers grow food crops for
security and income generation as stipulated by Nugent [9,10] and
URT [7]. In Miyuji ward women who engaged in urban agriculture
are actively participate in urban garden for home production but
also in food processing and marketing though in Miyuji ward
women are involved in small scale production as explained much
by Mouget [10] and URT [7].
Table 8: Income level of Respondent per Month interms of Sex.
Market availability: The study area found to have markets
for their products from urban farming practices. The results show
that 87.7% of study households said they have market for their
farming products. This shows that in Miyuji ward market for urban
farming products is not a serious problem what is required is to
increase crops production. Crops produced includes millet, cassava,
sorghum, sunflower, grapes, groundnuts, njugu, maize, vegetables,
tomatoes and others; while livestock keeping includes cows, goats
and pigs; and poultry which mostly includes hens (Table 9). Due to
increase of higher learning institutions in Dodoma urban, it is likely
the market to be extended and scarcity of this products resulted
from urban farming practices increase and leads to poverty
reduction to those people involved in these practices.
Table 9: Market availability of Crops, Livestock and Poultry.

Plot size and type of tools used for agriculture: The study
area found to have scarcity of land for urban farming. The results
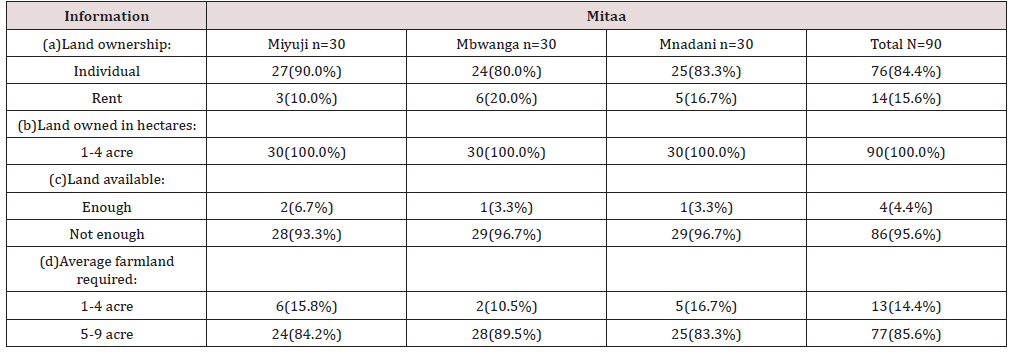
show that 84.4% of study households own land and only 15.6% rent
those lands for urban farming plots (Table 10). Also 100% of the
study area own 1-4 acres of land and within this study population
95.6% claims that land is not enough and 85.6% propose average
farmland required to be 5-9 acres and 14.4% propose to remain
1-4 hectares with maximum land size of 4 acres. Due to the use of
hand hoe (low technology) in study area for agricultural activities,
farmland shortage will continue to be a problem until the situation is
reversed. Most urban farmers claim that, though urban agriculture
is potentially viable and productive but not a panacea to solve the
most severe problems of food security in Miyuji ward as explained
also much by Nugent [9] and Mboganie [11].
Table 10: Market availability of Crops, Livestock and Poultry.
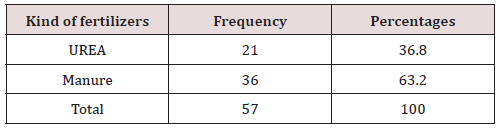
Use of fertilizers: The made in the study area found to have
high fertilizers users. The results show that 63.3% use fertilizers
and 36.7% are not using fertilizers (Table 11). This shows that
disparities of income groups are the determinant for using
fertilizers as those urban farmers with high income group are the
one with ability to buy fertilizers. Also those practice either livestock
keeping and agricultural or poultry keeping and agriculture can use
manure type of fertilizer which is not costly [12]. Kinds of fertilizers
used are shown in Table 12. The increase in fertilizer prices and
reduction in credit have hit urban farmers harder because they are
on poorer land which needs more of fertilizer which they are less
able to afford. This has resulted in increasing cultivation of marginal
areas with associated deforestation and erosion problems.
Table 11: Fertilizers Usage in Farming.
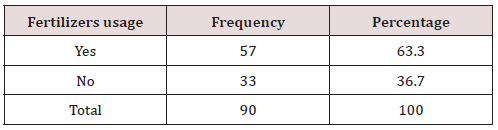
Table 12: Kind of Fertilizers Used.
Contribution of urban farming on income poverty reduction
Activities of urban farming: The study made found to have
high number of household using rain fed farming as their main
source of water for urban farming [13]. Results shows that, 56.7%
use rain harvesting only 9.3% and 4.1% use pipe water and borehole
respectively (Figure 3). This shows that those use pipe water from
DUWASA are the one who cultivate leafy vegetables includes
chinese, beans, sweet potatoes leaves, cassava leaves and non-leafy
vegetable includes tomato, cucumber and carrot; and cultivate
both vegetable and fruits includes orange, grapes and pawpaw.
The common crops grown by both groups of different main water
sources includes millet (23.6%), sunflower (23.2%), sorghum
(21.4%), maize (14.5%), groundnuts (7.7%), cassava (5%), and
njugu (4.5%)(Table 13). Also livestock kept includes cows (28.1%),
goats (6.3%) and poultry (hens) (65.6%) (Table 14). These crops
grown and livestock kept are both for subsistence use in families
and business to increase income of household whereby keeping
hens found to be done by large number of households in study area.
The study found that, men in Miyuji ward dominate commercial
urban food production such as sunflower and groundnuts and
selling of livestock kept. Most of women earn/control the money
from milk and eggs selling. The study also revealed that children
were involved in urban farming activities through weeding and
watering. Involving children is contrary to child labour rights [14].
Figure 3: Source of Water in Miyuji Ward.
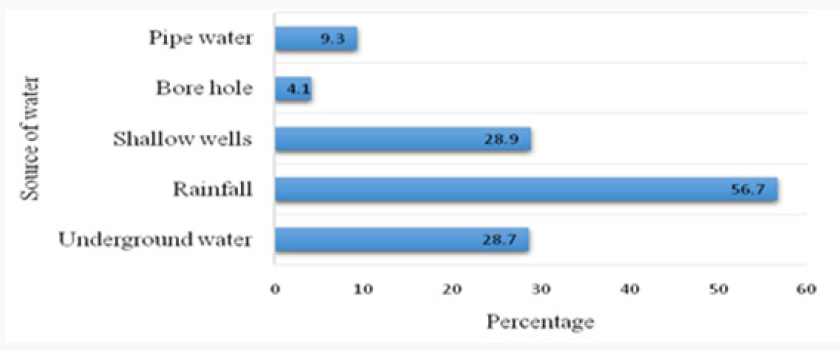
Table 13: Crops grown kept in Miyuji Ward.
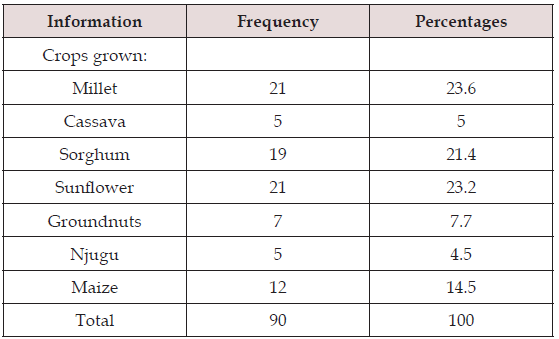
Table 14: Livestock kept in Miyuji Ward.
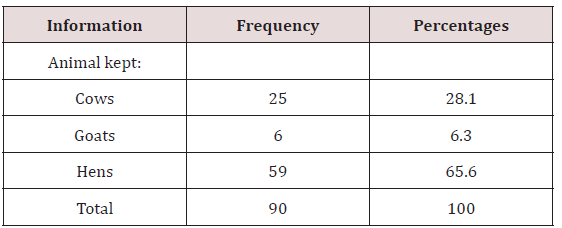
Table 15: Crops production per acre.
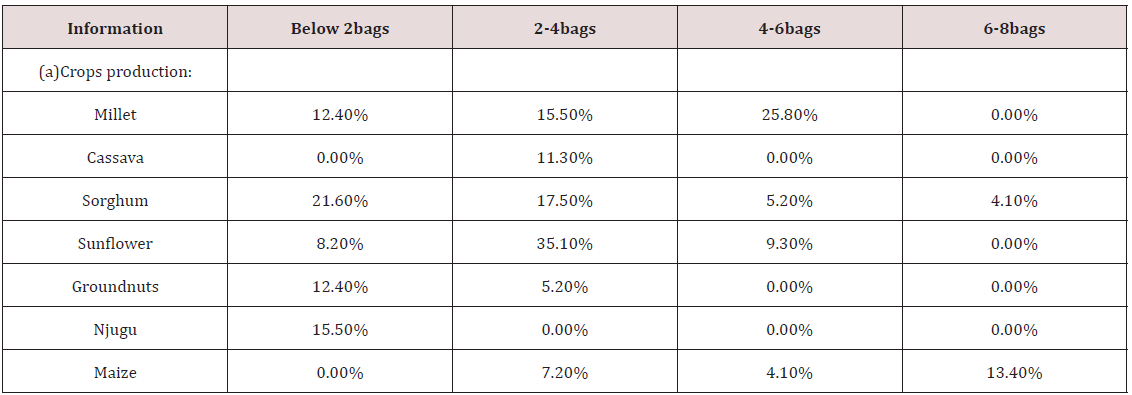
Amount produced and sold and price of products: The study
population found to have medium production of urban farming
products [15]. Crops production per acre as shown in Table 15
below shows that, 35.1% produce 2-4 bags per acre of sunflower,
21.6% below 2bags of sorghum, 25.8% produce 4-6 bags of millet
per acre, 13.4% produce 6-8 bags per acre of Maize, Njugu 15.5%
produce below 2bags per acre, 11.3% produce 2-4bags of cassava
per acre, and 12.4% produce Groundnuts below 2bags per acre.
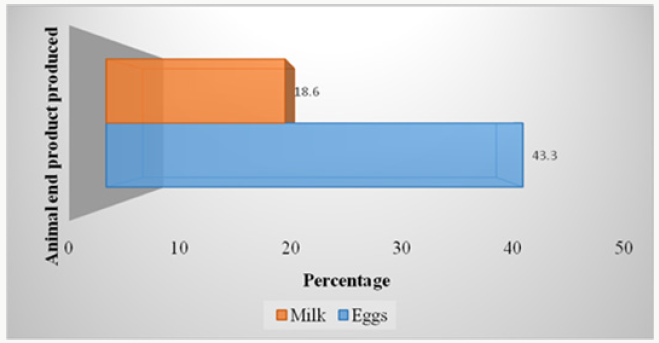
Animal production based on end products shows (Figure 4) that,
43.3% produce hens’ eggs and 18.6% produce milk During focus
group discussion, it was shown that, urban farmers of Miyuji
ward use products obtained for home use and business whereby
most of them sell all products in order to get income for covering
some expenses for example paying fees for their children, health
issues, water bills and all other household necessities needed
rather than priotised using crops produced to solve the problem of
food insecurity. Market availability for products produced is not a
problem in a study area [16]. Results in Figure 4 shows that 88% of
the respondents in study area have market for their products and
only 12% have no market. This shows that as population increase in
Dodoma urban then demands for urban farming products increases,
therefore production should be increased in order sustain the
available population.
Figure 4: Animal end product produced.
When the researcher interviewed households, it was found that,
price of crops products varies depending on demand especially
during parliamentary meetings and higher learning students’
institutions studying semester’s periods. Animal products includes
milk and eggs found to have constant price of TZS 1000 per liter
and TZS 500 per egg while the price of cow and chicken are subject
to change ranging from TZS 300.000 to 600,000 depending on size
and specie of cow, while chicken range from TZS7000 to 15,000.
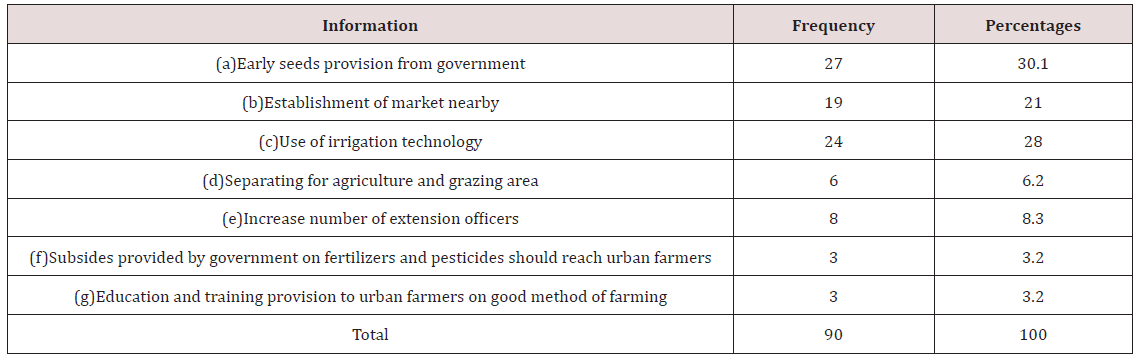
In order this farming practices to be improved so as to increase
production, the study households suggested as shown in Table
16. 30.1% said if they can be supplied by early seeds provision,
adopt irrigation technology (28%), establishment of market
nearby, increase number of extension officers (8.3%), separating
agriculture and livestock area (6.2%), education and training
provision to urban farmers on good method of agriculture (3.2%)
and Subsides provided on fertilizers and pesticides to reach
urban farmers (3.2%) tgether with financial support from Banks
and Credit agencies [17], altogether can improve urban farming
practices and more urban dwellers can engage themselves as
explained much by Nelson, 1996.
Table 16: Suggestion given by urban farmers on the improvement of their farming practices.
Effects of urban farming on the environment
Chemicals used and cow dung disposal: The study found that
urban farmers have low usage of chemicals in farming practices.
Results shows that, 71.7% do not use any insecticides or pesticides
in crops production and only 28.3% use insecticides and pesticides
for the crops production (Figure 5). This shows that farming
products produced in Miyuji ward have little concentration of
chemicals which can have negative effect to human being. However,
during interview with ward agricultural officer, it was shown that
sometimes aerial sprays to kill “koleakolea” have been done in
the area few years ago. Also during focus group discussion, it was
revealed that cow dung disposal in farm plots make them to increase
nutrients as a results production per acre increase compared to
plots without any fertilizer. Additionally, it was found that cow dung
can be used for production of bio-gas which is alternative source of
energy rather than concentrating using fuel wood and charcoal as
the main source of energy in study area.
Figure 5: Market availability for crops and animals products.
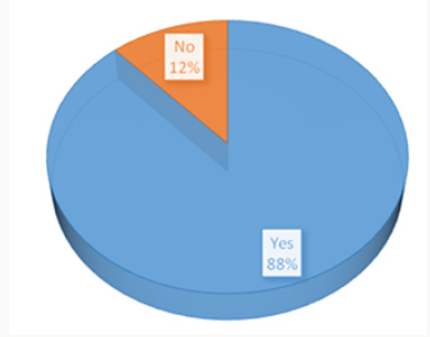
Figure 6: Insecticides/Pesticides usage in farms.
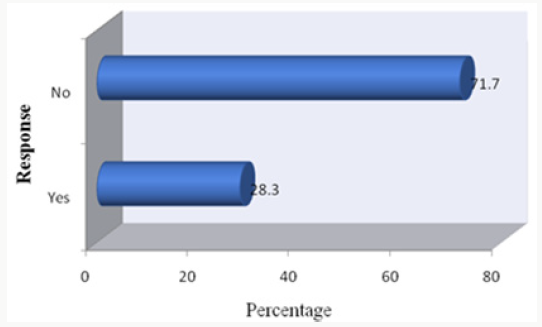
Figure 7: Land Degradation Resulted From Urban Farming Practices.
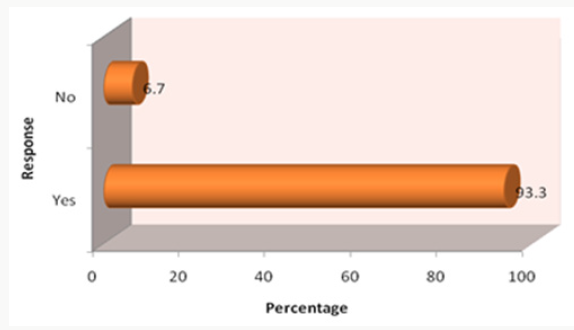
The study area found to have land degradation resulted from
urban farming practices. Results shows that 93.3% of study
households experienced land degradation resulted from urban
farming practices and only 6.7% do not experience it. This shows
that poor farming practices present in the area, so the duty of
extension officers to reverse the situation will be appreciated
(Figure 6). Land degradation is among of the effects on urban
farming which experienced in the study area [18]. Types of land
degradation experienced are shown in Table 17. Also it shows that
this land degradation decreasing. Results from observation and
household questionnaire shows that, 92.9% of study households
have seen this degradation as decreasing and only 7.1% responding
to increasing land degradation (Figure 7). This shows that presence
of extension officers helps to conservation of environment by
teaching community proper way of practicing urban faming. Major
reasons for increasing and decreasing land degradation are shown
in Table 18.
Table 17: Types of Land Degradation experienced in study area.

Table 18: Major Reasons for Increasing and Decreasing Land degradation.
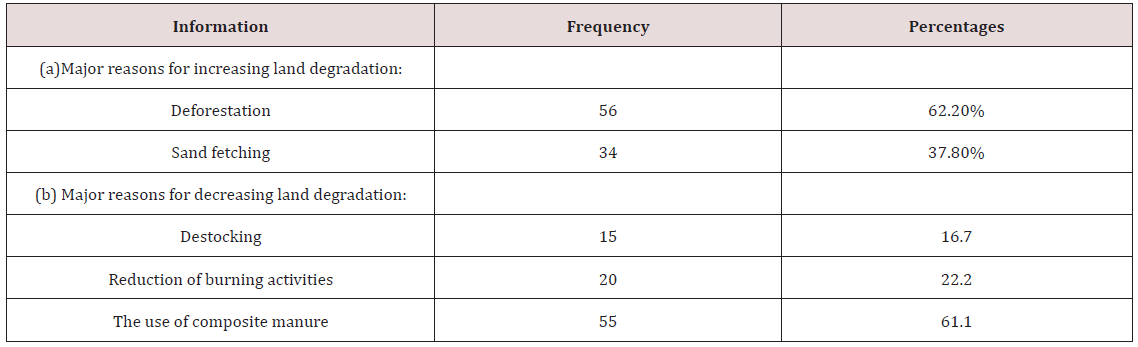
Figure 8: Status of Land Degradation.
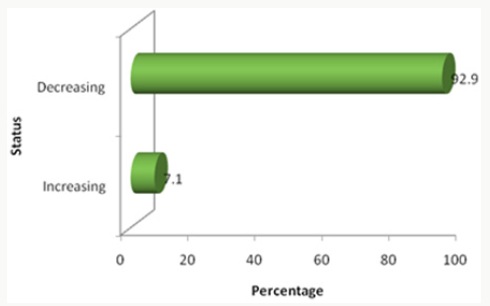
Figure 9: Tree planting.
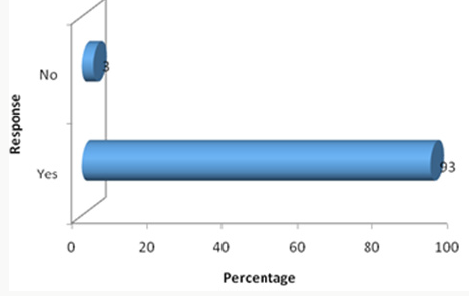
Table 19: Purpose of growing trees in study area.
Planting trees: Planting trees is a positive strategy towards
environmental in many areas of the world, and collaborative
measures whereby, all community together practice this
tree planting for the benefit of extracting carbon dioxide gas
concentration resulted from daily productive activities Smit and
Nasr, 1997. The study found that 93% of respondents in study
area planted trees and only 7% did not plant trees (Figures 8 & 9).
This shows that indigenous technical knowledge and NGOs play
a good role in providing conservation education and importance
of growing trees for the benefit of urban farming practices. The
study population found to have behavior of planting trees for
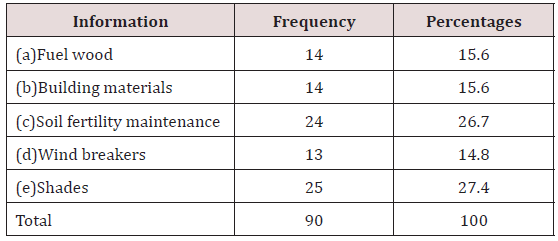
shades rather than combating fuel wood shortage. Results shows
that 27.4% of planted trees are meant for shades, 26.7% for soil
fertility maintenance, 15.6% for fuel wood and building materials
respectively, and 14.8% for wind breakers (Table 19). Also the study
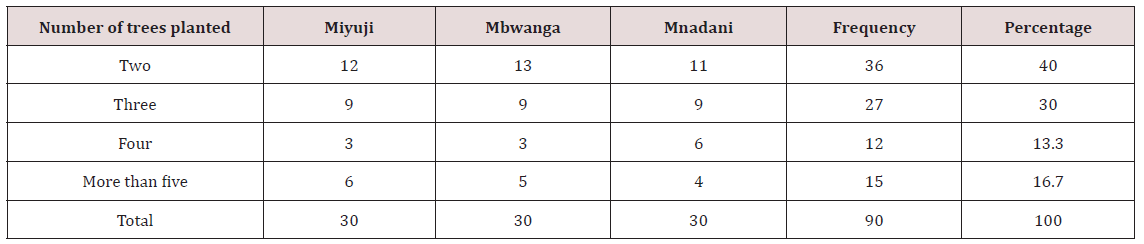
revealed that in Miyuji ward have high populations who plant few
trees per year. Results in Table 20 shows that 40% of respondents
planted two trees per year and 60% plant more than two trees per
year. This implies that, as times goes on and those trees planted
being protected then in few years to come Miyuji ward can have
large amount of tree.
Table 20: Number of Trees Planted Per Year.
Conclusion and Recommendations
Conclusion
Generally, urban farming practices contribute much to reduce
income poverty in Dodoma Municipal especially in Miyuji ward.
Based on analyzed data most of respondents are in a position of
improving their living standard and getting their basic human
needs due to involvement in urban farming practices though there
are some factors which observed to hinder urban farming practices
in the study area such as inadequate water, inefficiency laws and by
laws which govern urban farming practices, lack of enough capital,
small plot size, low technology and lack of nearby market to sell
their crops and livestock products.
Recommendations
Urban farming practices is a new employment opportunity to
urban dwellers as the study shows it increase income to households,
fight food insecurity, provide room for environmental conservation
through planting trees and adopting proper way of farming and
other benefits associated with urban farming. In order this sector
to be improved and increase production, the following issues found
in the study area must be taken into account:
Early seed provision from the government and non-government
organization can help to improve urban farming practices in Miyuji
ward. This can be facilitated by ward agricultural extension officer.
Improvements of irrigation method can help to improve urban
farming practices rather than depends much on tap and rain
harvest water. Urban farmers, extension officers and government
are in position to incorporate in order to reach consensus.
Regular education to the urban farmers from urban farmers’
expertise can help to increase the crop and livestock yield hence
poverty reduction to the urban farmers.
The village government must ensure implementation of existing
laws and by laws governing urban farming practices which help
to conserve the environment so as to be conducive for practicing
urban farming.
Town planners should plan an alternative area for urban
farming practices to suit the urban farmers as their areas are too
small as compared to the size of their family.
Read More About Lupine Publishers Journal of Agriculture Please Click on Below Link:
https://lupinepublishers-agriculturalsciences.blogspot.com/