Showing posts with label Open Journal of Civil Engineering. Show all posts

Friday, 13 December 2019

Lupine Publishers | Utilitarian Value of Selected Mechanical Strength Tests for A Lightweight Floor Construction with A Heating Coil

Lupine Publishers- Trends in Civil Engineering and its Architecture


Abstract


This method of Lightweight floor construction does not require the use of heavy concrete screeds. It consists of a layer of hard thermal insulation on which the tile flooring is directly mounted, usingan adhesive mortar reinforced with a glass fiber mesh. This article summarizes the current results of the strength tests of this radiator model with XPS thermal insulation for bending, compression and point compression with a variety of constructional models. Application in all tests of various types and structures of insulating panels, with the use of glass fiber mesh and without it, allowed us to check and compare the most important strength parameters with different variants. At the same time, the principle of accepting materials that produce results guaranteeing the quality, durability and optimal price of the lightweight floor model with the use of a heating coil was followed.
Keywords: Compressive strength; Bending strength; Lightweight radiant heater; Cement adhesive

Introduction

In 2016 experimental studies on heat flux density and thermal inertia of light radiant heaters, described in [1] and [2], were completed. At the turn of 2016/2017, static shear strength, peel force, pull-off strength, shearing tests, absorbability and frost resistance tests were carried out on insulated EPS polystyrene insulation boards and extruded waffle type XPS with dissipating elements, using polyurethane adhesive [3]. This article describes compressive and bending strength in construction consisting of porcelain tiles, mounted to thermal insulation EPS or XPS through cement adhesive C2S1, both with and without the use of embedded glass fiber mesh. The latest tests on the strength of this radiator heater with XPS thermal insulation for bending, compression and point compression, with or without a glass fiber mesh, and with the use of PE/RT/Al/PE/RT PVC heating pipe with a diameter of 16x2mm, or without it, was made at the Białystok University of Technology.

Description of the measurement stand and research methodology

The tests were carried out in the laboratory at the Białystok University of Technology. The research included bending strength, compression and point compression of samples in different variants, using the XPS300 insulating board, a Synthos waffle. Bending strength was tested on the model of the size 45mm(width) x300mm(length) x 50mm(height) with tile, and dimensions 45mm(width)x300mm(length) x42mm(height) without tiles. For bending, we used steel support set with surface 40x45mm and axial spacing of 220mm, and steel pressing stamp of 35 x 47mm, all for 10 models. The first five models were tested with a glass fiber mesh 335 g/m2, embedded in the cement mortar as follow:
1. XPS300 with pipe / Sika Ceram 255 / tile,
2. XPS300 only / Sika Ceram 255 / tile,
3. XPS300 with a groove without pipe / Sika Ceram 255 / tile,
4. XPS300 with pipe / Sika Ceram 255 / no tile,
5. XPS300 only / Sika Ceram 255 / no tile,
The same systems as above were tested but without the use of a mesh.
Compressive strength and point compression were tested on a model with dimension 80mm (width) x 100mm (length) x 50mm (height) with tile and 80mm (width) x 100mm (length) x 42mm (height) without tiles, using speed pressure of 4mm / minute. In the compression test, a pressing and supporting steel stamp with a circular surface larger than the surface of the samples was used, and in the point compression test 20x20mm steel stamp was used. The following sample models were tested:
1. XPS Synthos 300 / Sika Ceram 255 with a mesh of 335g/ m2/ tile
2. XPS Synthos 300 / Sika Ceram 255 without a mesh of 335g/m2 / tile
3. XPS Synthos 300 / Sika Ceram 255 with a mesh of 335g/ m2 /no tile
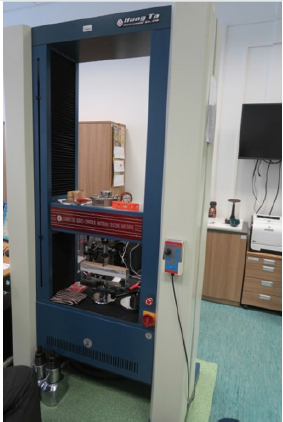
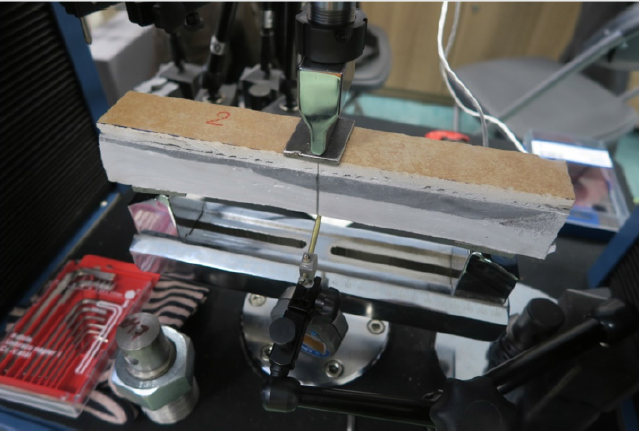
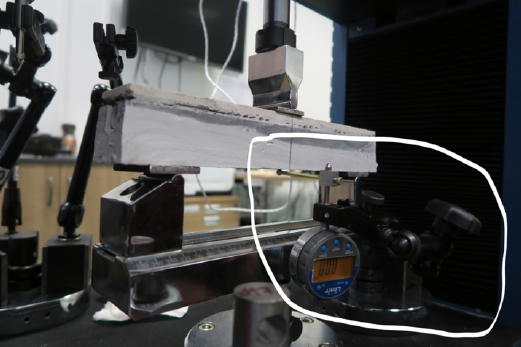
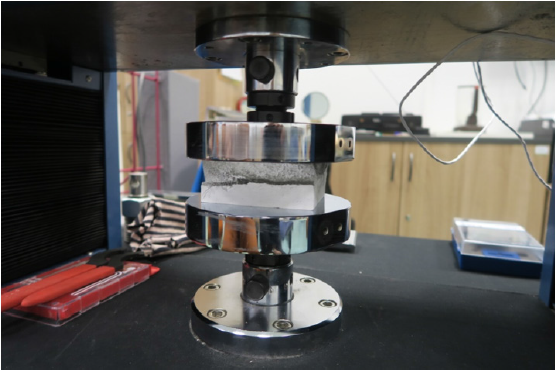
The test stand and tooling are shown in Figure 1-4.
Figure 1: Measuring stand of Hung Ta Instrument Co. Ltd to test the bending and compression strength.
Lupinepublishers-openaccess-journals-Civil-engineering-Architechture
Figure 2: Tooling to measure bending strength.
Lupinepublishers-openaccess-journals-Civil-engineering-Architechture
Figure 3: Digital indicator for measurement of bending Limit Company (marked in the border).
Lupinepublishers-openaccess-journals-Civil-engineering-Architechture
Figure 4: Tooling for measuring compressive strength.
Lupinepublishers-openaccess-journals-Civil-engineering-Architechture

Measurements

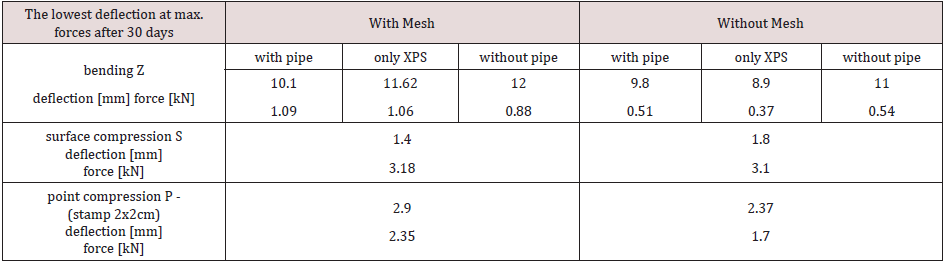
Maximum stresses causing destruction of samples and their smallest deflections when testing bending strength Z, compression S and point compression P of a radiant heating model, made of thermal insulation from waffles XPS, according to the construction described in item 2 of this article, is shown in Table 1. Value the Z, S and P strengths of the lightweight floor with the tiles are given under operating conditions (30 days from sample preparation).
Table 1: Results of bending, surface, and point compression tests of a lightweight floor made on XPS insulation.
Lupinepublishers-openaccess-journals-Civil-engineering-Architechture

Analysis of Results

This article closes the cycle of basic tests of mechanical strength over the so-called light-radiant heater in which no type of screed occurs. The aim of the experiments was to determine the possibility of installing this heater in accordance with Article 5.1 of the Construction Polish Law [4]. The model of this radiant heater consists of a thermal insulation layer with grooves in which heating pipes are placed. A coil is inserted into the grooves, and all floor surface is covered with a cement adhesive in a system without metal diffusion plates or polyurethane glue with these metal plates. Adhesives, and their reinforcement in the form of fiberglass mesh, were adopted, which according to the technical description of manufacturers can be used in such radiant heaters on difficult substrates.
Various lightweight heater designs were investigated, using a hard, easy to process thermal insulation with a minimum compressive stress of 200kPa (EPS) and 300kPa (XPS), with a bending strength of minimum 250kPa (EPS) and 300kPa (XPS), according to the Declaration of Properties Utility given by manufacturers and adequately guaranteed standards [5] and [6]. To reinforce the cement adhesive layer, a glass fiber mesh was used on which the most popular type of flooring - tile (stone) was laid. We can use it with underfloor heating or possibly a wall covering in wet rooms. This article summarizes new experiments that were carried out on samples of the entire heating model during bending, surface compression and point compression (puncture), in accordance with the construction described in point. 2., under operating conditions.
The maximum bending force resulting in the destruction of the model with the mesh was on average about 1.1kN, and without it about 0.48kN in different variants - with a mounted coil, without it or with an empty groove. At the same time, this gives a result at least two times better for the radiator construction with mesh reinforcement. The use of a mesh is not so important in compressive strength tests and puncture. The maximum compressive force was 3kN on average, regardless of whether the radiator was reinforced with mesh or not, while the puncture force in the structure with the mesh was on average 3kN, and without it 2.33kN.
Destruction of the samples during the bending strength test occurred at the lowest deflection (elongation) of 10.1mm (sample with mesh) and 8.9mm (sample without mesh) with the axial spacing of supports 220mm. According to the standard [7] for concrete structures calculation of deflections are not necessary if the deflection arrow of a beam, plate or bracket under load exceeds 1/250 of the span. In the previous Polish standard [8] for beams, slabs and flat roofs, the limit values of deflections could not exceed l/200 or 30mm with the construction spans 6-7,5m. In accordance with the above standards, the deflections of the main building structures referring to the tested samples in which the spacing of supports was 220mm can be maximum 220mm/250 = 0.9mm or 220mm/200 = 1.1mm. Deflections in the tests amounted to at least 10 times more, from 9mm to even 32mm. In the case of wooden structures described in the standard [9], the limit deflection arrow is the higest for beams based on 2 supports - l/150 or for the bracket - l/75, including the inverse deflection. It follows that the maximum deflections in relation to our samples can be 220mm/150 = 1.47mm or 220mm/75 = 2.93mm. It is still 3 times lower than the results achieved in the tested samples from 8.9mm upwards. This means that the construction of the light floor is very flexible and is able to bending more, without cracks than all acceptable standard deflections in both, concrete and wooden structures.
The maximum compressive force was not less than 2.6kN, and its average value in operating conditions after 30 days was 3.1kN. This gives us, per m2, a strength of not less than 325kN/m2. At very high compressive force, the samples of the lightweight radiant heater were not destroyed, they were subject only to progressive flattening (deflection). This means there is great resistance of such a radiant heater to any variable payloads found in construction works, including those subjected to dynamic loads. The tested values confirm the compression strength of XPS 300 insulation boards, declared by manufacturers, amounting ≥300kN/m2, in accordance with the standard [6]. This result is very high when we want to compare it to what is projected on the basis of the standard [10]. Utilitarian loads for the rooms, bedrooms of residential buildings and waiting rooms in hospitals, bedrooms in hotels, kitchens and toilets, are only 2kN/m2, or rooms with tables (in schools, cafes, restaurants, canteens, reading rooms, receptions, waiting rooms) 3kN/m2, and the maximum included in this standard with the area generally accessible to the crowd (in public buildings, concert halls, sports halls with stands, terraces, access points and railway platforms) amount to 7.5kN/m2. The maximum tested force under point compression with an area pressure of 4cm2 imitating the legs of a chair or table using a glass fiber mesh was not less than 2.9kN.

Conclusion

The bending strength of a radiant heater without screeds is made higher by using cement adhesives with a glass fiber mesh. As already pointed out in an earlier article [11], the cost of the fiber mesh does not have a significant impact on the price of the entire lightweight radiant heater.
The lightweight, not require screed floor is flexible enough to meet the standard requirements regarding the serviceability limit state at the deflections of concrete structures and wooden structures. It can be dedicated to all types of construction objects, both residential and sacral, sports, and other public utilities, and in industrial buildings with storage and production areas, depending on the loads determined to take into account the intended use and equipment installed. In the case when it can be expected that resonance effects will occur as a result of synchronous, rhythmic movement of people (eg dances, jumps), it is recommended that the calculation model be determined on the basis of a special dynamic analysis contained in [10].
Assuming placing on the floor a table with 4 legs, each with an area of 4cm2, the tested heater is able to transfer the maximum load of over 11kN. During work, when the floor is not yet laid, the maximum point load on the surface of 4cm2 should not exceed 1kN. Under normal conditions of use, there are no such heavy loads.
This article closes the cycle of basic strength tests of a light, thin radiant heater without screeds, and confirms the possibility of its use in all construction objects. I suggest adding to the current experiments new adhesion tests of type C2S2 cement adhesive, with 2 times greater deformability. This will allow a comparison with the results of the tested polyurethane adhesive strength, and give an answer to the question of whether it will be possible to use it outside of buildings, in snow and ice protection systems.

Acknowlegement

The author of the article would like to thank Mrs. Anna Zakowicz and Mr. Tadeusz Chyzy from the Bialystok University of Technology for providing laboratories.


https://lupinepublishers.com/civil-engineering-journal/pdf/TCEIA.MS.ID.000166.pdf

For more Lupine Publishers Open Access Journals Please visit our website:
For more Trends in Civil Engineering and its Architecture articles Please Click Here:
To Know More About Open Access Publishers Please Click on Lupine Publishers


Friday, 15 November 2019

Lupine Publishers| Waste to Worth - Sludge Containing Calcium Carbonate into Useful Building Materials - an Indian Context

Lupine Publishers- Trends in Civil Engineering and its Architecture


Opinion

Human activities on earth produce in considerable quantities of wastes more than 2,500 million tons per year, including industrial and agricultural wastes from rural and urban societies. This creates serious problems to the environment, health and also the land filling. Now a day the concrete and bricks are most used man made materials in the world. The Indian construction industry alone consumes approximately 400 million tons of concrete every year and the relative amount of bricks too. Therefore the demand of the concrete, bricks and the required raw materials are very high. This causes the hike in the costs and demand of cement, bricks fine and coarse aggregates. Environmental degradation, high energy consumption and financial constraints has forced various organizations in India and abroad to recommend various qualitative guidelines for generation, treatment, handling, transport, disposal and recycling of non-hazardous and hazardous wastes. On the other side due to exponential growth of population in recent years, there is great demand for construction and thus increasing pressure for use of natural resources causing their acute shortage. There is environmental problem due excessive use of topsoil in brick manufacturing. 


Natural materials being exhaustible in nature, its quantity is declining gradually. Also, cost of extracting good quality of natural material is increasing. Concerned about this, the scientists are looking for alternative materials for construction, and industrial waste product is one such category. If these materials can be suitably utilized in construction, the pollution and disposal problems can be partly reduced. It is now a global concern, to find a social, techno-economic, environmental friendly solution to sustain a cleaner and greener environment. In recent years, the utilization of solid waste is the challenge for the civil and environmental engineers to utilize economic friendly supplementary cementitious materials produced at reasonable cost with the low possible environmental impact. Some of the researchers successfully tested and used industrial wastes such as blast furnace slag, fly ash etc. which offers benefits like potential savings in natural resources and energy, reduction in impact of CO2 emission, and re-use of wastes which otherwise would have been used as landfill and might require a waste management program. The Industrial systems are linear systems taking in raw material and giving out products and wastes. In their effort to minimize negative impact on environment, industries have been traditionally collecting and treating the wastes before disposal. 

This approach i.e. end-of-pipe approach, to wastes has been resulting in the removal of pollutants from one medium and placing in some other medium rather than ending the cycle of wastes, leading to the wasteful spending of resources. Further waste management by this approach is proving to be a burden on the industry. The magnitudes of limitations associated with end-ofpipe approach have recently been forcing the industries to examine this approach critically and adopt an alternative waste handling approach. Waste handling approach is leading to environment friendly technology and processes. It integrates both waste reduction approach and end-of-pipe treatment approach. In India around 1000 million tonnes of solid waste is being generated annually as by-products during industrial, mining, municipal, agricultural, and other processes. Out of this about 300 million tonnes is inorganic waste-nonhazardous and hazardous. Industrialization in India has no doubt helped in economic growth of our country but at the same time it also increases the pollution problem manifold. Environmental conservation is an indisputable industrial responsibility, and market competitiveness has demanded proactive and concrete actions from industry to preserve the environment. This demand promotes the minimisation of environmental impacts through the use of clean technologies that minimise waste generation and maximise reuse. The use of such technologies leads to the utilisation of wastes, energy savings and other gains. 

Lot of studies have been done for utilisation of this waste specific to the properties of the waste as building materials. To build sustainable environment and to meet the demand of construction material it is very important to find the link between waste generating industries and construction industry. Our toothpaste industry sector is presently facing the problems of safe disposal of solid waste. The very feature of toothpaste industry waste is that it contains CaCo3 in abundance; attracts the attentions of Civil Engineers. The author has developed a technology for utilizing waste from toothpaste industry as an alternative to virgin materials and building products. It is very much possible to manufacture good quality of clay bricks, concrete and hard grade bitumen by blending some amount of this sludge, thus solving issue of waste disposal and producing a low cost environmental friendly building material.

For more Lupine Publishers Open Access Journals Please visit our website:
To Know More About Open Access Publishers Please Click on Lupine Publishers


Follow on Twitter   :  https://twitter.com/lupine_online

Wednesday, 7 August 2019

Estimating Traffic Volume to Identify the Level of Service in Major Intersections of Rajshahi, Bangladesh | Lupine Publishers
Open Journal of Civil Engineering | Lupine Publishers
 

Abstract

The increment of vehicles due to the proportional increment of populations and a rapid development of modern society is a major concern in Metropolitan cities in developing countries like Bangladesh. So, it is imperative to monitor traffic volume as well as the quality of transport supply termed as the Level of Service (LOS). The present study is an investigation of the behavior of mixed traffic flow in Rajshahi city of Bangladesh. Field Traffic volume survey was carried out to determine the level of service at 3 major Unsignalized intersections in Rajshahi city corporation (RCC). Level of service (LOS) was determined by volume capacity ratio and peak hour factor (PHF) method. Nature of traffic flow in Rajshahi city is heterogeneous. So, this heterogeneous or mixed traffic are simplified by Passenger car unit (PCU). Then estimated PCU was used to determine LOS. LOS was calculated for both directions of roads. Auto rickshaw, easy bike and Rickshaw are the dominant vehicles in Monicottor, Vodra, and Laxmipur intersection. According to PHF method and V/C ratio method, LOS of Monicottor intersection is very unstable and worst. At Vodra intersection which consists of three legs, Talaimari to Vodra lane contains highest traffic volume at evening peak and the LOS of Vodra to Padma Residentail area is very worst in nature after analyzing both V/C ratio and PHF method. Considering and evaluating all the findings it can be recommended that Restriction for truck movement in daytime should be applied in Monicottor intersection and width of Monicottor to Sondighir mor and Vodra to Padma residential area road need to be increased to make the traffic flow suitable. Also, incorporation of an effective traffic signal, traffic rules and regulation should be applied and maintained properly in the worst condition intersection to accelerate the traffic flow in RCC area.
Keywords: Passenger Car Unit; Level of service; Traffic Volume; peak hour factor; Intersection; Rajshahi
Abbreviations: LOS: Level of Service; RCC: Rajshahi city corporation; PHF: peak hour factor; PCU: Passenger car unit

Introduction

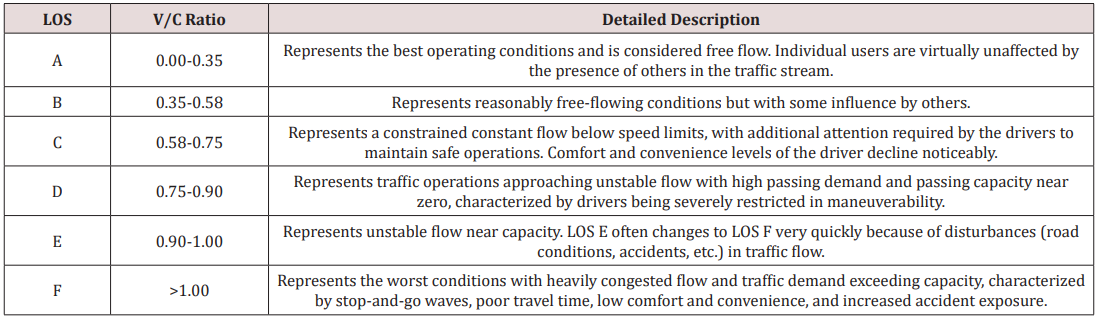
For the economic development, good transportation system is very important [1-3]. In transportation engineering traffic volume study is a baseline. Engineering operations and management are successfully completed by using it [4]. Traffic Volume survey plays a significant role to determine the existing condition and to forecast the future condition of traffic volume [5]. The road traffic in developing countries like Bangladesh are highly heterogeneous comprising of the traffic of different static and dynamic characteristics [6,7]. Again, Traffic volume data is very important as it is used to estimate capacity of a road and level of service of that given road under the combination of traffic at any hour of a day [8,9]. LOS of a traffic facility defines as a concept used to determine the performance and quality of traffic service to a given flow rate [10]. Levels of service are defined as six categories from A to F and category. A represents best operating condition on the other hand F represents the worst [11].
In Rajshahi city, the increment of traffic volume and congestions are two quickly developing problems. Nowadays, it is common to see traffic congestions at intersections at peak hours in the morning and evening. According to a report, traffic volume is increasing in last few decades and was 19397 in 2015 with annual growth rate 6.1% in this city [12]. This may be due to Poor road planning and sub-standard geometric conditions of selected intersections [13]. Intersections become very congested if traffic volume are high, make inefficiency as a result peoples suffer delay and frustration [14]. A rapid escalation in the number of motor vehicles, greater availability of used vehicles, the relative reduction in prices result traffic congestions [15]. Due to traffic congestion, air pollution, fuel usage, and travel time [16,17]. Therefore, it is a significant issue to investigate traffic volume and to monitor the quality of transport supply in terms of level of service for major intersections of Rajshahi city corporation (RCC). Traffic volume count of this study will be helpful for planning, accident analysis [18], design and operation, for roadway of Rajshahi city [19] as well as future traffic demand forecasting.
To estimate traffic volume at selected intersections, a case study was made at 4 major intersections during morning (8am10am), noon (12pm-2pm) and evening (4pm-6pm). To analyze mixed or heterogeneous traffic, a simplification is developed by (add authors name) to convert the different types of vehicles into equivalent number of passenger cars named Passenger car unit or PCU [6]. Finally estimated PCU value are used to determine LOS on three or four legs divided intersections. Level of service (LOS) was determined by volume capacity ratio and peak hour factor method.

Literature Review

LOS is very effective approach to identify the existing traffic condition of any intersection. Numerous studies have been conducted by different researchers in which they describe the procedure about how to calculate the LOS using various methods.

Related Works in Foreign Countries

A concept was first developed in 1965 for highway named highway capacity manual (HCM) to define level of service and classify it by a range from A to F for highway [20]. It is very important to analyze the traffic performance for design, maintenance, rehabilitation, and planning of roads. Performance evaluation of traffic in a highway is expressed by a term Level of service. It is a method which can explain traffic conditions for an existing or proposed transportation facility operating based upon current or projected traffic demand [21]. Capacity and level of service are analyzed to get the delay of the analyzed facilities. This Analysis is two types. One is empirical, another is analytical. The empirical model is established on the basis of regression analysis on the other hand the analytical model is based on the gap-acceptance theory [22]. An attempt is made by Ankit N Mahidadiya and Prof. Jayesh Juremalani to estimate passenger Car unit (PCU) in an urban intersection [23]. A study was made in malaysia by jamil et al. using aaSIDRA (full abbreviate of aaSIDRA) intersection version 5.1 software to analyze capacity, level of service at unsignalized intersection. Main purpose was to analyze factors affecting level of service at a junction [24]. Rao et al. followed HCM (highway capacity manual) 2000 to evaluate the capacity, control delay and Level of service of vehicular streams and traffic parameters were abstracted by the videography for 3 uncontrolled intersections in India [25]. Mithun Mohan and Satish Chandra proposed three methods for the estimation of PCU at UI under highly heterogeneous traffic conditions. First one is PCU based on occupancy time, second one is PCU based on potential capacity, and last one is PCU based on queue clearance rate [26].

Related Works in Bangladesh

Several research programs have been developed in foreign countries, but very limited studies have been made in this selected topic in Bangladesh. A case study like physical feature s survey, delay time survey, parking survey, traffic volume survey was done to find out the condition of traffic and transportation at Central Business Area of Rangpur city [27]. A study was developed by chisty, islam and mishuk to identify the existing level of service of agrabad to CEPZ Road in Chittagong city. To calculate LOS, a traffic survey was carried out to determine traffic volume, capacity, and speed of that existing road [28].

Related Works in Study Area

During the literature review, there are no studies were found about estimation of traffic volume at intersections to calculate level of service at intersections in Rajshahi city.

Materials and Methods

Description of Study Area

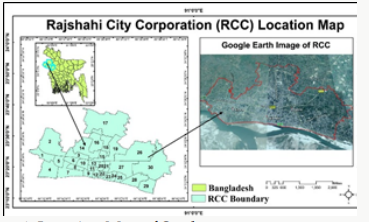
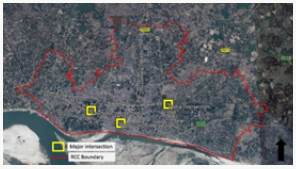
Rajshahi is a metropolitan city in Bangladesh and a major urban, commercial and educational Centre of North Bengal [29]. The study is carried out in Rajshahi City Corporation, located in Northwest part of Bangladesh. There are 4 thanas (Administrative Unit) in Rajshahi City Corporation which include 30 wards Figure 1. There are 10 city corporations in Bangladesh and Rajshahi is one of the oldest city corporations, which is established in 1991[29]. In the previous decade Rajshahi is called a city of rickshaw but now it is called a city of both rickshaw and auto-rickshaw and easy bike [2]. In Rajshahi city, 63% commercial vehicles transport passenger and carry freight [12]. The nature of all intersections is Non-signalized. Most busy intersections were selected named Vodra, Laxmipur, Monicottor.

Road Geometry of Intersections

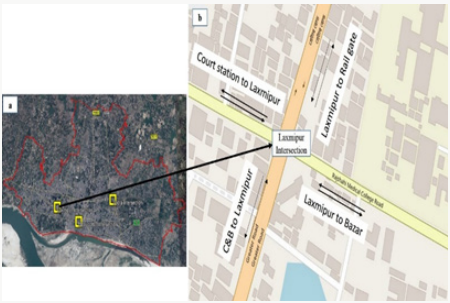
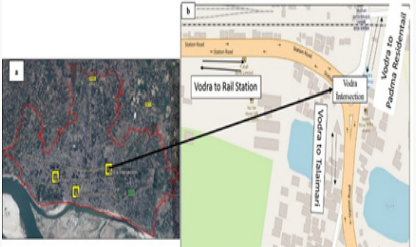
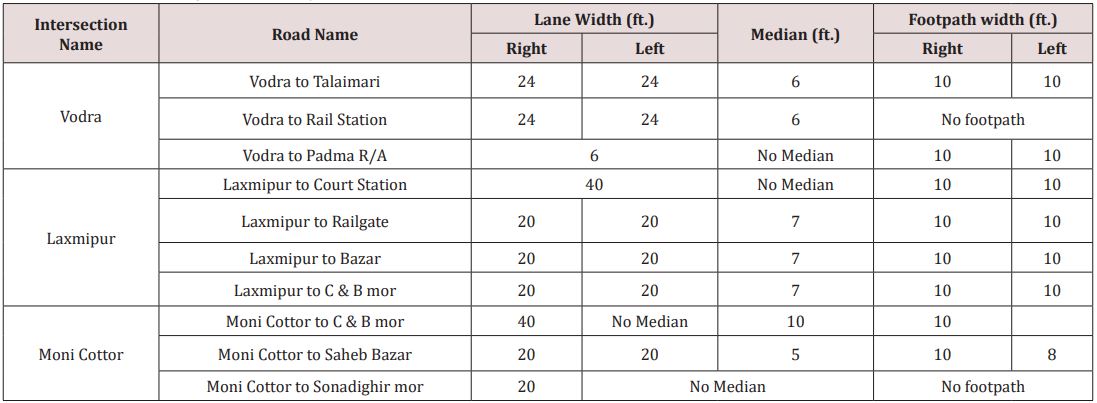
Three roads intersected at Vodra intersection are TalaimariVodra, Railway Station-Vodra & Padma Residential area- Vodra. A sculpture is situated named “Smriti Amlan” in the center of intersection which radius is 40 feet. The Talaimari-Vodra road has four lanes. The “Railway station-Vodra” road has four lanes with two sided footpath. The Padma residential-Vodra road has two lanes with two-sided footpath Figure 1. Laxmipur intersection consists of four roads named Bazar to Laxmipur, Railgate to Laxmipur, C&B to Laxmipur & court station road to Laxmipur. In the Centre of intersection, a sculpture is situated named Mintu mia chottor and its radious is of the center is 29ft. Court station road is two lanes and other road is four lanes Figure 2.
Figure 1: Location Map of Study area.
Lupinepublishers-openaccess-journals-Civil-engineering-Architechture
Figure 2: Location of Three Major Intersection in RCC area.
Lupinepublishers-openaccess-journals-Civil-engineering-Architechture
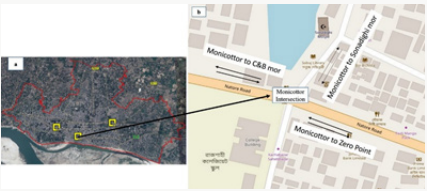
Figure 3: Road Connectivity of Intersection
Lupinepublishers-openaccess-journals-Civil-engineering-Architechture
  1. Location of Monicottor intersection.
  2. Road Connectivity of Monicottor Intersection.
Figure 4: Road Connectivity of Intersection
Lupinepublishers-openaccess-journals-Civil-engineering-Architechture
  1. Location of Laxmipur intersection.
  2. Road Connectivity of Laxmipur Intersection.
Figure 5: Road Connectivity of Intersection
Lupinepublishers-openaccess-journals-Civil-engineering-Architechture
  1. Location of Vodra intersection.
  2. Road Connectivity of Vodra Intersection.
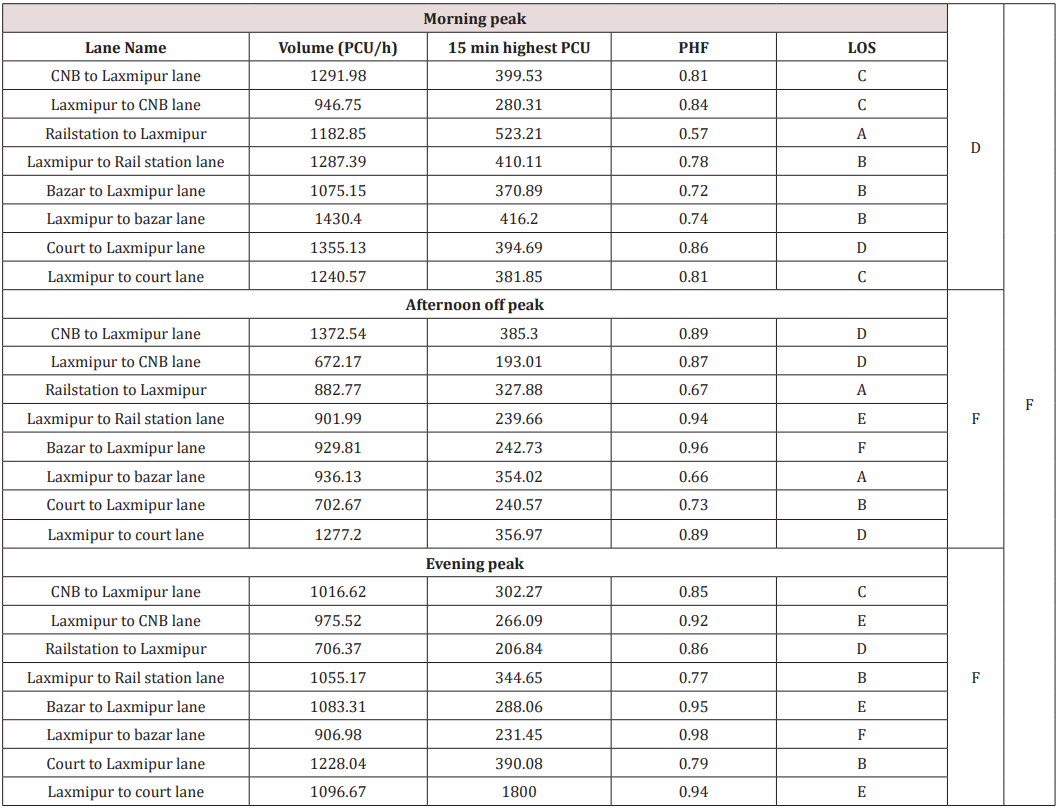
The busiest intersection is Monicottor which consists of 3 roads. In east, west and north direction are Zero point, CNB area, Sonadighi mor. Vehicles type are Auto rickshaw, Rickshaw, CNG, Microbus, Truck, Cycle, Motor cycle, bus (Figures 3-5) (Tables 1 & 2).
Table 1: Road Geometry of Three major intersection in RCC area.
Lupinepublishers-openaccess-journals-Civil-engineering-Architechture
Table 2: Traffic performance measurement by V/C ratio (HCM 2010) (Mathew & Bombay, 2017; Wikipedia, 2017).
Lupinepublishers-openaccess-journals-Civil-engineering-Architechture

Methodology

The main objective of this research is to identify the LOS of different intersections. LOS is related with Modal composition of various transport, Road capacity and Road geometry. Modal composition describes the key operational, commercial advantages and properties of any transport in terms of cost, speed, accessibility, frequency, safety, comfort, etc. In this research to achieve the LOS, traffic volume survey was carried out to count mixed vehicles, geometric feature survey. All traffic data were collected into three phases like morning peak (8-10am), afternoon off peak (12-2pm) and evening peak (4-6pm) and each peak was continued for 2 hours duration (Transport, 2004). Geometric feature survey is needed to identify the existing road capacity. To identify the existing supply and capacity conditions of various intersections road length, width of carriageway, footpath, median, shoulder, number of legs and control system etc. data has been collected by conducting field survey. The calculation of Passenger car unit or PCU is very important to analyze the mixed or heterogeneous traffic and PCU is a simplification which convert the different types of vehicles into equivalent number of passenger cars [26]. By conducting a private survey in 2014, 11,000 battery operated auto-rickshaws, 35,000 rickshaws, 800 CNG-rickshaws and auto-tempos, 1,500 human hauler, 1,200 rickshaw vans and 1,500 cars and micro-buses are investigated [3] (Table 3).
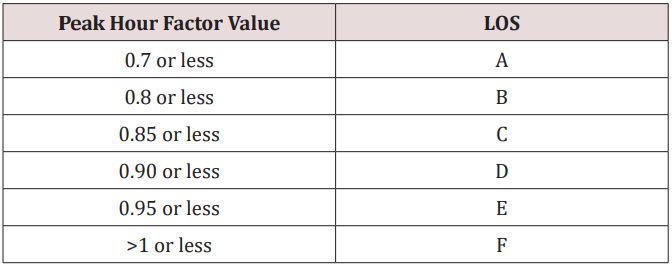
Table 3: LOS with respect to its PHF.
Lupinepublishers-openaccess-journals-Civil-engineering-Architechture
To estimate the LOS two useful methods have been applied. The volume-capacity ratio is 1st of them. Volume capacity ratio (V/C) is one of the most used index to assess traffic status in cities, in which V is the total number of vehicles passing a point in one hour and C for the maximum number of vehicles that can pass a certain point at the reasonable traffic condition, “Volume -Capacity Ratio (V/C) is a measure that reflects mobility and quality of travel of a facility or a section of a facility. It compares roadway demand (vehicle volumes) with roadway supply (carrying capacity) [18]. The V/C method is associated with LOS and determining how well a roadway is performing. This measure can alert transportation providers to areas where traffic mitigation measures should be considered. V/C ratio was calculated by following formula [30,31].
Lupinepublishers-openaccess-journals-Civil-engineering-Architechture
The 2nd method to calculate the LOS is Peak Hour factor (PHF) method. Traffic engineers focus on the peak-hour traffic volume in evaluating capacity and other parameters because it represents the most critical time. The analysis of level of service is based on peak rates of flow occurring within the peak hour because substantial short-term fluctuations typically occur during an hour. Common practice is to use a peak 15-minute rate of flow. Flow rates are usually expressed in vehicles per hour, not vehicles per 15 minutes. The relationship between the peak 15-minute flow rate and the full hourly volume is given by the peak-hour factor (PHF) as shown in the following equation (Authority, 2003). Peak-hour factors in urban areas generally range between 0.80 and 0.98. Peak-hour factors over 0.95 are often indicative of high traffic volumes [32]. PHF was evaluated by the following formula [31].
PHF= (hourly volume/4* volume count at highest 15-min) (3)

Results and Discussions

To fulfill the objectives of the study, data analysis has been done on two stages. First, analysis on existing conditions of intersections has been conducted. Secondly, survey data have been conducted to find out the recent traffic performance conditions of these intersections. In mixed traffic condition, modal share is an important factor for assessment of intersection performance.

Monicottor Intersection

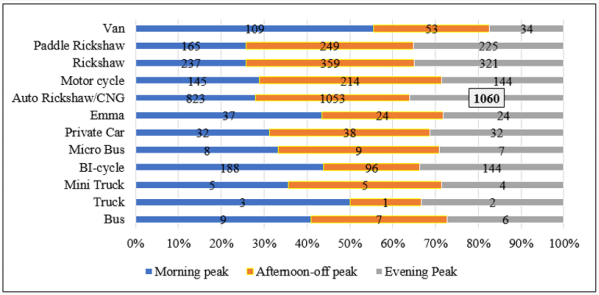
Moni- Cottor to C & B lane: It is noticed that most vehicles about 1060/hour used by public than other vehicles are autorickshaw at evening hour. There is no separate lane constructed for such type of vehicles. Second dominated vehicle is rickshaw and paddle rickshaw and their peak value 359 vehicles/hour and 249vehicles/hour respectively were found both at afternoon off peak. Afternoon off peak contains maximum number of vehicles in most of the case. Less dominant vehicles are bus, truck, private car, Emma. Moderate dominant vehicles are motor cycle, rickshaw, paddle rickshaw and bi cycle. Their peak value fluctuates at any peak hour (either morning or afternoon peak or evening peak) Figure 6.
Figure 6: Modal variation of Moni- Cottor to C & B.
Lupinepublishers-openaccess-journals-Civil-engineering-Architechture
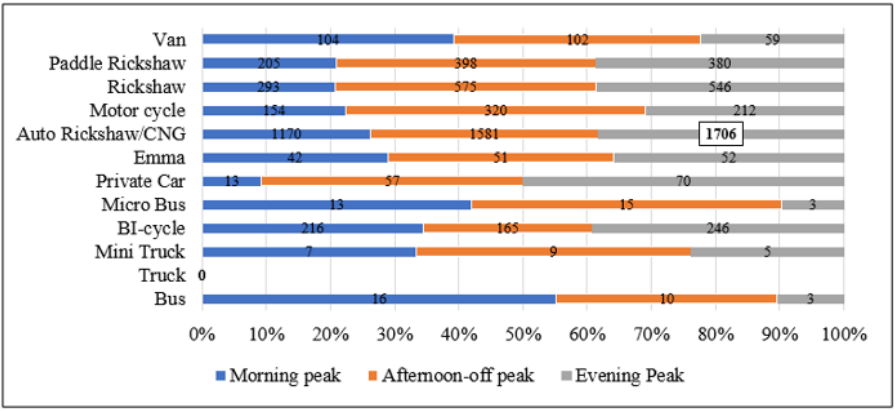
Monicottor to Zero-point lane: In this lane majority of vehicle is auto-rickshaw about 1706/hour at evening peak. Negligible number of vehicles like bus, mini truck, micro-bus is existing in road. Moderate number of vehicles are paddle rickshaw, motor cycle, rickshaw, van and bi cycle. No truck found in this lane at any peak hour. During evening from 4-6pm maximum amount of traffic is obvious. In this lane traffic volume is so high because traffic flow from three different direction mix here Figure 7.
Figure 7: Modal variation of Moni-Cottor to Zero point.
Lupinepublishers-openaccess-journals-Civil-engineering-Architechture
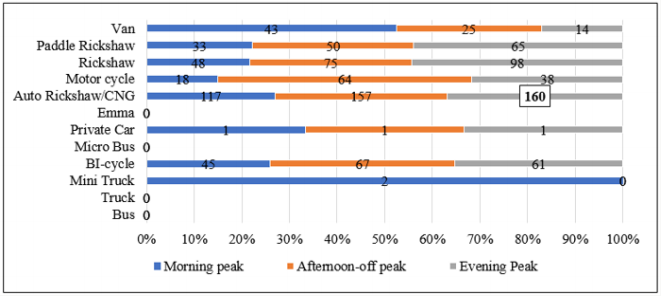
Moni-Cottor to Sonadighi lane: Traffic volume in Sonadighi lane is less than the other lanes. For less carriage width heavy vehicle cannot enter in this lane. Higher amount of Auto-rickshaw or CNG about 160/hour were found at evening peak. Mainly autorickshaw is dominant vehicle at 3 peaks. No Emma, microbus, truck, bus influence in that lane. Moderate dominant vehicles are motor cycle, rickshaw, paddle rickshaw, bi cycle and van which fluctuate at every peak hours. Vehicles like private car, mini truck are existing in road in less amount Figure 8.
Figure 8: Modal variation of Moni-Cottor to Sonadighi lane.
Lupinepublishers-openaccess-journals-Civil-engineering-Architechture
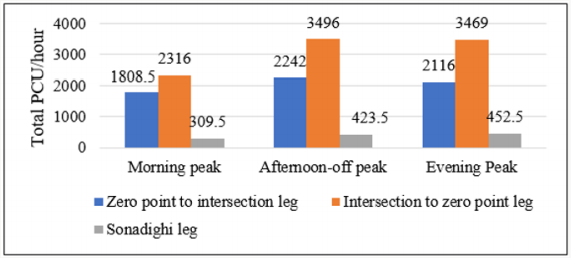
Temporal Variation of Three legs of Moni-chottor Intersection: Intersection to zero-point leg has 3496 PCU/hour which contains the highest PCU/hour among the three legs at afternoon-off peak. Second one is intersection to zero-point leg and last one is sonadighi leg contain 2242pcu/hour and 452.5pcu/hour at afternoon off peak and evening peak respectively Figure 9.
Figure 9: Temporal variation of three legs.
Lupinepublishers-openaccess-journals-Civil-engineering-Architechture

Level of Service in Monicottor Intersection

V/C Ratio Method
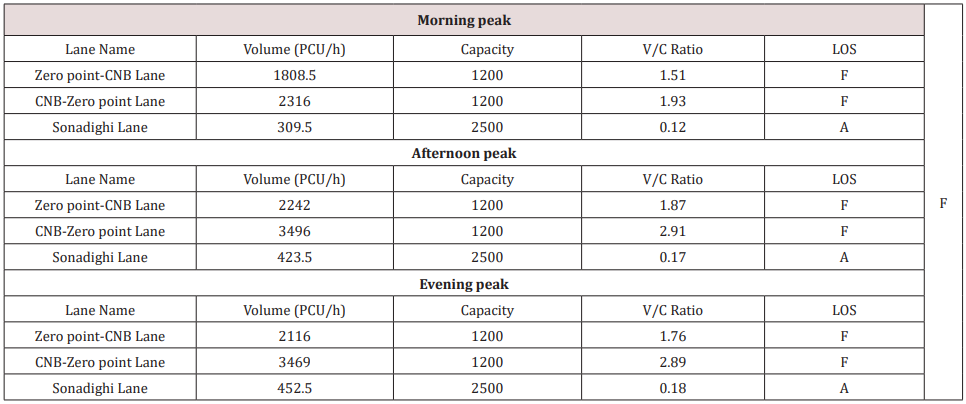
Analysis shows that in Zero Point to CNB lane & CNB to Zero Point lane traffic volume is more than its capacity in three periods of time. Only sonadighi lane fell within A category in 3 peaks. Rest of the lanes satisfy level of service of F category. By following V/C ratio method LOS of Monicottor intersection is F category in three periods of time Table 4.
Table 4: Level of service of different lanes of Monicottor intersection by V/C ratio.
Lupinepublishers-openaccess-journals-Civil-engineering-Architechture
Peak Hour Factor Method
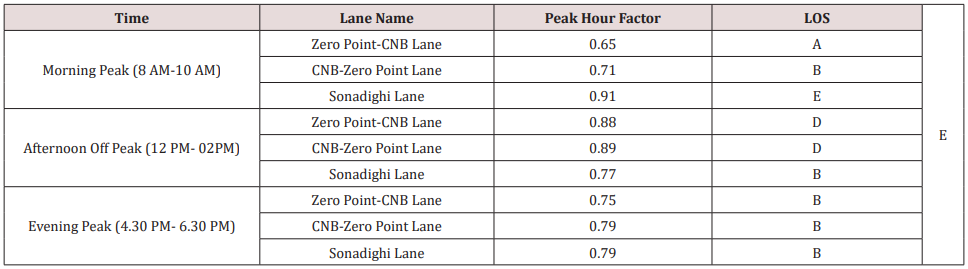
Monicottor intersection LOS of Sonadighi lane in morning is E category, in noon LOS of Zero Point to CNB lane & CNB to Zero Point lane is of D category and in evening peak LOS of the three lanes are category B. As we can see that, among these three periods lowest LOS of Sonadighi lane is category E Table 5. By analyzing two methods level of service of Moni-cottor intersection is F which indicates worse condition exist in this intersection.
Table 5: Level of service of different lanes of Moni-cottor intersection by Peak Hour Factor.
Lupinepublishers-openaccess-journals-Civil-engineering-Architechture

Laxmipur Intersection

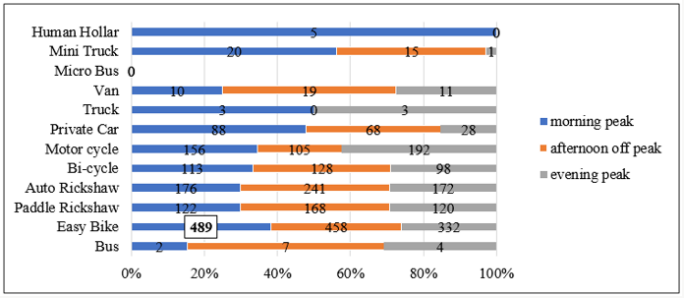
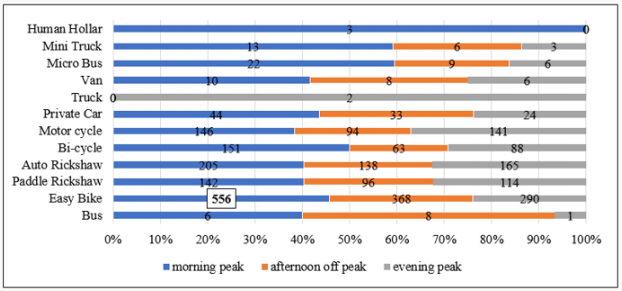
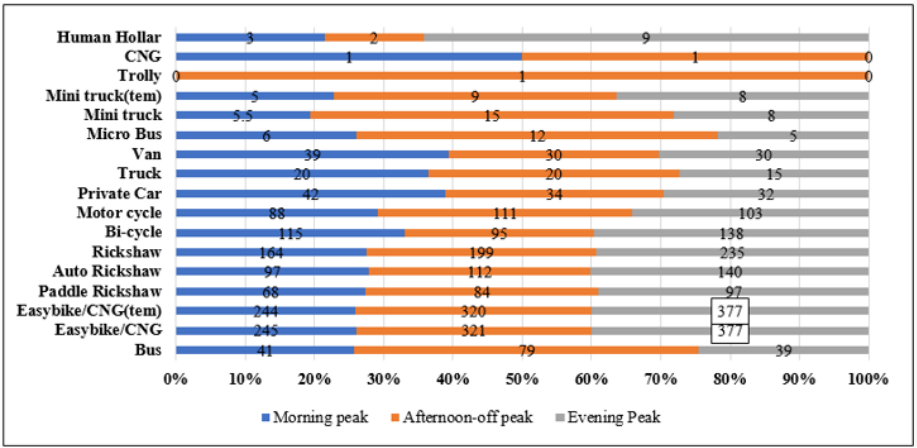
C & B to Laxmipur: Easy bike is the most dominated vehicle about 489 found in the morning. Rest of the peaks also contain highest amount of easy bike and its amount is 458 and 332 at noon and evening hour respectively. Paddle rickshaw and auto-rickshaw are maximum in afternoon peak period. The maximum volume of motor cycle is found in the evening period whereas maximum private car volume is found in the morning period. Moderate number of vehicles are paddle rickshaw, auto rickshaw, bi cycle. There is no microbus influence in this lane. Less dominant vehicles are truck, van, Mini truck, human holler and also their effect are less at three peaks Figure 10.
Figure 10: Temporal variation of three legs.
Lupinepublishers-openaccess-journals-Civil-engineering-Architechture
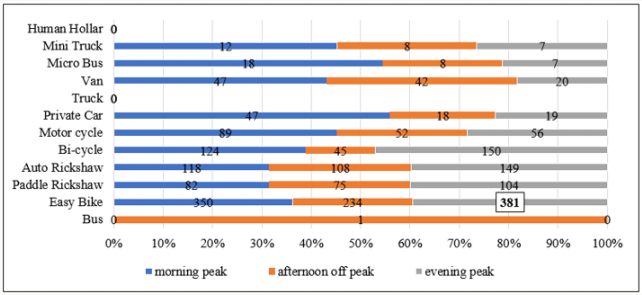
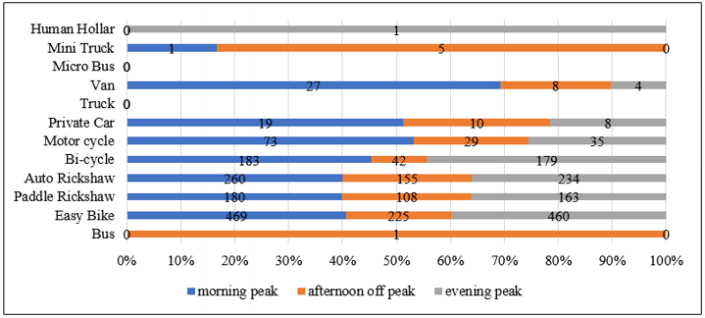
Laxmipur to C & B lane: High concentration of vehicle in Laxmipur to CNB lane is easy bike. Amount of such type vehicle is 381 was found in evening hour. No truck, human holler influence in this lane. Only one bus was found during afternoon off peak. At evening, morning, afternoon off peaks concentration of auto-rickshaw, paddle rickshaw and bi cycle were maximum. Concentration of van, micro bus, mini truck is limited, their percentages are about 45%, 55% and 47% at morning, about 43%, 38%. 40% at afternoon off peak and rest of the percentage exist at evening respectively Figure 11.
Figure 11: Modal variation of Laxmipur to CNB lane.
Lupinepublishers-openaccess-journals-Civil-engineering-Architechture
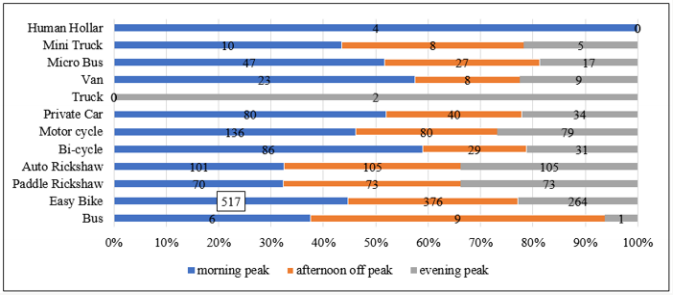
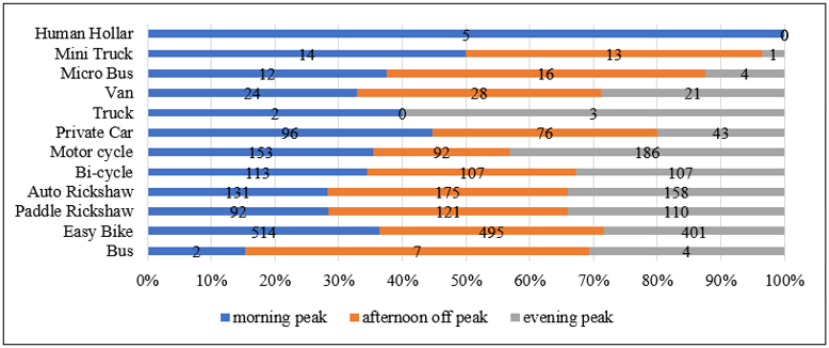
Rail Station to Laxmipur: In This lane, dominant vehicle is easy bike. At morning highest concentration of easy bike was found and its amount is 517. Second dominant vehicles are paddle rickshaw, auto rickshaw, bi cycle, motor cycle, private car and their percentage are about 33%, 35%, 59%, 45%, 53% at morning, 35%, 37%, 25%, 35%, 25% at afternoon off peak and rest of the percentage of vehicles found at evening respectively. Low volume of traffic like Truck, human holler was found in this lane. Less dominant vehicles were mini truck, micro bus, van and bus Figure 12.
Figure 12: Modal variation of rail station to Laxmipur.
Lupinepublishers-openaccess-journals-Civil-engineering-Architechture
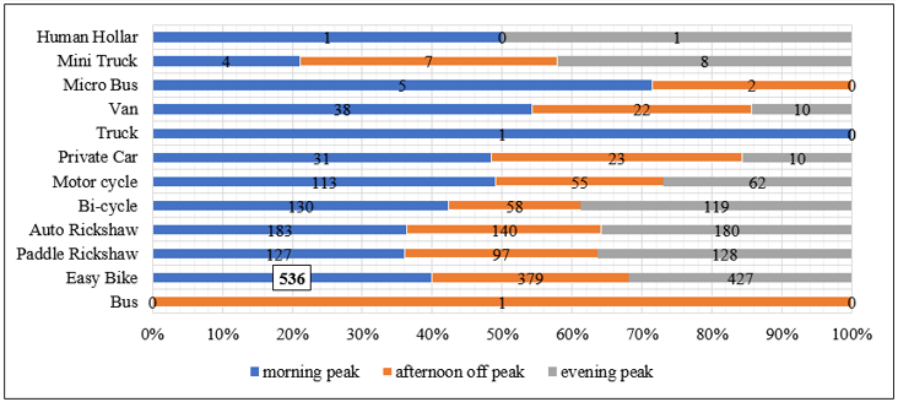
Laxmipur to Rail Station: This lane dominant vehicle is easy bike (536). Less influenced vehicles were truck, bus, van, micro bus, mini truck, and human holler. Concentration of paddle rickshaw, auto rickshaw, bi cycle, motor cycle, private car about 35%, 37%, 43%, 49%, 49% at morning, 32%, 35%, 39%, 28%, 15% at evening and rest of the percentage vehicles were found at afternoon off peak respectively Figure 13.
Figure 13: Modal variation of Laxmipur to rail station.
Lupinepublishers-openaccess-journals-Civil-engineering-Architechture
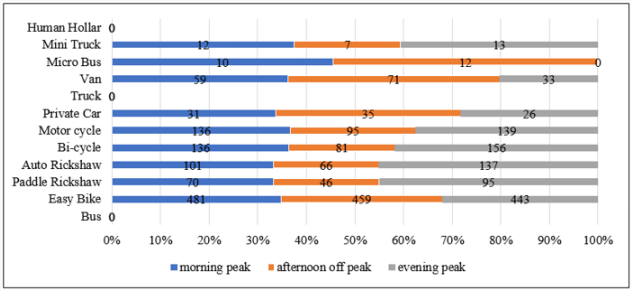
Bazar to Laxmipur: Easy bike dominant at this lane at morning, evening and afternoon off peak. Second dominant vehicles are paddle rickshaw, auto rickshaw, bi cycle, motor cycle, private car and their percentage are approximately 33%, 34%, 35%, 36%, 32% at morning, 33%, 45%, 45%, 43%, 38%, 28%. at evening peak and rest of percentage at afternoon off peak respectively. Truck, bus and human holler have no influence. Less volume of vehicles are van, micro bus, and mini truck Figure 14.
Figure 14: Modal variation of Bazar to Laxmipur.
Lupinepublishers-openaccess-journals-Civil-engineering-Architechture
Laxmipur to Bazar: Easy bike is the dominant vehicle found at morning hour. Second dominant vehicles are paddle rickshaw, auto rickshaw, bi cycle, motor cycle, private car and their concentration percentage are 40%, 40%, 50%, 38%, & 42% at morning, 28%, 30%, 22%, 26%, 32% at afternoon off peak and rest of the percentage at evening peak respectively. Less dominant vehicles are van, micro bus, mini truck, human holler and the concentration of these vehicles fluctuate during evening, morning, and afternoon off peak. Truck has less influence in this lane Figure 15.
Figure 15: Modal variation of Laxmipur to bazar.
Lupinepublishers-openaccess-journals-Civil-engineering-Architechture
Court to Laxmipur lane: Large amount of vehicles is easy bike found at morning. There is no truck and microbus in this lane. Concentration of paddle rickshaw, auto-rickshaw, bi cycle, motor cycle are 40%, 40%, 43%, 53% at morning, 23%, 25%, 13%, 22% at afternoon off peak respectively. Low concentration of vehicles is mini truck, human, holler, private car Figure 16.
Figure 16: Modal variation of court to Laxmipur lane.
Lupinepublishers-openaccess-journals-Civil-engineering-Architechture
Laxmipur to Court lane: Large volume of vehicle is easy bike. Human holler was found only morning peak. Percentage of paddle rickshaw, auto rickshaw, bi cycle, motor cycle, and private car are 28%, 29%, 35%, 36%, 43%, at morning, 40%, 42%, 43%, 30%, 35%, at afternoon off peak respectively. Rest of the percentage was found in evening hour peak. Less influenced vehicles were van, micro bus, mini bus and bus Figure 17.
Figure 17: Modal variation of Laxmipur to court lane.
Lupinepublishers-openaccess-journals-Civil-engineering-Architechture
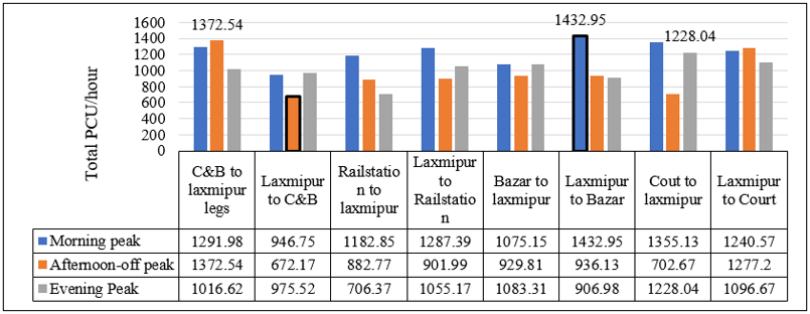
Temporal Variation of Different Legs of Laxmipur Intersection: Laxmipur intersection to bazar leg contain highest amount of PCU/hour at morning hour and this value is 1432.95 PCU/hour. Lowest PCU/hour looked through at Laxmipur intersection to CNB during afternoon off peak. The location of highest concentration of PCU/hour for afternoon off peak and evening were CNB to Laxmipur leg and court to Laxmipur leg respectively.

Level of Service

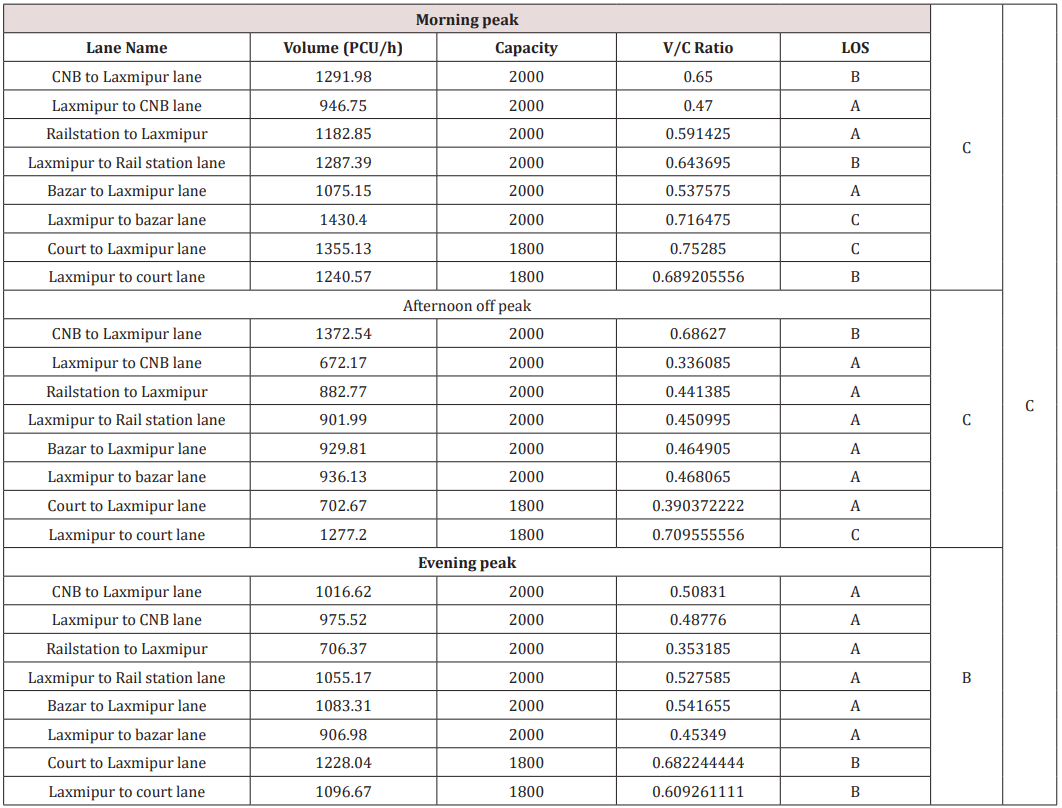
V/C Ratio Method: By comparing between given V/C ration and standard V/C ratio, the highest LOS in respect of V/C ratio at morning peak, afternoon off peak, evening peak are C, C and B and their respective locations are Laxmipur to bazar lane, court to Laxmipur lane and Laxmipur to court lane. According to V/C ratio, LOS of Laxmipur intersection is C by considering all lanes.
Peak Hour Factor Method: According to PHF method the LOS of Laxmipur intersection is F compared to standard PHF. At morning highest PHF is C in CNB to Laxmipur lane, Laxmipur to CNB lane and Laxmipur to court lane. At afternoon off peak, evening peak the highest PHF is F in bazar to Laxmipur lane and Laxmipur to bazar respectively.
By considering and analyzing two methods the LOS of Laxmipur intersection is F which is worst among all category

Vodra Intersection

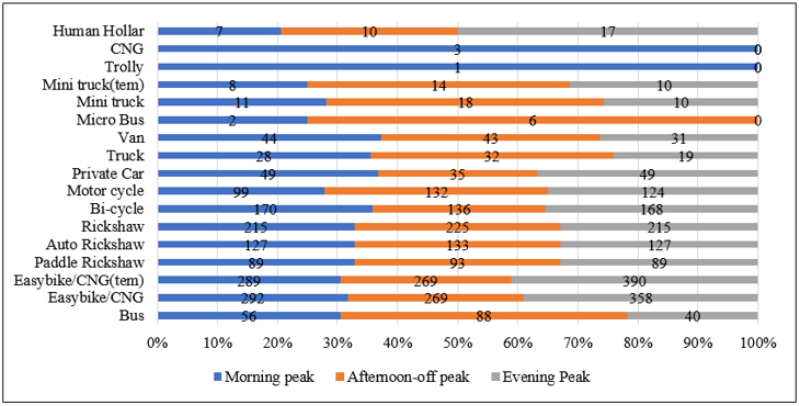
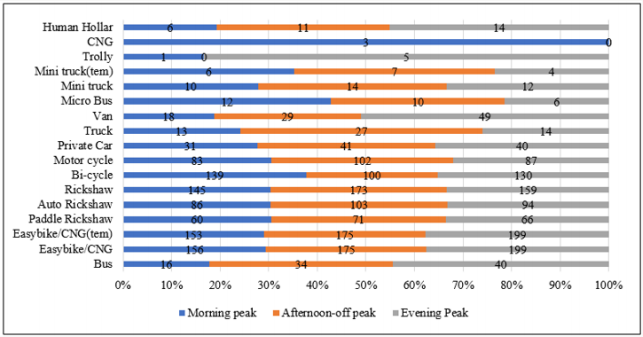
Talaimari to Vodra: Majority of vehicles in this lane congested during evening. Dominant vehicle is easy bike (temp) which amount is 390 vehicles/hour found at evening. Less influenced vehicles are micro bus, mini truck, mini truck (temp), trolley, CNG, human holler Figure 18,19.
Figure 18: Temporal variation of different of Laxmipur intersection.
Lupinepublishers-openaccess-journals-Civil-engineering-Architechture
Figure 19: Modal variation of Talaimari to Vodra.
Lupinepublishers-openaccess-journals-Civil-engineering-Architechture
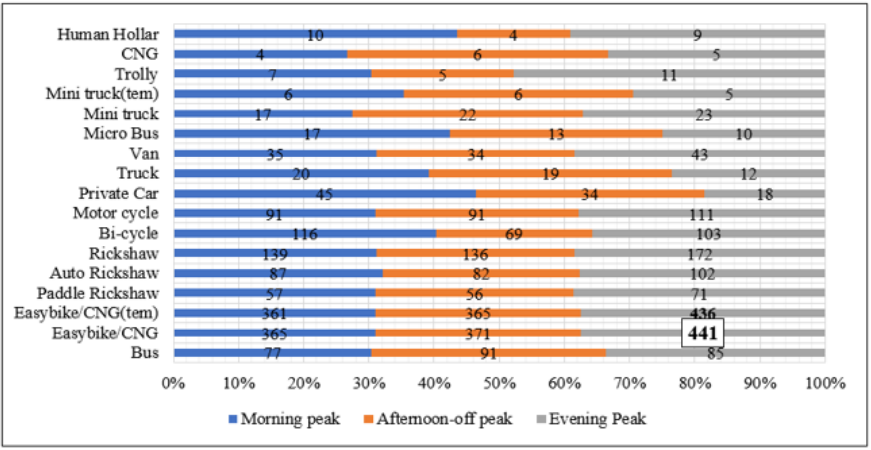
Vodra to Talaimari: Highest concentration of vehicle is 441 vehicle/hour found at evening. Second dominant vehicle is easybike/CNG (temp) which is nearer to first dominant vehicle. Moderate dominant vehicles are paddle rickshaw, auto rickshaw, rickshaw, bicycle, motor cycle, private car and their percentage as well as amounts are 31% & 57, 32% & 87, 31% & 139, 40% & 116, 31% & 91, 47% & 45 at morning, 30% & 56, 30% & 82, 30% & 136, 22% & 69, 31% & 91, 35% & 34 at afternoon off peak respectively. Rest of the percentage that is most vehicles congested during evening. Less influenced vehicles are micro bus, van, mini truck, mini truck (temp), trolley, CNG and human holler Figure 20.
Figure 20: Modal variation of Talaimari to Vodra.
Lupinepublishers-openaccess-journals-Civil-engineering-Architechture
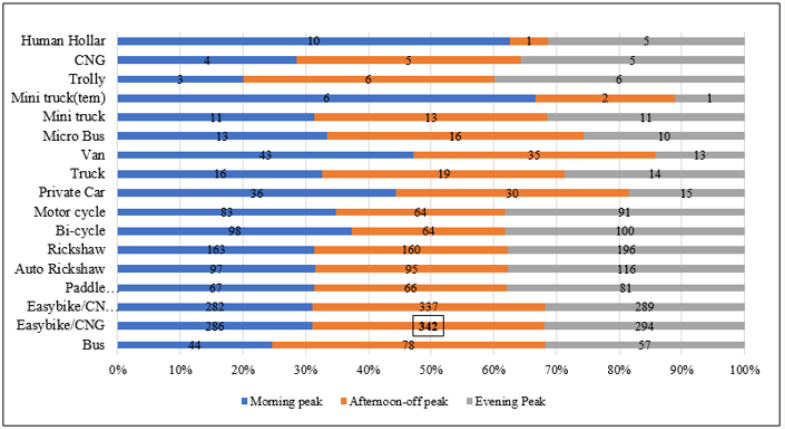
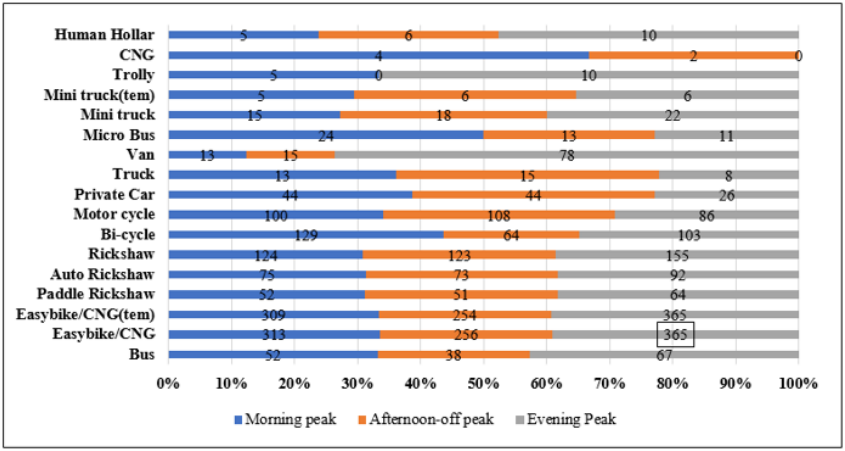
Padma R/A to Vodra: First dominant vehicle is easy bike/ CNG and its concentration is maximum at afternoon off peak. Second dominant vehicle is easy bike/CNG (temp). Concentration of vehicles those are exist in less amount in these lanes are human holler, CNG, trolley, mini truck(temp), micro bus, van, truck and private car. Moderate concentration of vehicles that occupied in this lane are paddle rickshaw, rickshaw, auto rickshaw, bi cycle, motor cycle Figure 21 (Tables 6 & 7).
Table 6: Level of service of different lanes of Monicottor intersection by V/C ratio.
Lupinepublishers-openaccess-journals-Civil-engineering-Architechture
Figure 21: Modal variation of Padma R/A to Vodra.
Lupinepublishers-openaccess-journals-Civil-engineering-Architechture
Table 7: Level of service of different lanes of Monicottor intersection by Peak hour factor method.
Lupinepublishers-openaccess-journals-Civil-engineering-Architechture
Figure 22: Modal variation of Vodra to Padma R/A.
Lupinepublishers-openaccess-journals-Civil-engineering-Architechture
Rail gate to Vodra: Highest concentration of vehicles in this lane are easy bike/CNG and easy bike/CNG (temp) and contained same amount. Concentration was maximum at evening in case of both types of vehicles. Less concentration of vehicles are human holler, CNG, trolley, mini truck, micro bus, van, truck, private car. Moderate concentration of vehicles are paddle rickshaw, auto rickshaw, rickshaw, bi cycle, motor cycle Figure 23.
Figure 23: Modal variation of Railgate to Vodra.
Lupinepublishers-openaccess-journals-Civil-engineering-Architechture
Figure 24: Modal variation of Vodra to railgate.
Lupinepublishers-openaccess-journals-Civil-engineering-Architechture
Vodra to rail gate lane: This lane also follows previous two lanes Railgate to Vodra, Vodra to Padma R/A Figure 24.
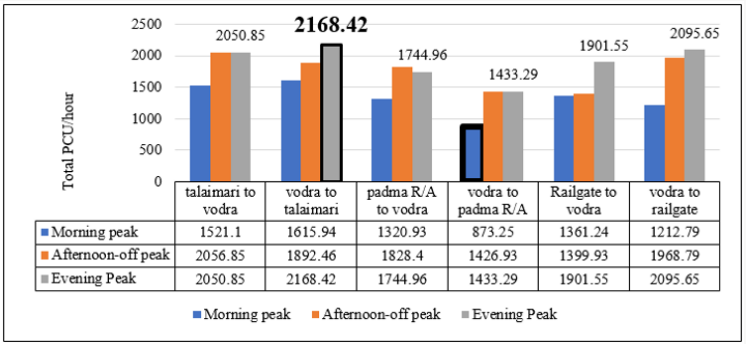
Temporal Variation of Different Legs: Concentration of volume in case of Vodra to Talaimari lane was high at evening peak. All lanes have highest PCU/hour at evening peak except Vodra to Talaimari lane. The lowest PCU/hour was 1426.93 found in Vodra to paddma R/A during morning peak Figure 25.
Figure 25: Temporal variation of Vodra intersection.
Lupinepublishers-openaccess-journals-Civil-engineering-Architechture

Level of Service

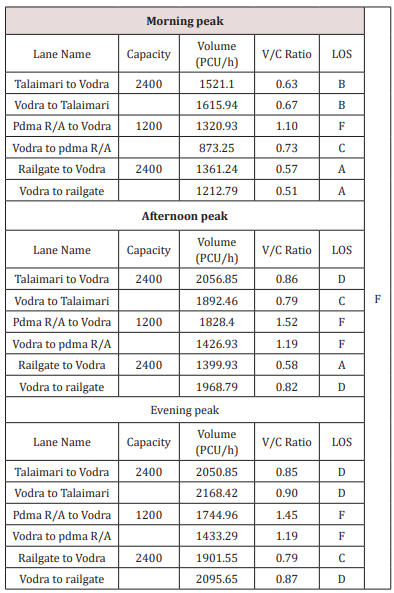
V/C Ratio Method: The volume of Vodra to Padma R/A lane, Padma R/A to Vodra, are higher than
Table 8: Level of service of different lanes of Monicottor intersection by V/C Ratio Method.
Lupinepublishers-openaccess-journals-Civil-engineering-Architechture
Table 9: Level of service of different lanes of Monicottor intersection by Peak hour factor method.
Lupinepublishers-openaccess-journals-Civil-engineering-Architechture
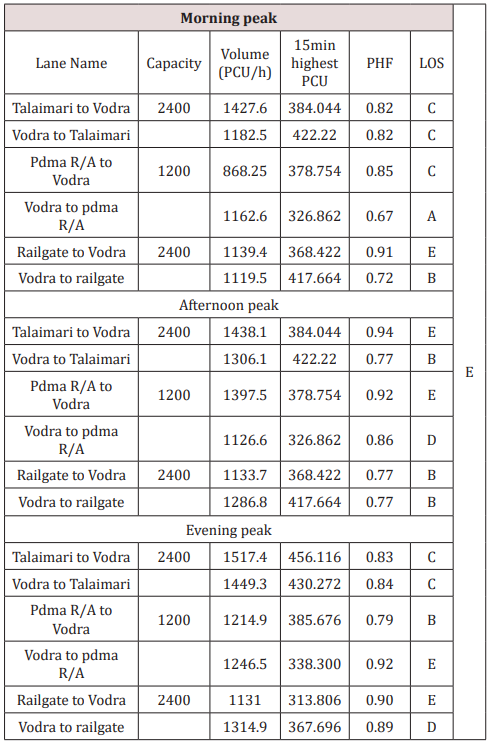
capacity during three peaks. The highest LOS of Vodra intersection is F by following V/C ratio Table 8. LOS identified by PHF was E. Vodra to Padma R/A, Railgate to Vodra, Talaimari to Vodra contain highest LOS at evening, morning and afternoon off peak respectively. The final LOS in this intersection is F Table 9.

Dissuasion

Causes of Congestion in Intersection

Moni-chottor intersection plays as a main commercial hub of Rajshahi city. This is the main reason of rising auto-rickshaw volume in Moni-chottor intersection. Traffic flow in afternoon off-peak is higher than other two peak hours. This is may be due to Monichottor intersection is located near educational zone. The factors for greater traffic flow from Zero point to Intersection is the land use containing important establishments like Rajshahi Collegiate School and College, Rajshahi College, a large Kaccha Bazar, Janata Bank Corporate Bank, etc. As the effective carriageway width is only 12 feet, the LOS of these two lanes is F. Less rent and quickly reached in destination are one of the major reason to get the majority and popularity of increase amount of auto-rickshaw [3]. Some probable reasons behind the fascination of using CNG by operators as well as passengers were investigated. Attractive advantages like Reduction of maintenance cost, emissions of 20-30% fewer greenhouse gas, environmentally friendly behavior, superior to petroleum-based products diverted and motivated the operators to use such type of vehicles [33].

Effect of Congestion in intersection

One of the major disadvantage is uncontrolled or non-signalized intersections. This is also known as priority-controlled intersection. It provides no indication to the driver’s concern when vehicle approaches to enter the intersection [34] Low priority movement on minor roads cause delay that influence the performance of such type intersection very strongly. As a result, vehicular conflict creates which is responsible for accident and congestion [35]. LOS of three intersections was F. Level of service F means in an intersection vehicle are forced to move and speed of vehicles are too low [36]. Commercial and educational activities around Monicottor intersection attract people so why LOS of Monicottor is very low. Again, all the vehicles pass this intersection very slowly. In recent time traffic jam happens in this intersection. Few lanes contain higher flow rate than their required capacity. If traffic flow equals or less than capacity Collision between vehicles, low mean speed, frequent unexpected stoppage will occur [37]. Congestion occurs due to excess traffic demand and inefficient road operations [38].

Accidents Data Analysis in Rajshahi City due to congestion in intersection

Several tremendous accidents occur in Rajshahi city due to non-signalized intersections. At Dayingpara intersection on Chapainawabganj-Rajshahi road, a truck ran over a truck helper [39]. At Northern intersection under Talaimary area, A truck and an auto-rickshaw collided and two peoples on spot [40]. A bus plunged into a roadside ditch at Kadirpur Jamadarni intersection in Godagari upazila of Rajshahi and result at least 25 peoples were injured [41]. One was killed and another other one was injured near Mohonpur police station intersection in Rajshahi [42]. By sandwiching between two trucks uncle and his nephew killed at at Talaimari intersection in Rajshahi city [43-45].
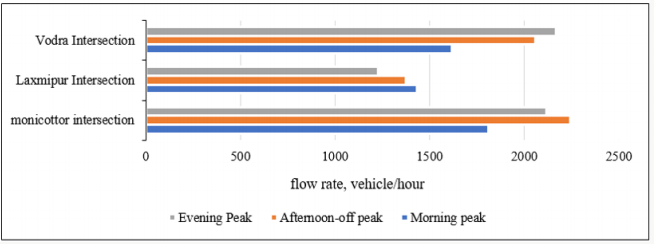
Figure 26: Comparison of flow rates of three intersections.
Lupinepublishers-openaccess-journals-Civil-engineering-Architechture
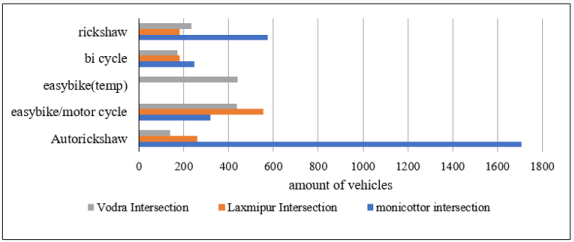
Figure 27: Major (dominant) number of vehicles at different intersections.
Lupinepublishers-openaccess-journals-Civil-engineering-Architechture
Flow rate of vehicle is maximum at monicottor at three peaks. Second one is Vodra intersection. Lowest peak was observed at Laxmipur intersection among all Figure 26. By inspecting selected intersections, the major or dominant vehicle is auto rickshaw in monicottor. That’s why, this is the more congestive intersection. The influence of easybike (temp) only dominant in Vodra intersection. Second dominant vehicle is easy bike or motor cycle Figure 27.

Conclusion

The traffic flow behavior in heterogeneous traffic in Rajshahi city is observed that is absolutely complex. Highest concentration of dominant vehicle (easy bike/CNG) is found in the morning peak period (12 pm-2 pm) at Laxmipur to bazar determined by using modal variation. Laxmipur intersection to bazar leg contain highest amount of PCU/hour at morning hour by using temporal variation. According to V/C ratio and PHF the LOS are C and F respectively. The final LOS of Laxmipur intersection is F. In case of Vodra intersection, highest concentration of vehicles are easy bike/CNG and easybike (temp) found in all lane. The maximum road space are covered by easy bike. Evening peak contains large volume of vehicles determined by using temporal variation. Vodra to Talaimari lane contain large amount of volume during evening. The existing volume of Padma R/A to Vodra lane at morning, Padma R/A to Vodra lane, Vodra to pdma R/A lane at afternoon off peak and evening peak are higher than their standard capacity. LOS of this intersection is F. At monicottor intersection, auto rickshaw is the dominant vehicle in all lanes. Traffic flow in afternoon off-peak is higher than other two peak hours in CNB-Zero point because traffic flow from different three direction mix here. The volume of CNBZero point lane, Zero point to CNB lane at afternoon off peak and morning are higher than their standard capacity. According to Peak Hour Factor Method, LOS of Monicottor intersection is E category at its highest peak. According to V/C ratio method, LOS of Monicottor intersection is F category. So, final LOS is F. Carriageway width should be increased. Local Govt. authority should take necessary steps to improve the condition of these selected intersection.

For more Lupine Publishers Open Access Journals Please visit our website:
https://lupinepublishersgroup.com/

For more Open Journal of Civil Engineering go through the below link:
https://lupinepublishers.com/civil-engineering-journal/


To Know More About Open Access Publishers Please Click on Lupine Publishers

Friday, 11 January 2019

A New Passive bar Damper Device for Alleviation of Structural Damages of Structures Subjected to Seismic Motions (TCEIA) - Lupine Publishers

A New Passive bar Damper Device for Alleviation of Structural Damages of Structures Subjected to Seismic Motions (TCEIA) - Lupine Publishers

Passive energy dissipation devices have been successfully implemented in buildings around the world to reduce structural response, primarily due to earthquakes, but also for wind and other dynamic loading conditions. Passive systems do not require any external sources of power to operate and mitigate dynamic loadings. The focus of this study is to propose a new passive energy dissipation device, called bar damper (BD), for seismic response modification. A brief description of concept, placement, material properties, test setup and loading protocol of the proposed damper are presented. Also, the finite element (FE) analysis by means of FE analysis package, ABAQUS, was conducted to show the device effectiveness on the response reduction under applied load. From the results, it could be concluded that, the device dissipate a significant amount of energy together with a high strength capacity without degradation of stiffness.

https://lupinepublishers.com/civil-engineering-journal/fulltext/a-new-passive-bar-damper-device-for-alleviation-of-structural-damages-of-structures-subjected-to-seismic-motions.ID.000115.php

For more Lupine Publishers Open Access Journals Please visit our website: http://www.lupinepublishers.com/

For more civil engineering best research topics articles Please Click Here: https://lupinepublishers.com/civil-engineering-journal/


Saturday, 5 January 2019

Advanced Ventilation Systems−Theory, Practice, Limitations and Solutions (TCEIA) - Lupine Publishers

Advanced Ventilation Systems−Theory, Practice, Limitations and Solutions (TCEIA) - Lupine Publishers

The task of HVAC systems is to offset indoor thermal load and/ or ventilation load. Indoor thermal load can be offset by either convective-dominant way or radiant-dominant way. In convective dominant way, system recirculated air (RA) is thermally conditioned in term of temperature and humidity. Indoor ventilation load has to be offset by convective dominant way, in which outdoor air is filtered, thermally conditioned and thus it becomes fresh air (FA) to dilute indoor pollutants such as CO2. FA can be supplied in different ways separately or compositely with RA, which is the main focus of this paper.

https://lupinepublishers.com/civil-engineering-journal/fulltext/advanced-ventilation-systems-theory-practice-limitations-and-solutions.ID.000103.php 

For more Lupine Publishers Open Access Journals Please visit our website: http://www.lupinepublishers.com/

For more Civil Engineering Research Journal articles Please Click Here: https://lupinepublishers.com/civil-engineering-journal/

Thursday, 4 October 2018

Electron Beam Additive Manufacturing with Wire (TCEIA) - Lupinepublishers


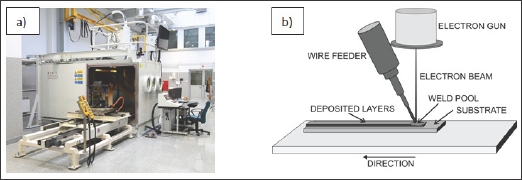
Electron beam additive manufacturing with wire (EBAMW) is a novel technology which can directly fabricate 3-D near-net shape elements from metal wires. Of specific interest are the additive layer manufacturing processes with wires that are capable for producing fully dense metallic and hybrid parts in which the resulting parts may be used for loaded structure. This process is attractive because it eliminates contamination compare to powder process. Manufacturing near-net-shape elements layer-by-layer with wire as a deposit material offers a great potential for time and cost savings in comparison to conventional manufacturing technologies (such as casting, forging, etc.). The increasing market especially for aerospace industry demands for titanium, aluminum and other materials serial production parts has promoted wirefeed processes in recent years, as repeatability, material properties, material usage, possible part size, and building speed have also become issues.

https://www.lupinepublishers.com/civil-engineering-journal/abstracts/TCEIA.MS.ID.000106.php

https://www.lupinepublishers.com/civil-engineering-journal/pdf/TCEIA.MS.ID.000106.pdf

Evaluation of the Performance of Asphalt Binder Modified With Nanoparticles (TCEIA) - Lupinepublishers


The physical and rheological properties of asphalt binder have been characterized using the conventional tests; (penetration, ductility, and softening point) and dynamic shear rheometer (DSR). In this study, Calcium Carbonate nanoparticles (CaCO3) and Aluminum hydro oxide (Al2O3) nanoparticles have been added to the base asphalt with a concentration of 3, 5 and 7% by the weight of asphalt. It was found that the addition of CaCO3 and Al2O3 content has a significant effect on the physical properties of the asphalt, as the penetration reduced up to 50% for modified asphalt with CaCO3 and 64% for modified asphalt with Al2O3. The softening point of modified asphalt binders was increased up to 11 and 12% for both modifiers respectively compared with the base asphalt binder. Also, the results showed that the storage stability of modified asphalt binders with CaCO3 and Al2O3 nanoparticles was less than 2.5 °C, which indicates that the asphalt binder and the modifiers having great compatibility. The evaluation of the complex shear modulus of modified asphalt binders shows that the stiffness (G*) was increased with addition increase of both modifiers, and the best performance of asphalt binder was found with the addition of 5% of both nanoparticles. As a result, the use of CaCO3 and Al2O3 nanoparticles can be considered a suitable alternative additive to modify asphalt binder.