Concrete is the oldest and most important construction material in
the world. Testing of the concrete specimen plays and
important role to know about the strength, durability and condition of
the structure. The work will present a detailed comparison
between the destructive tests and non-destructive methods. This work
focuses on comparing the destructive and non-destructive
testing which can determine the potential durability of the concrete.
This work helped us to reach a conclusion where we can further
find the best testing method system that shall be applicable for various
concrete structures as well as in the concrete industry.
Keywords: Concrete; Compressive Strength; Destructive Testing; Non-Destructive Testing; Strength
Introduction
Concrete is the oldest and most commonly used construction
material in the world, because of its durability, low cost and
high availability Hassan [1]. It provides the most cost effective
and efficient means of construction. Testing of concrete ranges
from non-destructive where there the concrete specimen is not
damaged to destructive testing where the concrete specimen might
be slightly or completely damaged. 2 billion tons of concrete was
produced in the year 2004 in the world, with India contributing
116.1 million tonnes Bhatacharjee, [2]. In today’s world concrete is
made using various kinds of cement, coarse/fine aggregates, water,
and admixtures if any. Proper infrastructure is one of the biggest
drawbacks that halt the growth in India. The 12th five-year plan
laid a special focus on the growth of infrastructure in India i.e.
roads, highways, railways, communication and ports. One trillion is
being invested in this sector during the 12th year plan. The world
views India as a capable nation which is expected to show a growth
from 1.2-1.5 billion by 2040 surpassing China which is already
leading as the most popularly grown nation Rai and Ghavate [3]. A
recent global report “Global Construction 2020” estimated India to
be the third largest global construction market after USA and China.
Today, the enhancement in the design capacity in India has reached
a level where it is possible to design concrete with strengths of more
than 100 MPa which wasn’t possible earlier. China has already used
concrete strength up to 80MPa for high rise building construction
within the cement usage set by the code standards Chatterjee [4].
The destructive testing method is suitable and economically
beneficial for the concrete specimens that are produced at a large
scale. The main aim is to investigate the service life and detect the
weakness of design which might not show under normal working
conditions. It includes methods where the concrete specimen is
broken so as to determine mechanical properties i.e. hardness and
strength. This type of testing is very easy to carry out, easier to
interpret and yields more information. Some popular destructive
test methods are as follows Shankar and Joshi [5]:
I. Tests of mechanical properties using the universal testing
machine (UTM):
a) Tensile testing.
b) Bending testing
c) Compressive testing
II. Hardness testing.
a) Brinell test
b) Rockwell test
III. Impact testing
a) Pendulum test
b) Drop weight test
Destructive testing includes mechanical testing (bending,
impact tests, tensile), macro/microhardness testing as well as
metallographic examination. The various advantages of destructive
testing are listed below:
A. Tests are economical and can be performed at a cheaper rate.
B. Equipment cost for destructive testing is cheap as compared
to non-destructive testing.
C. It identifies mechanical properties (fracture strength,
elongation, and modulus of elasticity)
D. It helps to reduce failures, accidents, and costs.
E. It helps in verifying the properties of the material Shankar
and Joshi [5].
The various disadvantages of destructive testing are:
a. The internal defects of the concrete i.e. bubble, pores etc.
can’t be determined.
b. The concrete specimens cannot be used again after the
testing.
c. It cannot be used to detect early age deformities in concrete
Kumavat et al. [6].
Non-destructive testing (NDT) is mainly concerned with the
evaluation of flaws in materials which are in the form of cracks and
which might lead to loss of strength in a concrete structure (Samson
et al. [7]. NDT is a method for the testing of existing concrete
structures so as to determine the durability and strength. In the
modern construction world, it has become a vital part of the quality
control process. NDT also helps in investigating about the crack
depth, deterioration and microcracks present in concrete. Large
no of parameters like density, strength and surface hardness can
be determined by using NDT methods. It is also possible to check
the integrity of structure and quality of workmanship by detecting
cracks and voids Kumavat et al. [6]. It is applicable on both new as
well as existing structures. Various NDT methods used in the field
are as follows:
i. Rebound hammer test
ii. Ultrasonic pulse velocity test
iii. Combined ultraviolet and rebound hammer test
iv. Core extraction test
v. Ingredient analysis test.
The main aim of NDT is to assess one or more of in situ strength
properties i.e. density, durability, and moisture content. NDT is the
only way to assess the depth of cracks and to investigate whether
any structural damage has occurred. Structural health monitoring
by NDT like rebound hammer and UPV becomes very useful
for the prediction of the service life of structure (Hannachi and
Nacer, 2012). Experimental investigations determine that a good
correlation exists between rebound hammer, UPV, and compressive
strength. Rebound hammer test can be used alone to determine
the compressive strength of concrete. UPV is an ideal NDT
method to predict the deterioration of structures and the service
life of structures. NDT has a vital role in everyday life and is very
important to ensure reliability and safety. The main advantages of
non-destructive testing are listed below:
I. The probe test generates variable results and provides the
fastest means of checking maturity and quality of concrete.
II. Schmidt hammer test provides a simple, quick and
inexpensive method of obtaining the indication of the strength
of concrete with an accuracy of 15 to 20%.
III. Pull-out tests give information on development and maturity
IV. UPV method is the most ideal tool for determining whether
concrete is uniform or not.
V. Radioactive equipment testing is very simple, and the running
cost is less, although the initial price might be very high.
The main disadvantages of non-destructive testing are:
A. Interpretation of results is difficult.
B. The manual operation requires experienced and skilled
technicians.
C. It is difficult to inspect the concrete specimens that are
irregular and full of voids Kumavat et al. [6].
Literature Review
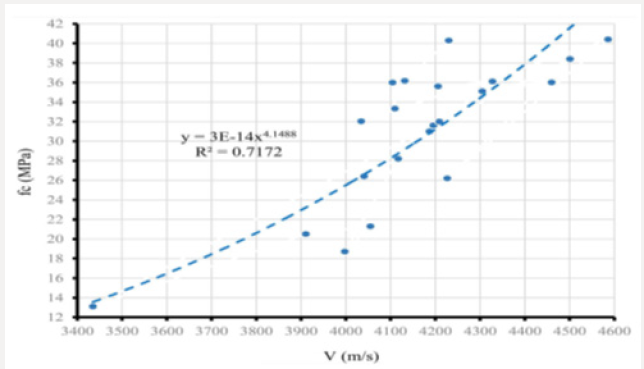
Figure 1: Compressive strength vs velocity of concrete specimens Lopez et al. [8].
Kumavat et al. [6] carried out an experimental study on
combined methods of NDT in concrete and evaluation of core
specimen from existing buildings. Ultra-pulse velocity rebound
hammer and core tests were carried out on the specimens
according to IS standards and combining the two methods.
Regression analysis was carried out and correlation coefficients
were given. Charts were plotted between rebound numbers,
UPV against the compressive strength of the core specimen. The
comparison showed that use of combined methods gives higher
efficiency on estimation of concrete compressive strength. The
results obtained gave a correlation coefficient of 0.003 and 0.355
for rebound value and UPV value. A higher correlation coefficient
of 0.441 was obtained when two methods were combined. Lopez
et al. [8] experimentally studied the concrete compressive strength
estimation by NDT. The main aim was to produce a correlation
between results of surface hardness, UPV and compressive strength
of structural concrete in bleachers of a soccer stadium in Parana,
Brazil. The concrete structure used in the study was 26 years old
and had some severe deformities i.e. segregation, corrosion, and
cracks. Mapping reinforcement was performed and UPV test was
done according to the IS standards. 26 specimens of concrete were
collected and correlation curves between NDT results were plotted.
The results showed that stronger the concrete, higher shall be its
surface index as well as its wave propagation velocity. Results also
showed a good correlation between both surface hardness test and
UPV test (Figure 1).
Bhosale and Salunkhe [9] experimentally found the relation
between destructive and non-destructive tests on concrete.
Different concrete mixes of M20, M25, and M30 were used and a
slab of 2000*1000*200 mm was casted for each grade and cores
were extracted from the slab. Cylinders of size 100*200mm, Cubes
of size 150*150*150mm and cubes of 150*150*150mm with an
inserted bar of size 16mm were cast. Casted cubes after 28 days
were tested to obtain compressive strength using CTM. Rebound
hammer test was performed and an average of 12 readings was
taken. Regression analysis was done, and various correlations were
achieved which are given as follows:
1) The relation between the compressive strength of
cylinders (f cyl) and cores (F cor)
F cor = -0.034 f cyl2+ 2.586 f cyl -19.25
2) Relation between rebound strength of cylinders (R cyl)
and cores (R cor)
R cor= -0.020 Rcyl2+2.15 R cyl -16.75
3) Relation between rebound ultra-pulse velocity of
cylinders (U cyl) and cores (U cor)
U cor= 1.373 U cyl2+ 12.18 U cyl -22.95
4) Relation between rebound strength (R cor) and UPV
strength of cores (f cor)
R cor= -0.050 f cor2 + 3.987 f cor – 31.16
5) Relation between UPV (U cor) and compressive strength
(f cor) of cores
U cor= -0.003 f cor2+ 0.18 f cor +1.410
6) Relation between rebound strength and UPV of cores
U cor= -0.002 R cor2 +0.166 R cor + 1.671
7) Relation between rebound strength and compressive
strength of cylinders
R cyl = -0.037 f cyl2 + 2.712 f cyl -19.85
8) Relation between UPV and compressive strength of
cylinders
U cyl= 0.0222 f cyl + 3.64
9) Relation between rebound strength and UPV
U cyl= 0.001 R cyl2-0.052 R cyl + 4.355
Figure 2: Compressive strength vs. cube no at 7, 14 and 28 days Patil et al. [10].
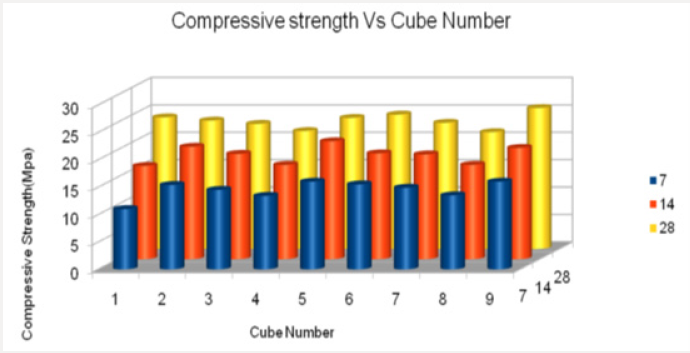
Patil et al. [10] deduced the comparative study of the effect of
curing on strength of concrete using DT and NDT methods. 27 cubes
of M25 grade were casted and allowed to be cured for 7, 14 and 28
days and rebound hammer test and compressive strength test was
performed on 9 cubes of 7, 14 and 28 days respectively. The results
showed that the rebound number increased as the compressive
strength increased and vice-versa. For 28 days of curing decrease
in percentage, strength was less as compared to 7 days percentage
decrease in strength and average error in measuring compressive
strength for 7, 14 and 28 days by rebound hammer and CTM was
found out to be 20.01%, 1.37%, and 0.99% respectively. Results
also showed that compressive strength or rebound number could
be produced if only one of the values was known (Figure 2).
Balwaik [11] experimentally compared the direct, semi-direct
and indirect method of testing. A randomly selected school building
was taken and a complete analysis of all the structural members
was carried out using the direct method of testing. Various defects
like air gaps, hollow spaces and voids were identified and all the
structural members were grouted at junction points so as to avoid
collapsing of members. Results showed that direct UPV method was
found to be reliable in detecting of the flaws as compared to indirect
and semi-direct methods of testing. Damodar and Gupta (2014)
experimentally investigated to develop an ideal curve equation for
early prediction of concrete’s compressive strength. OPC, PPC and
PSC cement were used in the experimental work.18 cubes of the
1st batch of M20, M25, and M30 grade were cast and subjected to
normal curing. 3 cubes from every mix were tested for compressive
strength at 1 and 3 days respectively and the result of an average of
3 cubes was taken. Results obtained from the experiment showed
that OPC gained strength of 80% in the 1st day of accelerated
curing while as PSC and PPC only gained 50% strength in the 1st
day and these results could be used in future for prediction of the
early strength of concrete. Results also showed that an ideal curve
equation could be obtained and used in computing the compressive
strength of concrete (Table 1). The gain in compressive strength is
given by: y= (ab) x
Table 1: Compressive strength comparison of Mix M20, M25 and M30 in MPa (Damodar and Gupta, 2014).
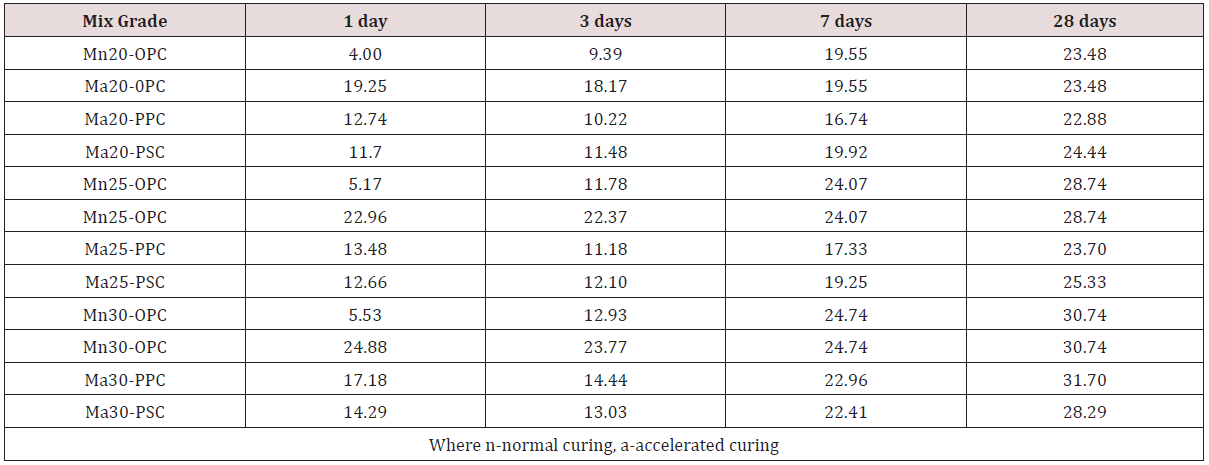
Where, y represents compressive strength, a represents factor
comprising parameters of various design mixes, b represents the
coefficient of no of days the system has been subjected to curing
and x represents no of days the cubes which are subjected to curing.
Savaliya et al. [12] studied the effect of age on mortar and
concrete specimens through an experimental program. 6 concrete
and mortar beams of size (150x150x700mm) and 6 concrete and
mortar cubes of size (150x150x150 mm) were cast and subjected
to direct, indirect and semi-direct UPV testing at 7, 28 and 56 days
respectively. Results showed various relations between velocities of
UPV, the age of mortar and concrete. The relation between velocity
and age of concrete, where y represents the ultra-pulse velocity and
x represents the age of concrete
y = 0.0244 ln (x) + 4.6277
The relation between velocity and age of mortar, where y
represents the ultra-pulse velocity and x represents the age of
mortar.
y = 0.1132 ln (x) + 3.2871
The results also showed that velocities measured by keeping
the transducers on the bottom and top surfaces in semi-direct UPV
testing gave different results. The relation between age of concrete
and velocity of transducers on the top surface, where y represents
the velocity and x represents the age of concrete.
y = 0.1051 ln (x) + 4.7836
The relation between age of concrete and velocity of
transducers on the bottom surface, where y represents the velocity
and x represents the age of concrete
y = 0.0469 ln (x) + 5.0426
Nacer and Hannachi [13] investigated the application of the
combined method of UPV and RH tests for calculation of compressive
strength. UPV and RH tests were measured with mechanical tests
done on cylindrical specimens. The tests were used to arbitrate
quality of concrete using regression analysis modes. Equations were
obtained by statistical analysis to analyses concrete’s compressive
strength on site. Correlation charts were plotted, and regression
equations were listed (Table 2). The results showed that using more
than one NDT provided a better correlation and lead to predictable
evaluation of concrete’s strength. The results also showed that
combined methods appeared more appropriate on conditions of
on-site measurements as they were very fast, convenient and cost
efficient. Shang et al. [14] found the strength of concrete using NDT
methods using experimental study. All the samples were made
from locally available materials and were confirmed to Chinese
standard (GB 175-2007). Five sets of M20, M25. M30, M40, and
M50 mixes were prepared and each containing 21 concrete cube
specimens of the size (150x150x150mm). Rebound hammer test
was performed on the specimens and 16 readings were taken for
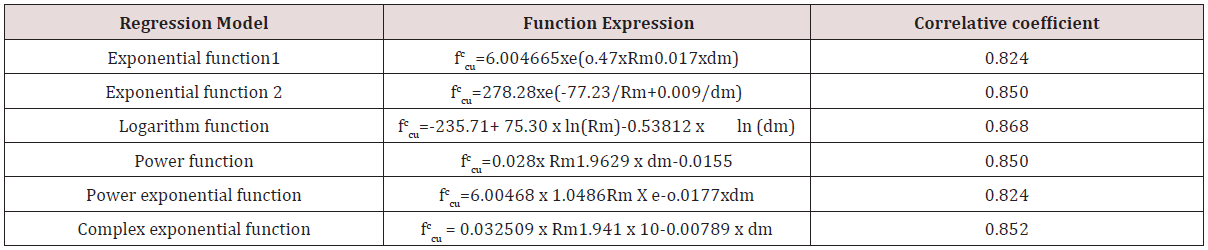
each specimen. Regression analysis was done, and curves were
drawn for the rebound hammer method. Results showed that
the rebound hammer was found reliable in predicting the early
strength of concrete. It was concluded that regression models for
the assessment of strength could be used for prediction of concrete
strength (Table 3). Shariati et al. [15] assessed the strength of
RC structures through UPV and rebound hammer tests and an
interrelationship between DT and NDT tests was established.
Main members of an existing building including a column, beam,
and slab were tested by NDT. Regression analysis was done, and
calibration curves were drawn. Correlation between predicted
and actual compressive strength of concrete was interpreted by
plotting average rebound no/ultrasonic pulse velocity against the
compressive strength of each member. Results obtained from the
experimental study showed that the regression model achieved
from the combination of two NDT methods was more precise as
compared to the individual methods. Results also showed that the
rebound number method was more effective in forecasting the
compressive strength of concrete than the UPV test method. The
best-fit curve that represents the relationship for UPV results has
the following equation:
Table 2: Regression equations for Cylindrical and core Specimens (Hannachi and Nacer, 2012).
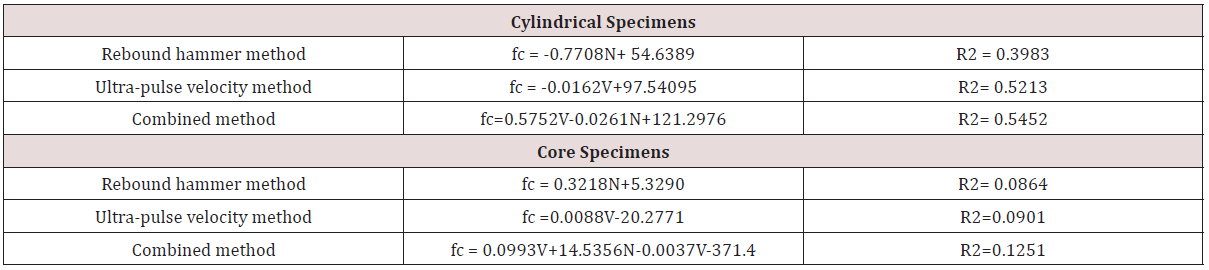
Table 3: Rebound Curve for Concrete measurement and error (Shang et al., 2012).
fc (V) = 15.533V - 34.358
Where V is the ultrasonic pulse velocity. The best fit curve
that represents the relationship for the combined method has the
following equation:
fc (V) = -173.04+4.07V2+57.96V+1.31R
Where V is the ultrasonic pulse velocity and R is the rebound
number.
Aydin and Saribiyik [16] carried out an experimental
investigation to develop a relationship and correlation between
rebound hammer test (NDT) and compression test (DT). Cube
specimens of size 15*15*15cm and a no. of core samples from
different RC structures were tested. Rebound hammer test and the
compressive test was performed on the specimens. The curves were
drawn and the best fit correction factors for concrete compressive
strength were obtained through processing the correlation among
the datasets. The results drawn from the investigation showed that
use of rebound hammer test on existing buildings was not found
suitable for evaluation of strength in old structures of concrete.
Results also revealed that rebound hammer tests could be used
alone as a reliable means to estimate the strength of concrete
specimens if the needed calibrations were done (Table 4).
Table 4: .Regression outputs for 28 and 90 days concrete specimens (Aydin and Saribiyik, 2010).

Turgut and Kucuk [17] carried out an experimental study to
compare direct, indirect and semi-direct UPV testing on 30 concrete
blocks of size (30x30x25cm) at 28 days. 6 locations were taken
in each measurement for each concrete block with path lengths
of 250, 150, and 195 for direct, indirect, and semi-direct testing
respectively. Results showed that average direct UPV was 9% higher than
indirect and semi-direct UPV in concrete blocks. Results also
showed that direction of casting in concrete affected UPV. It was
found out that UPV was less in concrete casting direction than in
horizontal direction. The regression analysis was carried out and
best fit lines representing the relationships have been summarized
in Table 5.
Table 5: Correlations between UPV measurements (Turgut and Kucuk, 2006).

Conclusion
It has been seen from the literatures reviewed that both the
destructive and non-destructive tests help in assessing the strength
of concrete. At times where the destructive tests on concrete cannot
be employed, one prefers to utilize the non-destructive tests. NDT
has a vital role in everyday life and is very important to ensure
reliability and safety. A number of advantages were discussed
for the various tests that are a part of NDT. The researchers at
various instances found that the combination of the NDT tests
proves to be more accurate and beneficial than one of the tests
alone. The results drawn from the investigations also showed that
use of rebound hammer test on existing buildings was not found
suitable for evaluation of strength in old structures of concrete and
rebound test was useful in finding the early strength of concrete.
Results revealed that It was concluded by various researchers
that regression models for the assessment of strength could be
used for prediction of concrete strength. Thus, it is concluded that
using more than one NDT provides a better correlation and lead
to predictable evaluation of concrete’s strength. The results also
revealed that combined methods appeared more appropriate
on conditions of on-site measurements as they were very fast,
convenient and cost-efficient.
Read More About Lupine Publishers Journal of Civil Engineering and its Architecture Please Click on Below Link: https://lupinepublishers-civilengineering.blogspot.com/