The main objective of the research is to develop pan bread
nutritional value through fortification with high concentration of live
yeast cells (Saccharomyces Cerevisiae). Fortified pan bread boosts the
nutritional status of poor people and reduces the incidence
of infertility diseases. The bread was reformulated by adding various
concentrations of S. Cerevisiae at 5, 10, 15, 20 and 30g/
kg wheat flour. The bread was baked using the straight dough method.
Protein, carbohydrate, moisture, fat, vitamin B complex,
minerals, energy value, amino acids profile and Sensory evaluation were
conducted on the fortified pan bread were evaluated.
Results revealed that the carbohydrate, moisture, vitamin B complex,
minerals, protein content and amino acids pattern increased
with the increase in concentration of S. Cerevisiae. The sensory test
showed that pan bread fortified with S. Cerevisiae concentration
at 5, 10, 15 &20g/kg wheat flour were accepted by panelists, while
pan bread at 30g/kg concentration was unacceptable. This study
shows the potential of using high concentration of S. Cerevisiaein
improving protein quality and nutritional value of pan bread
consumed by economically disadvantaged communities.
Keywords: Bread; Fortification; Nutrition; Protein Amino Acids; Yeast; Saccharomyces Cerevisae; Carbohydrate; Vitamin
Supplements; Nutritional Yeast; Biomass Production; Sensorial Quality
Introduction
Bread is the main product of wheat which is manufactured
commercially. Eating grain foods, like bread consumed a lot by
economically disadvantaged communities. it is plays an important
role in the diet by providing many nutrients, such as carbohydrate,
Protein, dietary fiber, vitamins and minerals, which are vital for
the health and maintenance of the body Pareyt [1]. But wheat
flour which is the basic ingredient in bread is lack crucial nutrients
such as essential amino acid lysine and B complex vitamins
Wardlaw [2]. One way of improving the nutritional quality of
pan bread is fortification with bakery yeast Saccharomyces
Cerevisiaeto enhancing bread protein content Friedman & Finot
[3]. Saccharomyces Cerevisiae has high nutritional value is rich in
content of the proteins, vitamin B complexes and minerals such as
calcium, phosphorus, manganese, magnesium, zinc and copper and
has high biological value of essential and nonessential amino acids
so it has several health benefits Shrinandan [4]. Saccharomyces
Cerevisiae as a single cell protein is a rich source of proteins which
are necessary for replacing worn out tissues or recovery after
infections and contains 18 amino acids and is considered to be 55%
high quality protein. It is a rich source of B vitamins which aid in
lowering stress, help in metabolism, prevent cancer and ensure
a healthy skin and it is low in fat and hence low in cholesterol
content it maintains optimum cholesterol levels, improves blood
production and also improves liver health and function Bekatorou
Saccharomyces Cerevisiae also contains gluthanione, an antioxidant
and beta glucan which stimulates the immune system Hong [5]. Of
the 15 minerals that it contains, Saccharomyces Cerevisiae consists
of chromium a trace mineral which is known as glucose tolerance
factor which is essential in the prevention of diabetes, lowers
blood pressure and fluctuating blood sugar Zetic [6]. Production of
proteins from Saccharomyces Cerevisiae (Biomass) is advantageous,
because of high protein content and short growth times, leading to
rapid biomass production be propagated using cheap raw materials
and easily harvested due to their bigger cell sizes and flocculation
abilities so it is utilized by biscuits manufacturing companies, as
vitamin supplements. It is also used in pharmaceuticals and animal
feeds as a source of proteins and vitamin supplements Yamada
& Sgarbieri [7]. This work aims at using increased concentration
of Saccharomyces Cerevisiae biomass as live cells to be added to
bread dough for the formation of high protein content of bread for
promoting good health. This was performed by determining the
proximate chemical composition, vitamins, minerals, amino acids
profile and sensory evaluation tests of bread.
Material and Method
Starter cultures
A commercial mesophilic Saccharomyces Cerevisiae starter
culture obtained from (Pakmaya instant yeast, made in Turkey by
Pak Gida) was used in bread manufacture as a negative control.
One selected strain MY Saccharomyces Cerevisiae from my
identified yeasts isolation (my previous work in protein research
department- GEBRI/ SRTA- City) was used in four treatments and
positive control to improve, increasing protein and amino acids
content, fortification and enhances the flavor and texture of bread.
MY Saccharomyces Cerevisiae was grown in YPD medium (10g/L
yeast extract; 20g/L peptone; 20g/L glucose) broth at 30-35oC for
24-48h. then centrifuged on sterilized cups at 3000rpm in 25oC
for 10 min to remove broth medium, then inoculated overnight in
sterilized skim milk at 30 - 35oC, then re-centrifuged to get mediumfreelive
cells. The viable count of Saccharomyces Cerevisiae after
incubation was 6-8×10⁴ CFU/g by Homothito meter method.
Bread Preparation by Straight-Dough Method
The straight dough method is the easiest of the dough-making
methods where all the ingredients are mixed at the same time in
the mixer as described by Ayele [8] with some modification. The
bread was reformulated by adding a commercial Saccharomyces
Cerevisiae starter culture at 5g/kg wheat flour as a negative
control, and selected strain MY Saccharomyces Cerevisiae at 5g/
kg wheat flour as positive control. Several of MY Saccharomyces
Cerevisiae at concentrations of 10g/kg, 15g/kg, 20g/ kg and 30g/
kg wheat flour were prepared. Wheat flour was mixed with salt
(10g/kg), sugar (30g/kg), live cell of starter culture Saccharomyces
Cerevisiae (divided for negative control, positive control and other
treatments) and water to make dough. Proofing of the dough was
done at a standard time of 50 - 60 minutes at 30-35oC as first
fermentation, then divided to five parts for positive control and
treatments. More addition of Saccharomyces Cerevisiae live cells at
5, 10, 15, 25g /kg dough were added then putt in stainless pans
and left for another 30 minutes as a final proofing step (second
fermentation).Treatment and control baked in the electric oven at
250°C for 20min., then cooled for 2h., baked breads were packed
in low-density polyethylene plastic bags and stored for three
days at room temperature (24 ± 2°C).These dough mixtures and
bread samples were evaluated for nutritional value and sensory
evaluation.
Quality attributes evaluation
Proximate chemical composition
a) Moisture content
The sample (5g) was transferred into a Petri-dish of known
weight. The weighed sample was put into an oven at 105 oC until
constant weight was obtained AOAC [9]. The difference between the
initial and final weight of the sample was recorded as the moisture
content.
b) Determination of total carbohydrate
Determination of total carbohydrate was done using the
phenol-sulfuric acid method as described by DuBois [10]. The total
concentration of Carbohydrate obtained from bread samples was:
Total carbohydrate (%) = (carbohydrate content from calibration
curve/weight of sample) x 100.
c) Determination of crude protein
Nitrogen content was determined after digestion of about 0.5g
sample by micro-Kjeldahl method and the ammonia was received
in 4% boric acid according to the method of AOAC [9]. The crude
protein (%) was determined by multiplying the total nitrogen by
factor of 6.25.
d) Determination of fat content
Crude fat content was determined after extraction of 3.5 g
sample with 50 mL diethyl ether by Soxhlet extraction method.
The solvent was evaporated. The residue was recorded as crude fat
content according to AOAC [9].
e) Determination of Energy value: Energy value (kcal per
100 g) was estimated using the Atwater conversion factor (Osborne
& Voogt [11].
Energy (kcal per 100 g) = [9 × Lipids% + 4 × Proteins% + 4 ×
Carbohydrates%].
f) Determination of Vitamin B complex: The vitamin B
group was extracted according to a previously described method
(AOAC1990) the prepared sample was injected into the HPLC
system. Quantification of vitamin B content was accomplished
by comparison to vitamin B standards. Standard stock solutions
for Thiamine,Riboflavin, Niacin, Pyridoxine, and Cobalamin were
prepared as reported previously Aslam [12] and Ringling [13]
.Chromatographic separation was achieved on a reversed phase-
(RP-) HPLC column(Agilent ZORBAX Eclipse Plus C18; 250 × 4.6mm
i.d., 5𝜇m) through the isocratic delivery mobile phase (A/B 33/67;
A: MeOH, B: 0.023M H3PO4, pH = 3.54) at a flow rate of 0.5mL/
min. Ultraviolet (UV) absorbance was recorded at 270nm at room
temperature Marzougui [14] and Rokayya [15].
g) Determination and analysis of Minerals: The
mineral contents were assessed by flame atomic absorption
spectrophotometer (FAAS - Analytik Jena, Germany) according to
AOAC Official Method 985.35 [16] then expressed in fresh weight
(mg/100g).
h) Determination of Amino Acids: Amino acids have been
extracted from the wheat bread according to Knežević [17]. Each of
the defatted samples was weighed (200mg) in to a glass ampoule,
5ml of 6N HCl/L was added to the ampoule, and the contents were
hydrolyzed in an electric oven preset at 105°C for 22h. Oxygen was
expelled in the ampoule by passing nitrogen gas in to it. Amino acid
analysis was done by (SYKAM S433 Amino Acids Analyzer). The
analysis was carried out with a gas flow rate of 0.5ml/min at 60°C,
and the reproducibility was 3%. The amino acid composition was
calculated from the areas of standards obtained from the integrator
and expressed as percentages of the total protein according to
Trajković [18].
i) Sensory Quality Attributes: Sensorial quality was
evaluated by a10-panalists, from dept. of food science to score
quality attributes of bread. Samples were scored for overall visual
quality by using an interval hedonic scale, where the extremes and
center of the interval were represented as follows: zero (dislike
extremely, no characteristic of the product), 5 (neither like nor
dislike, limit of acceptance from the consumer’s point of view), and
10 (like extremely, very characteristic of the product). The tested
attributes such as texture, taste, odor, color and appearance and
overall acceptance were evaluated, according to Eddy [19]. The end
of shelf-life was reached when the average value of the samples was
judged as unacceptable for consumption by the sensory panel.
j) Statistical analysis: All results were presented as means
± standard deviation (SD). (n =3) Values were statistically analyzed
by one-way analysis of variance (ANOVA test) according to Steel
[20] using SPSS 22 software package. Differences were considered
significant at (P values) less than 0.05 using Duncan Multiple Range
test.
Results and Discussion
Nutrient Analysis
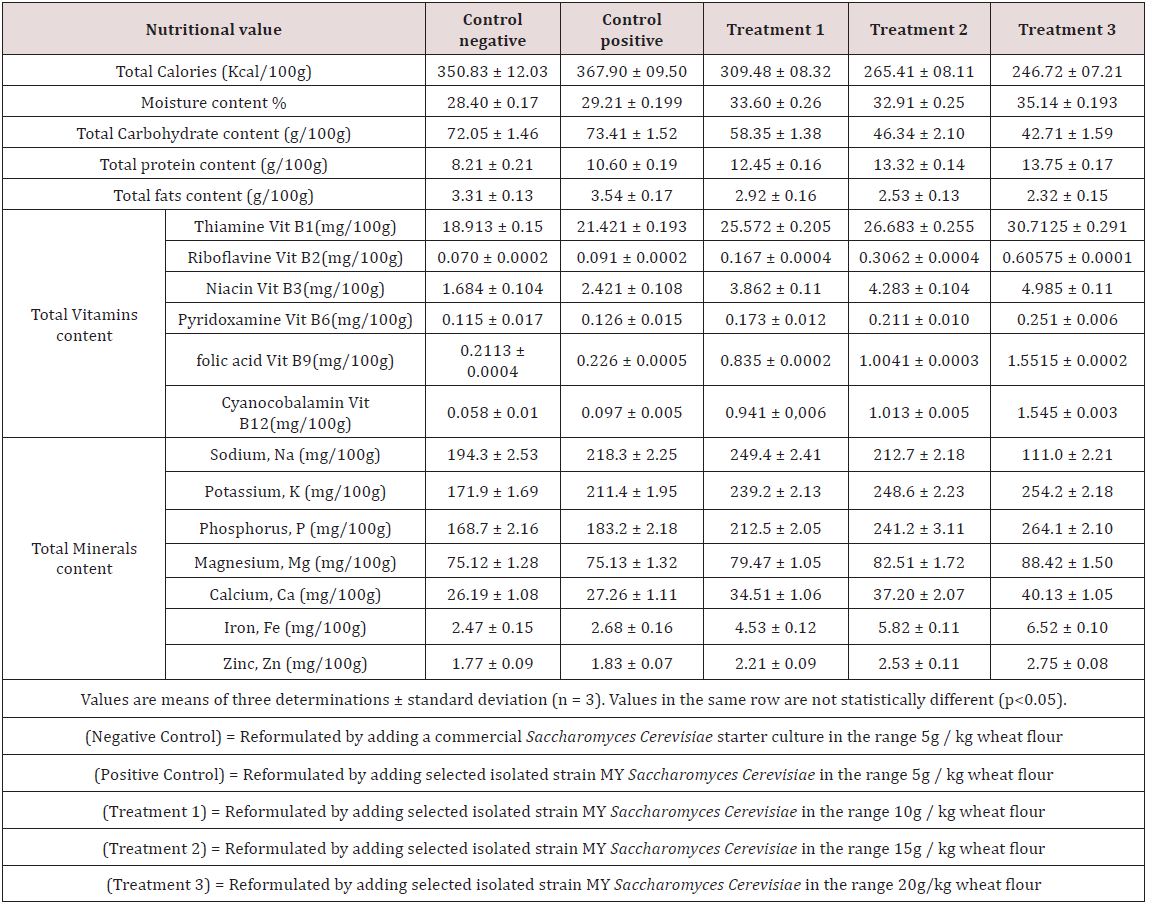
Table 1 shows the nutrient composition of bread. An increase in
nutritional yeast concentration resulted in increase in the protein
content of bread. Similar results were reported by Shogran [21]
Udofia [22] Noorfarahzilah [23] and Masamba [24].The nutritional
yeast used to fortify bread contains high quality protein which was
reflected in the fortified bread. Proposed that nutritional yeast is
a rich source of protein. Therefore the consumption of nutritional
yeast fortified bread means exposure to higher quantity and quality
protein Goesaert [25] and Gary [26]). The nutritional yeast fortified
bread had a slightly higher content of carbohydrate, moisture
and B complex vitamins (Thiamine B1, Riboflavine B2, Niacin B3,
Pyridoxamine B6, folic acid B9 and Cyanocobalamin B12) compared
to the non-fortified bread sample. These results are in agreement
with Ndife [27] and Pareyt [1]. Table 1 revealed also that the
fortified bread had higher content of minerals such as (Potassium,
Phosphorus, Magnesium, Calcium, Iron and Zinc) compared to the
non-fortified bread sample. These results are in agreement with
Nwanekezi [28]. It was also noted that lipids and Sodium content
were lower in fortified bread because of the addition volume of
nutritional yeast. These results are in agreement with (Mashayekh
[29] Sanful [30] [Table 1].
Table 1: Means of nutritional value of fortificated bread as influenced by adding three different concentrations of active Saccharomyces
Cerevisiae.
Sensory Evaluation
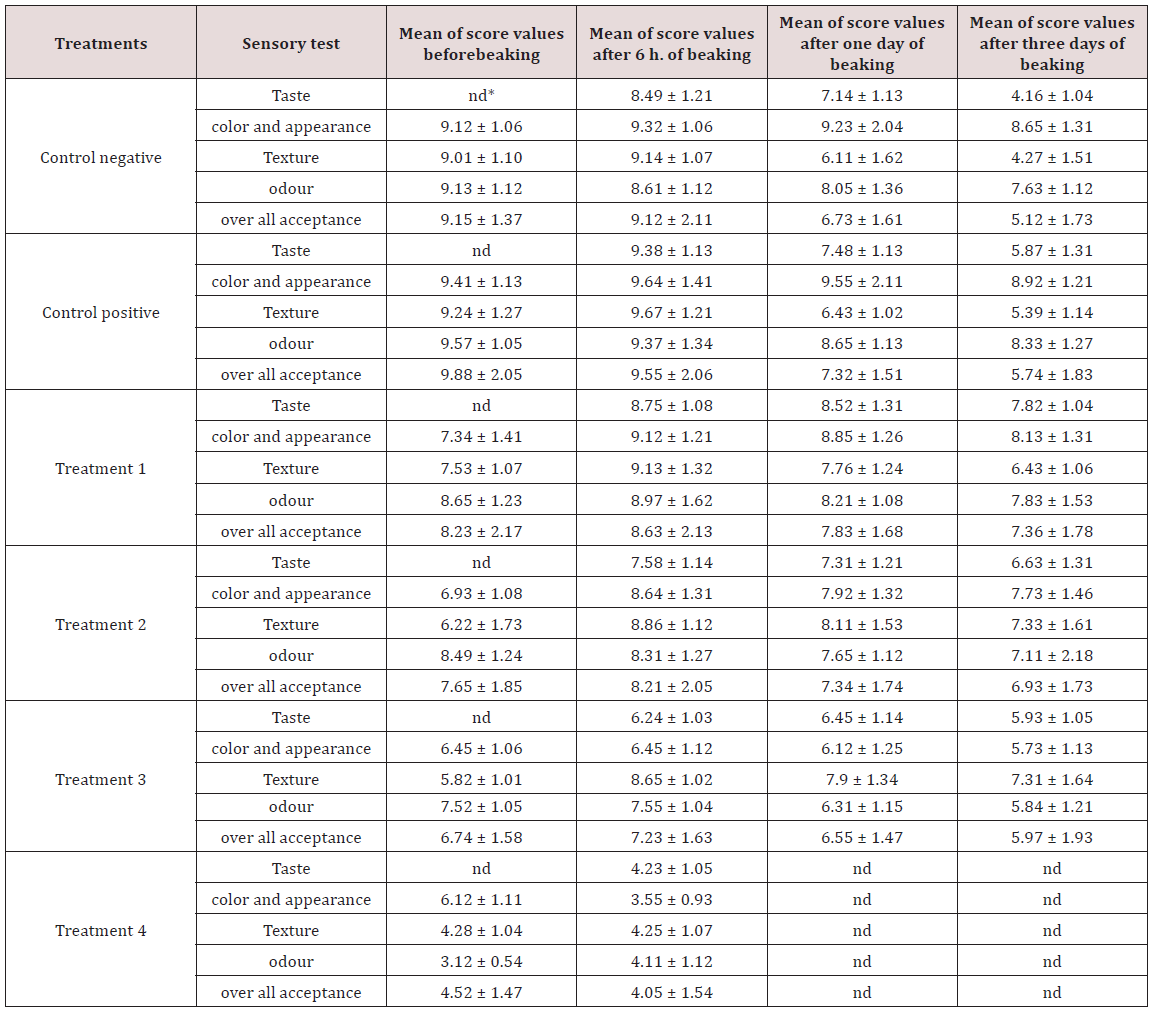
Color and Appearance of Bread: Data in Table 2 shows people
responses to the appearances of bread samples. All the bread samples
were baked using white flour and the change in color was a result
of incorporation of different nutritional yeast concentrations. The
darker color noticed in bread samples with higher concentrations
of nutritional yeast was a result of enhanced Maillard reactions
[42] between reducing sugars and proteins. Vaclavik and Christian
[43] described appearance of food as the size, color, structure,
transparency of turbidity and degree of wholeness or damage of
the product. Structure and color are important in baked goods
for example bread should have white and brown color and should
have many holes uniformly spread throughout otherwise a slight
drift from normal will be judged as a quality defect. Most people
referred the appearance of bread sample T1 since it resembled the
color of brown bread available on commercial market. This shows
that many consumers prefer brown bread to white bread when
considering color only. Sample T3was regarded as unacceptable by
the respondents due to its dark brown color which they perceived
as unattractive.
Taste of Bread:b Taste was the main attribute in rating of the
samples since addition of the nutritional yeast had an effect of
changing the taste of the bread. Tepper and Ulrich [44] defined
taste as a combination of five major tastes: salty; sweet; sour; bitter
and umami. Taste is detected by taste buds at the tips, sides and
back of the tongue and the sensitivity to a particular taste depends
on the concentration of the substance responsible for the taste.
The responses to the taste of different bread samples are shown in
Table 2 the respondents liked the taste of sample T1 most largely
because it had the taste of what they already perceive as normal
and fresh bread taste. Samples T2 and T3 had low scores due to
the cheese like taste of the nutritional yeast which was appealing
to most respondents who originally prefer cheese. Bread sampleT4
was regarded as unacceptable for human consumption as a result
of a bitter aftertaste experienced by the consumers.
Table 2: Means of sensory score values of bread as influenced by adding four different concentrations of active yeast.
Values are means of three determinations ± standard deviation (n =
3). Values in the same row are not statistically different (p<0.05).
(Negative Control) = Reformulated by adding a commercial Saccharomyces
Cerevisiae starter culture in the range 5g / kg wheat flour
(Positive Control) = Reformulated by adding selected isolated strain MY
Saccharomyces Cerevisiae in the range 5g / kg wheat flour
(Treatment 1) = Reformulated by adding selected isolated strain MY Saccharomyces Cerevisiae in the range 10g / kg wheat flour
(Treatment 2) = Reformulated by adding selected isolated strain MY Saccharomyces Cerevisiae in the range 15g /kg wheat flour
(Treatment 3) = Reformulated by adding selected isolated strain MY Saccharomyces Cerevisiae in the range 20g /kg wheat flour
(Treatment 4) = Reformulated by adding selected isolated strain MY Saccharomyces Cerevisiae in the range 30g /kg wheat flour
Flavor of Bread: Flavor is one of the major sensory properties
which are decisive in acceptance and selection. Vaclavik and
Christian [43] defined flavor as a combination of smell and taste
which is largely subjective. Table 2 shows consumer responses to
bread flavor of different nutritional yeast concentration. As the
level of nutritional yeast increased, the typical flavor associated
with bread decreased. The respondents accepted flavor of bread
samples T1, T2 and T3 but rejected bread samples T4 as a result of
strong yeast smell. Consumers are more likely to accept products
that they are familiar with. Any deviation in flavor is deemed as
quality defect.
Bread Texture: Texture refers to those qualities of food that
can be felt with fingers, tongue, palate or teeth Murano [34]. The
texture of bread samples is shown in Table 2. The respondents
found the texture of samples T1, T2 and T3 as highly acceptable.
Sample T4was regarded as unacceptable in terms of texture due to
the high amounts of moisture in the bread samples which resulted
in a lumpy crumb structure instead of an open texture.
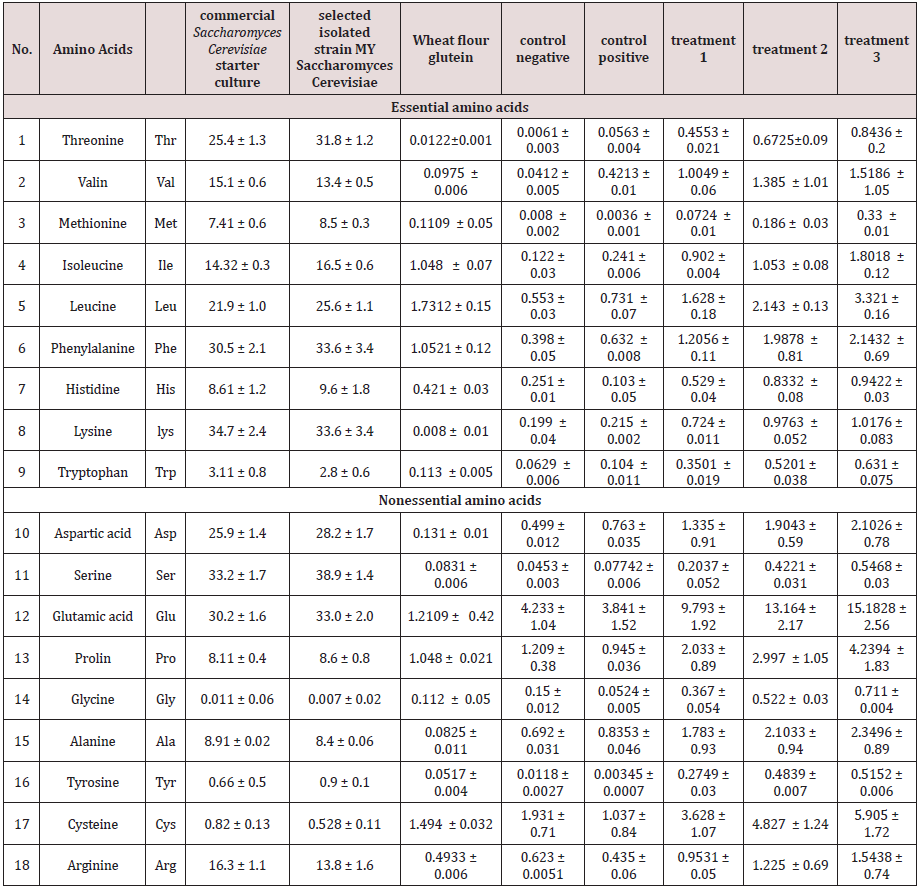
Amino acids Analysis: The results of Table 3 the qualitative
analysis showed the variability in the amino acid composition in
the examined wheat genotype. For all analyzed cultivars have
been identified 18 different amino acids. These results suggest
that wheat flour and non-fortified bread protein is deficient in
certain essential amino acids, such as lysine, tryptophan, threonine,
methionine and histidine. Wheat protein is rich in glutamic acid
and proline, which are the dominating non- essential amino acids.
Paterson [35] also reported the deficiency of lysine, tryptophan
and methionine in wheat protein; likewise Khan [36] reported that
lysine is the limiting essential amino acid in wheat grain protein.
In contrast fortified bread treatments showed highly increase
in certain essential and non- essential amino acids. At the same
time it should be noted that the lysine has been higher increase
value in fortified bread treatments which is in agreement with
the experience of Yalçın [37] who used a similar technique with
fortified bread. According to the results of the analysis the most
present amino acids in the examined wheat flour were glutamic acid,
glycine, sarcosine, valine, norvaline and tryptophan. It is well
known, that glutamic acid and glycine are principal amino acids in
all cereal protein fractions. Likewise Sejian [38] and Knezevic [39]
found that increase in the protein content of wheat grain showed
differences among wheat genotypes. Considering that amino acid
composition of wheat flour proteins is genetically determined, it
mean that changes of amino-acid composition is possible realize
through changes of backing proceed. Similar results were reported
by Paterson [35] there was a significant loss of lysine when dough
is baked into bread. Ahmad & Hussain [40] and Jensen [41] also
reported negative relation between the protein and lysine content
of wheat (Table 3).
Table 3: Means of Amino acids concentration value of wheat flour and fortificated wheat bread as influenced by adding three
different concentrations of active Saccharomyces Cerevisiae as (mg/gm).
Values are means of three determinations ± standard deviation (n =
3). Values in the same row are not statistically different (p<0.05).
(Negative Control)= Reformulated by adding a commercial Saccharomyces
Cerevisiae starter culture in the range 5g / kg wheat flour
(Postive Control)= Reformulated by adding selected isoleted strain MY Saccharomyces Cerevisiae in the range 5g / kg wheat flour
(Treatment 1)= Reformulated by adding selected isoleted strain MY Saccharomyces Cerevisiae in the range 10g / kg wheat flour
(Treatment 2)= Reformulated by adding selected isoleted strain MY Saccharomyces Cerevisiae in the range 15g / kg wheat flour
(Treatment 3)= Reformulated by adding selected isoleted strain MY Saccharomyces Cerevisiae in the range 20g / kg wheat flour
Conclusion
The protein content spatially essential amino acids content
of the homemade bread was improved through nutritional yeast
fortification. The carbohydrate, B complex vitamins and minerals
content of the fortified bread were improved. The flavor and taste
greatly influenced consumer acceptance of the product. Addition
of artificial flavorings to mask the strong flavor of the nutritional
yeast could help improve the taste and consumer acceptability
of the fortified bread. For increasing of amino acid content as
well composition of free essential amino acids in grain of wheat
we need to increase our knowledge about mechanisms of the
control grain protein accumulation at the molecular, biochemical
and physiological levels. Also, for improving nutritional value are
necessary to select wheat genotypes in terms of essential amino
acids content and higher protein content.
Read More About Lupine Publishers Journal of Dairy & Veterinary Sciences Please Click on below Link:
https://lupine-publishers-dairy-veterinary.blogspot.com/