Showing posts with label Journal of Material Science Impact factor journals. Show all posts

Monday, 6 March 2023

Lupine Publishers| What is Quantum Computing and How it Works, Artificial Intelligence Driven by Quantum Computing

  Lupine Publishers| Journal of Material Science


Abstract

Companies such as Intel as a pioneer in chip design for computing are pushing the edge of computing from its present Classical Computing generation to the next generation of Quantum Computing. Along the side of Intel corporation, companies such as IBM, Microsoft, and Google are also playing in this domain. The race is on to build the world’s first meaningful quantum computer-one that can deliver the technology’s long-promised ability to help scientists do things like develop miraculous new materials, encrypt data with near-perfect security and accurately predict how Earth’s climate will change. Such a machine is likely more than a decade away, but IBM, Microsoft, Google, Intel, and other tech heavyweights breathlessly tout each tiny, incremental step along the way. Most of these milestones involve packing more quantum bits, or qubits-the basic unit of information in a quantum computer-onto a processor chip ever. But the path to quantum computing involves far more than wrangling subatomic particles. Such computing capabilities are opening a new area into dealing with the massive sheer volume of structured and unstructured data in the form of Big Data, is an excellent augmentation to Artificial Intelligence (AI) and would allow it to thrive to its next generation of Super Artificial Intelligence (SAI) in the near-term time frame.

Keywords: Quantum Computing and Computer, Classical Computing and Computer, Artificial Intelligence, Machine Learning, Deep Learning, Fuzzy Logic, Resilience System, Forecasting and Related Paradigm, Big Data, Commercial and Urban Demand for Electricity

Introduction

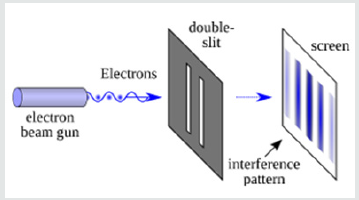
Quantum Computing (QC) is designed and structured around the usage of Quantum Mechanical (QM) concepts and phenomena such as superposition and entanglement to perform computation. Computers that perform quantum computation are known as Quantum Computers[1-5].Note that the superposition from a quantum point of view is a fundamental principle of quantum mechanics. The Quantum Superposition (QS) states that, much like waves in Classical Mechanics (CM) or Classical Physics (CP), any two or more quantum states can be added together (“superposed”), and the result will be another valid quantum state; and conversely, that every quantum state can be represented as a sum of two or more other distinct countries.Mathematically, it refers to a property of solutions to the both Schrödinger Time-Dependent and Time-Independent Wave Equations; since the Schrödinger equation is linear, any linear combination of solutions will also be a solution.An example of a physically observable manifestation of the wave nature of quantum systems is the interference peaks from an electron beam in a double-slit experiment, as illustrated in (Figure 1).The pattern is very similar to the one obtained by the diffraction of classical waves. [6]. Quantum computers are believed to be able to solve some computational issues, such as integer factorization, which underlies RSA encryption [7], significantly faster than classical computers. The study of quantum computing is a subfield of quantum information science.

Figure 1: Double-Slit Experiment Setup.
Lupinepublishers-openaccess-material-science-journal

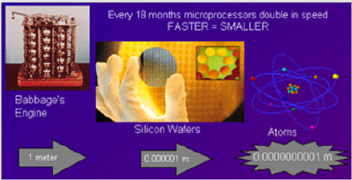
Historically, Classical Computer (CC) technology, as we know them from the past few decades to present, has involved a sequence of changes from one type of physical realization to another, and they have been evolved from main-frame of the old generation to generation of macro-computer. Now, these days, pretty much everyone owns a minicomputer in the form of a laptop, and you find these generations of computers in everyone’s house as part of their household. These mini-computers, Cemeterial Processing Units (CPUs), are based on transistors that are architected around Positive-Negative-Positive (PNP) junction.From gear to relays to valves to transistors to integrated circuits and so on we need automation and consequently augmentation of computer of some sort Today’s advanced lithographic techniques at below sub-micron innovative structure augmenting techniques such as Physical Vapor Deposition (PVD), Chemical Vapor Deposition (CVD), and Chemical Mechanical Polishing (CMP) can create chips with a feature only a fraction of micron wide. Fabricator and manufacturer these chips are pushing them to yield even smaller parts and inevitably reach a point where logic gates are so small that they are made out of only a handful of atoms size, as it is depicted in (Figure 2).

Figure 2: Today’s Chip Fabrication.
Lupinepublishers-openaccess-material-science-journal

It worth mentioning that the size of the chip going way beyond sub-micron technology is limited by the wavelength of the light that is used in the lithographic technique.
On the atomic scale, matter obeys the rules of Quantum Mechanics (QM), which are quite different from Classical Mechanics (CM) or Physics Rules that determine the properties of conventional logic gates. Thus, if computers are to become smaller in the future, new, quantum technology must replace or supplement what we have new as a traditional way of computing.The point is, however, that quantum technology can offer much more than cramming more and more bits onto silicon CPU chip and multiplying the clock-speed of these traditional microprocessors. It can support an entirely new kind of computation with qualitatively new algorithms based on quantum principles! In a nutshell, in Quantum Computing, we deal with Qubits, while in Classical Computing, we deal with bits of information; thus, we need to understand “What Are Qubits?” and how it is defined, which we have presented this matter further down.Next generation of tomorrow’s computer is working based on where “Quantum Bits Compressed for the First Time.” The physicist has now shown how to encode three quantum bits, the kind of data that might be used in this new generation of computer, by just using two photons.Of course, a quantum computer is more than just its processor. These next-generation systems will also need new algorithms, software, interconnects, and several other yet-tobe- invented technologies specifically designed to take advantage of the system’s tremendous processing power-as well as allow the computer’s results to be shared or stored.

Intel introduced a 49-qubit processor code-named “Tangle Lake.” A few years ago, the company created a virtual-testing environment for quantum-computing software; it leverages the powerful “Stampede” supercomputer at The University of Texas at Austin to simulate up to a 42-qubit processor. To understand how to write software for quantum computers, however, they will need to be able to simulate hundreds or even thousands of qubits.Note that: Stampede was one of the most potent and significant supercomputers in the U.S. for open science research. Able to perform nearly ten quadrillion operations per second, Stampede offered opportunities for computational science and technology, ranging from highly parallel algorithms, highthroughput computing, scalable visualization, and next-generation programming languages, as illustrated in (Figure3) here. [8]This Dell PowerEdge cluster equipped with Intel Xeon Phi coprocessors pushed the envelope of computational capabilities, enabling breakthroughs never before imagined. Stampede was funded by the National Science Foundation (NSF) through award ACI-1134872.

Figure 3: Array of Stampede Structure.

Lupinepublishers-openaccess-material-science-journal

Stampede was upgraded in 2016 with additional compute nodes built around the second generation of the Intel Xeon Phi many-core, x86 architecture, known as Knights Landing. The new Xeon Phi’s function as the primary processors in the new system. The upgrade ranked #116 on the June 2016 Top 500 and was the only KNL system on the list.Note that: Knights Landing (KNL) is 2nd Generation of Intel® Xeon Phi™ Processor

What Are Qubits?

A qubit can represent a 0 and 1 at the same time, a uniquely quantum phenomenon known in physics as a superposition. This lets qubits conduct vast numbers of calculations at once, massively increasing computing speed and capacity. But there are different types of qubits, and not all are created equal. In a programmable silicon quantum chip, for example, whether a bit is 1 or a 0 depends on the direction its electron is spinning. Yet all qubits are notoriously fragile, with some requiring temperatures of about 20 millikelvins-250 times colder than deep space-to remain stable. From a physical point of view, a bit is a physical system, which can be prepared in one of the two different states representing two logical values: based on No or Yes, False or True, or simply 0 or 1.Quantum bits, called qubits, are implemented using quantum mechanical two-state systems, as we stated above. These are not confined to their two basic states but can also exist in superposition. This means that the qubit is both in state 0 and state 1, as illustrated in (Figure 4).Any classical register composed of three bits can store in a given moment, only one out of eight different numbers, as illustrated in (Figure 5). A quantum register composed of three qubits can store in a given momentum of time all eight numbers in a quantum superposition, again as illustrated in (Figure5).Once the register is prepared in a superposition of different numbers, one would be able to perform operations on all of them, as demonstrated in (Figure 6)here. Thus, quantum computers can perform many different calculations in parallel. In other words, a system with N qubits can perform 2N calculations at once!

Read More About Lupine Publishers Journal of Material Science Please Click on Below Link:  https://lupine-publishers-material-science.blogspot.com/

Tuesday, 24 January 2023

Lupine Publishers| Monitoring Time-Progression of Structural, Magnetic Properties of Ni Nano Ferrite During Synthesis

 Lupine Publishers| Journal of Material Science


Abstract

We present time-progression of structural, magnetic properties of NiFe2O4 nano ferrite during its synthesis via sol-gel auto combustion technique, monitored by x-ray diffraction XRD, and magnetic measurements. XRD patterns of the samples collected between 18-52 minutes shows the formation of the nano spinel phase (grain diameter: 15.4 nm-28.6 nm), presence of a-Fe2O3phase was also detected. Samples collected between 8-14 minutes show the amorphous nature of the samples. Time-progression studies show: a) sample taken after 20 minutes shows a sharp decrease of specific surface area (range between 39.01 m2/g to 72.73 m2/g), b) non-equilibrium cationic distribution for samples taken between 16-20 minutes with a continuous increase of Fe3+ ions population on B-site with simultaneous decrease of Ni2+ population, c) for samples taken after 22, 52 minutes, cationic distribution is close to its ideal value of (Fe3+) [Ni2+Fe3+], d) alteration of a degree of inversion (d), oxygen parameter (u), modification of A-O-B, A-O-A, B-O-B super-exchange interactions, e) ferrimagnetically aligned core, and spin disorder on the surface with a thickness between 1.9 nm to 3.6 nm, reducing the saturation magnetization (ranging between 11.7 - 25.5 Am2/kg), as compared to bulk Ni ferrite (55 Am2/kg), f) low squareness ratio values (0.15-0.22) shows the presence of multi-domain nanoparticles, with coercivity between 111-157 Oe.

Keywords: Time-evolution of properties; Sol-gel auto combustion synthesis; XRD; Nano Ni ferrite; Cationic distribution; Magnetic properties

Introduction

Spinel ferrites with general formula Me2+O.Fe3+2 O3, [Me: Divalent metal ion e.g. – Ni2+, Zn2+, Mg2+ Co2+ etc.], display face-centered cubic (fcc) structure, with two inter-penetrating sub-lattices: tetrahedrally coordinated (A site), octahedrally coordinated (B site) [1]. Nickel ferrite (NiFe2O4) has inverse spinel structure expressed as: (Fe3+) [Ni2+Fe3+] [1]. Allocation of cations on A, B site is crucial in determining properties of spinel ferrites [2,3], can be effectively used to achieve desired properties. Literature gives Ni ferrite synthesis using various methods including mechanical milling [4], coprecipitation [5], hydrothermal synthesis [6], sol-gel auto combustion method [7], showing the effect of the technique on structural, magnetic properties. Literature also reports real-time monitoring (in-situ studies) of properties [8,9], require special, sophisticated equipment, may not be available in all laboratories. Ex-situ monitoring of properties [10], describing the time-evolution of structural, magnetic properties, is a rather simple, more convenient way to perform experiments by utilizing standard laboratory equipment available in many laboratories. Ni ferrite is used in magnetic resonance imaging (MRI) agents [5], photocatalysis for water purification, antimicrobial activity [11], etc.) hence tuning its properties are preferred for improved efficiency.So, in this work, we present the time-development of structural, magnetic properties of NiFe2O4 nano ferrite during its synthesis via sol-gel auto combustion technique. Prepared samples are investigated via x-ray diffraction 'XRD,' vibration sample magnetometry, to get complimentary information on structural, magnetic properties.

Experimental Details

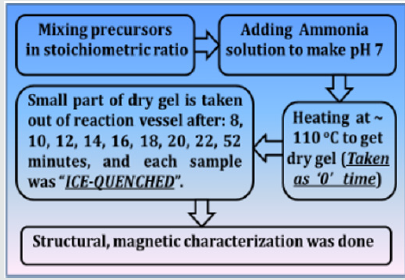
NiFe2O4 ferrite samples were synthesized by the sol-gel auto-combustion protocol, as described in detail in [12], by utilizing AR grade -nitrate/acetate-citrate precursors: Nickel acetate - Ni(CH₃CO₂)₂·4H₂O, Ferric nitrate (Fe(NO3)3.9H2O), Citric acid - C6H8O7]. The precursors were mixed in the stoichiometric ratio, were dissolved in 10 ml de-ionized water by keeping metal salts to fuel (citric acid) ratio as 1:1. At the same time, the solution pH was maintained at 7. Now the solution was heated at ~110 ̊C. As dry gel starts to form (taken as 0 minutes) small part of the sample is taken out from the reaction vessel (in an interval of 8, 10, 12, 14, 16, 18, 22, and 52 minutes), and were immediately ice-quenched to room temperature. Powder samples were used for Cu-K- X-ray diffraction 'XRD' measurements (Bruker D8 diffractometer), hysteresis loops by vibrating sample magnetometer. Full-profile XRD analysis was done by MAUD Rietveld refinement software [13] to obtain the lattice parameter (apex.). XRD analysis gives Scherrer's crystalline size D (calculated by the integral width of 311 peak, corrected for instrumental broadening), specific surface area (S), inversion parameter (d), oxygen parameter (u). XRD data was also analysed to get cationic distribution via Bertaut method [14], This provides cationic distribution by comparing experimental and computed intensity ratio of planes I(220)/I(400) and I(400)/I(422), susceptible to cationic distribution [12]. Cationic distribution was used to calculate theoretical or Néel magnetic moment at 0K (Ms(th)), theoretical lattice parameter (ath.), bond angles (θ1, θ2, θ3, θ4, θ5) as shown in [3]. Coercivity (Hc), saturation magnetization (Ms), remanence (Mr), squareness ratio (Mr/Ms) was obtained from hysteresis loops. (Figure 1) gives the schematic of sample synthesis and characterization.

Figure 1: Schematic of sample synthesis and characterization.

Lupinepublishers-openaccess-material-science-journal

Results and Discussion

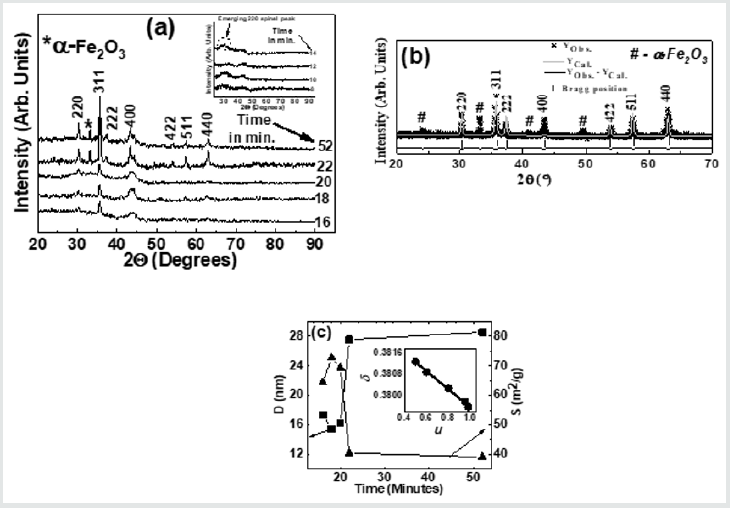
(Figure 2) (a) gives XRD-patterns of the studied NiFe2O4 samples collected after 18, 20, 22, and 52 minutes, confirm the formation of the spinel phase. XRD patterns also show the presence of a-Fe2O3 phase, ascribable to sample synthesis at a reasonably lower temperature (~110̊C), as reported in [15], while its disappearance is seen after higher sintering temperature. Figure 1(a) inset shows XRD patterns of samples collected after 8, 10, 12, 14 minutes show the amorphous nature of the samples. Only in the sample collected after 14 minutes, there is the start of spinel phase formation (indicated by a dotted circle). Illustrative Rietveld refined XRD pattern (Figure 2) b) of NiFe2O4 sample taken after 20 minutes also validates the cubic spinel ferrite phase formation. (Figure 2)(c) shows a variation of D (range between 15.4 nm to 28.6 nm) and S (range between 39.01 m2/g to 72.73 m2/g) for NiFe2O4 samples taken after 16, 18, 20 22, 52 minutes. A perusal of (Figure 2) (c) shows a well-known inverse relationship shown by the expression: [S = [6/(D ´rXRD)], where rXRDis x-ray density, as was also reported in[2]. (Figure 2) (c) shows that for samples taken after 22, 52 minutes, D sharply increases with concurrent reduction of S, is ascribable to significant changes in cationic distribution via migration of Ni2+ions to B site with simultaneous migration of Fe3+ ions on A site(as can be seen in Table 1). (Figure 2 )(c) inset display linear relation between d and u as was also observed earlier [3], shows that reduction of the degree of inversion (d) leads to a reduction of oxygen parameter (u), a measure of disorder in the studied system, is expected to affect the properties of the studied samples. Table 1 depicts the variation of experimental and theoretical lattice parameter (aexp., ath. ), inversion parameter (d), oxygen parameter (u), Cation distribution (for A, B site), and calculated, observed intensity ratios for I400/422, I220/400 plane for the studied samples. The observed variation of aexp. is consistent with changes in cationic distribution, and variation of the degree of inversion (d). Close agreement between observed, calculated aexp., ath. suggests that the computed cationic distribution agrees well with real distribution [16]. Close matching of calculated, observed intensity ratios for I400/422, I220/400 signifies an accurate cationic distribution among A, B site [17]. Cationic distribution illustrates that as we go from NiFe2O4 samples taken after 16, 18, and 20 minutes, the population of Fe3+ ions on B site increases from 1.2 to 1.5 with a concurrent decrease of Ni2+ ions from 0.80 to 0.50. For samples taken after 22, 52 minutes Fe3+ population on B site decreases, while Ni2+ ion population increases up to 0.98, which is close to the ideal inverse cationic distribution of (Fe3+) [Ni2+Fe3+] [1].

Figure 2: (a): XRD patterns of the studied NiFe2O4 samples taken after 16, 18, 20 22, 52 minutes showing the formation of the spinel phase. Inset: XRD patterns of the studied samples taken after 8, 10, 12, 14 minutes. (b): Illustrative Rietveld refined XRD pattern of NiFe2O4 sample taken after 20 minutes (* - Experimental data, Solid line - theoretically analyzed data, |- Bragg peak positions, Bottom line- Difference between experimental, and fitted data). (c) variation of grain diameter (D) and specific surface area (S) for NiFe2O4samples taken after 16, 18, 20 22, 52 minutes. Line connecting points guide to the eye. Inset: variation of inversion parameter (d) with oxygen parameter (u). The straight line is a linear fit to the experimental data.

Lupinepublishers-openaccess-material-science-journal

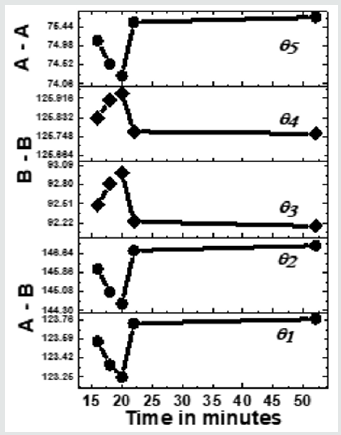
Figure 3 depicts the variation of bond angles between cations, cation-anion q1, q2,q3, q4and q5, for the studied samples taken between 16 - 52 minutes. In samples taken after 8, 10, 12, and 14 minutes, due to the absence of the spinel phase, bond angles could not be computed. Bond angles provide information on super-exchange interaction (A-O-B, A-O-A, B-O-B), mediate by oxygen. (Figure 3) shows that for samples taken after 16, 16, 20 minutes q1, q2, q5, decreases while q3, q4increases, indicates a weakening of A–O–B, A– O–A and strengthening B–O–B super-exchange interaction as is also observed earlier [16]. For samples taken after 22, 52 minutes q1, q2, q5, increases, and q3, q4decreases reveals strengthening of A-O-B, A-O-A, and weakening of B-O-B super-exchange interaction, reported in the literature with compositional changes [3]. Samples taken after different times, there is a modification of A-O-B, A-O-A, B-O-B super-exchange interactions, are attributed to changes in dand u as shown in(Table 1), observed with compositional changes [3,16]. Observed A-O-B, A-O-A, B-O-B super-exchange interactions should mirror in magnetic properties, matches well with reported literature [3,16]. Thus, collecting samples after different times during synthesis is analogous to compositional changes in spinel ferrites, affects structural, magnetic properties [3, 12, 16, 18].

Figure 3: Dependence of bond angles (q1A-O-B,q2A-O-B, q3B-O-B,q4B-O-B, q5A-O-A) for NiFe2O4 samples taken after 16, 18, 20 22, 52 minutes. Line connecting points guide to the eye.

Lupinepublishers-openaccess-material-science-journal

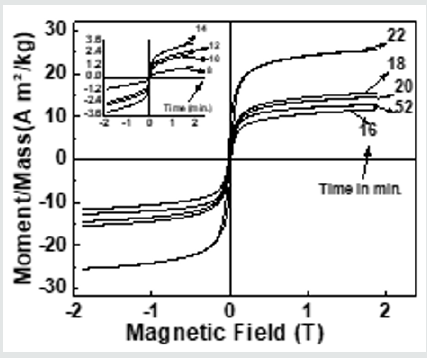
Figure 4 depicts hysteresis loops, reveal changes in Ms(exp.)samples taken after 16, 18, 20 22, 52 minutes, attributable to alteration of B-O-B, A-O-B, and A-O-A interaction, depends on bond angles, as shown in (Figure 3), and cationic distribution, as shown in (Table 1). (Figure 4) inset displays hysteresis loops of the samples taken after 8, 10, 12, 14 minutes, showing very low magnetization, attributable to the fact that in these samples ferrite phase is not formed, as was also observed in XRD data shown inset of (Figure 2) (a). Observed lower values of Ms(exp.) (ranging between 11.7 - 25.5 Am2/kg) as compared to the multi-domain bulk Ni ferrite (55 Am2/kg) is attributed to the two-component nanoparticle system as described in [19]consisting of a spin-disorder on the surface layer and ferrimagnetically aligned spins within the core. Computed magnetic dead layer thickness as described in [20,21]for NiFe2O4 samples taken after 16, 18, 20 22, 52 minutes are respectively 2.3, 1.8, 1.9, 2.5 and 3.6 nm. They confirm the contribution of 'dead layer thickness' in the reduction of Ms(exp.), apart from B-O-B, A-O-B, and A-O-A super-exchange interaction and cationic distribution.

Figure 4: Hysteresis loops of the studied NiFe2O4 samples taken after 16, 18, 20 22, 52 minutes. Inset: Hysteresis loops of the samples taken after 8, 10, 12, 14 minutes.

Lupinepublishers-openaccess-material-science-journal

Table 1: Variation of experimental and theoretical lattice parameter (aexp., ath.), inversion parameter (), oxygen parameter (u), Cation distribution (for A, B site), and observed, calculated intensity ratios for I400/422, I220/400 plane for the studied samples.

Lupinepublishers-openaccess-material-science-journal

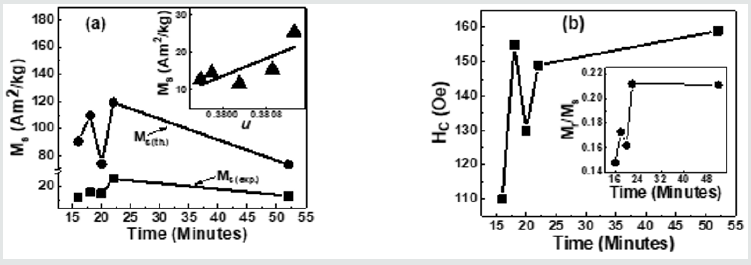
Figure 5(a) depicts Variation of Ms(exp.), Ms(th.)for NiFe2O4 samples taken after 16, 18, 20 22, 52 minutes. A perusal of figure 5(a) shows that observed behaviour is attributable to alteration of B-O-B, A-O-B, and A-O-A super-exchange interaction, depends on bond angles (see figure 3), and cationic distribution (see Table 1). Non-similar trend of Ms(exp.), Ms(th.)in (Figure 5)(a), shows that the magnetization behaviour is governed by Yafet-Kittel three sub-lattice model, described in [22], confirmed by the computed canting angle (aY-K) values for NiFe2O4 samples taken after 16, 18, 20 22, 52 minutes, which are respectively 52.7, 56.6, 46.2, 55.7, 46.9 ̊. The canting angle provides information on spin canting on the surface, is so-called 'magnetic dead layer,' leads to a reduction of Ms(exp.), which is lower than bulk saturation magnetization of Ni ferrite (55 Am2/kg). Inset of Figure 5 (a) shows the variation of Ms(exp.) with oxygen parameter 'u'(which is a measure of disorder in the samples [1]). Figure 5 (a) shows the disorder-induced enhancement of Ms(exp.),as was also reported in [3]. (Figure 5) (b) depicts the Coercivity(Hc) variation for NiFe2O4 samples taken after 16, 18, 20 22, 52 minutes. Obtained Hcand related Dvalues imply that studied samples lie in the region with overlap between single or multi-domain structures, as reported earlier [3]. (Figure 5) (b) Inset depicts the variation of Mr/Ms for NiFe2O4 samples taken after 16, 18, 20 22, 52 minutes. Mr/Ms values ranging between 0.15-0.22 reveal enhanced inter-grain interactions suggesting isotropic behavior of the material [23] reveal multi-domain particles with no preferential magnetization direction. Time-dependent tunable structural, magnetic properties during synthesis are valuable in achieving optimal properties of Ni ferrite for their usage in magnetic resonance imaging [5], hyperthermia [24] for cancer treatment, photocatalysis for water purification [11].

Figure 5: (a) Variation of Ms(exp.), Ms(th.)for NiFe2O4 samples taken after 16, 18, 20 22, 52 minutes. Inset: Dependence of Ms(exp.)on oxygen parameter (u), line connecting points in Inset are linear fit to the experimental data.; (b) Coercivity(Hc) variation for NiFe2O4 samples taken after 16, 18, 20 22, 52 minutes. Inset: Variation of Mr/Msfor NiFe2O4 samples taken after 16, 18, 20 22, 52 minutes.

Lupinepublishers-openaccess-material-science-journal

Summary

To summarize, the sol-gel auto combustion technique is used to observe the time-development of structural, magnetic properties of Ni ferrite. Changes in cationic distribution lead to modification of structural properties, magnetic interactions, responsible for observed magnetic properties. Time-progression of properties are of use to alter structural, magnetic properties of Ni ferrite as a material for its prospective usage in heterogeneous catalysis, water purifications, biomedical applications.

Read More About Lupine Publishers Journal of Material Science Please Click on Below Link:  https://lupine-publishers-material-science.blogspot.com/

Monday, 12 December 2022

Lupine Publishers| Natural Rubber Latex and Gum Arabic: A Comparison of Physico-Chemical Properties

 Lupine Publishers| Journal of Material Science


Abstract

The present investigation deals with the determination of the physio-chemical properties of two commercial grade samples of local gums (Gum Arabic and Natural Rubber Latex (NRL)). The results revealed that the gum samples have high melting point that indicate thermal stability at room and moderate temperatures. The gum samples have about 95 % carbohydrate content and a corresponding high internal energy and can serve as a source of energy. The rheology of the samples revealed shear-thickening characteristics with gum Arabic being thixotropic and pseudo-plastic in nature while NRL was observed to be anti-thixotropic and rheopectic. Further results from the moisture absorption, contact angle and Fourier Transform Infrared Radioscopy (FTIR) analyses gave better insight into their hydroscopic behaviours. Gum Arabic has excellent water absorption capacity with less wettability as it consists mainly of more water-soluble compounds in comparison to Natural Rubber Latex. These insights from the study will enhance wider application of the gums with increased value-addition to the gums and the communities where they (can) thrive.

Keywords: Gums; Density; Wettability; Latex; Gum Arabic; Rheology

Introduction

Rubber latex and gum Arabic are gums which are water-soluble polysaccharides that are extractable land plants. They also contain some protein materials and are important agro-forestry resources in Nigeria [1]. They can enhance the viscosity and gelling ability with their dispersions. Hence, the key qualities of the gums are their water solubility and high viscosity in aqueous dispersions. Guar gums are harvested from the stems and branches of the resource gum trees as dry exudates. Hydrophobic affinity chromatography showed that gum Arabic is made up of three major constituents namely, Arabinogalactan (AG), Arabinogalactan protein (AGP), and Glycoprotein (GP). The highly branched polysaccharide part of the gum represents about 90% of the total gum [2]. The complex nature of plant gums is since each gum sample possess a special combination of sugar (monosaccharide unit) to form the polysaccharide. The most widely distributed sugar in plant gums are mannose, galactose, ramose, fructose, xylose, and the sugar acid. They contain residual amount of fats, protein, metabolites, metal ions, crude fibres etc. Raw materials of plant origin have proven to be relatively non-toxic, bio-compatible, readily accessible, economical, and cost effective. In this regard plant gums are used for wide industrial applications such as in the cosmetic, pharmaceuticals and in food industries [3].
The prediction of the properties of these gums is a challenge because of their heterogeneity in addition to their complex nature. Hence, their industrial applications require reliable information that can only be obtained from proper characterization of samples. The physicochemical properties of a compound are the measurable physical and chemical characteristics by which the compound may interact with other systems. This characteristic collectively determines the quality, applicability or the end-use of the compound. In plant gums, these properties are directly influenced by the botanical type, age, location, nature of the growing soil and the climatic condition around the resource gum tree [1]. Physicochemical characterization of gums therefore is an essential step towards establishing suitability for industrial application. This focus of this study is to determine the physio-chemical properties and characterization of natural lubber latex and guar gum as found in Nigeria. This is to enable us gain insight into their quality, applicability, and end use in industries. Information about these properties are scanty in open literature. Such physio-chemical properties include the ash content, moisture content, moisture absorption, pH, percentage lipid content, crude protein, carbohydrate content, and functional groups, among others. Just as other natural resources have been studied (Abdallah, Edomwonyi-Otu, Yusuf, & Baba, 2019; Edomwonyi-Otu & Aderemi, 2010; Edomwonyi-Otu, Aderemi, Ahmed, Coville, & Maaza, 2013; Gimba & Edomwonyi-Otu, 2020) The knowledge of their properties and applications for value addition and enhance the economic wellbeing of the communities where they thrive.

Experimental

Preparation of Samples

Gum Arabic: The crude sample consisted of mixture of large and small nodules mixed with the bark and other organic debris obtained from the bark of wounded Acacia Senegal plant and Frankincense plant. Hand picking method was used to separate the neat gum lumps from debris and other constituents. The lumps were then spread out under room temperature to dry. The dried sample was then ground into powder and 150 g of the sample weighed inside an empty dried weighed bucket by using the weighing balance (CWS Series with accuracy of ±0.05% FS). The sample was added to a 200 ml hot boiled water to dissolve the sample. Proper protective equipment was worn for safety purposes. The gumwater system was properly stirred to ensure complete dissolution of the gum in water. It was thereafter stored in a tight container at room temperature for 48 hours and stirred at 6 hours intervals to ensure a perfect dissolution, proper hydration and adsorption (Edomwonyi-Otu, Chinaud, & Angeli, 2015). The dissolved solution was centrifuged (strained) to remove air bubbles and any insoluble residual lumps through a muslin cloth (mesh) in a jug and sieved into another container. The undissolved lumps of the sample were transferred into a crucible and placed in the oven (Gallenkamp TM OV-420) at a temperature of 90 ̊C to dissolve further by gentle heating. The dissolved solution was then mixed, weighed and filtered using a mesh to separate the clear gum solution from dirt. The weight of the clear solution after filtration was measured. Formalin was added to the gum Arabic clear solution to prevent deterioration, and then stored[1].

Natural Rubber Latex: 300 ml of the crude rubber latex gum was tapped from the stem of rubber latex plant (hevea brasiliensis) using a v-shaped knife. The raw latex was then centrifuged to remove water molecules. Ammonia solution was then added to the solution to prevent deterioration [4].

Analysing the Physio-Chemical Properties of The Gum Samples

Density and Specific Gravity Measurement

Density and specific gravity analysis of 1% w/v of the test samples was carried out using a density bottle and following methods described elsewhere [5]. The weight of the empty bottle was measured (W) using CWS Series weighing balance (accuracy of ±0.05% FS) and then weight of the bottle with 70ml of the test samples of gum acacia solution and rubber latex gum respectively as (W1). The difference was taken to obtain the actual weight of the liquid solution; the weight was divided by the volume to obtain the density as shown in equation (1)

(1)

Where, W1 is the weight of bottle and the test sample of the gum solution, W is the weight of the empty bottle and V is the volume of the gum samples.

Ash Content and Moisture Content

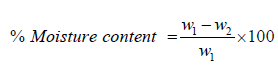
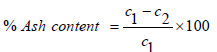
The analysis of moisture and ash content was determined using 2 clean crucibles of known weight dried in an oven at 102 ̊C for 30 minutes. 10g of both samples were placed in the crucibles and the put into an oven (Gallenkamp TM OV-420) at a regulated temperature of 125 ̊C for 6 hours. The Moisture content was taken as percentage ratio of the change in the weight to the original sample weight. The dry weight of the ash was taken, and the ash was ignited at 550 ̊C in a muffle furnace for 1 hour, content was cooled in a desiccator for 30 minutes and weighed. The ash content was taken as the percentage loss in weight after ignition to that of the original sample. Equation (2) and (3) gives the temperature for calculating % moisture and % ash content respectively.

(2)

Where; W1 is the original weight of the gum samples, W2 is weight of the gum samples after drying

(3)

Where; C1 is the dry weight of ash, C2 is the weight of ash after ignition

Read More About Lupine Publishers Journal of Material Science Please Click on Below Link:

https://lupine-publishers-material-science.blogspot.com/
Tuesday, 1 February 2022

Lupine Publishers| The Future of Biodegradable Plastics from an Environmental and Business Perspective

 Lupine Publishers| Journal of Material Science


Abstract

Synthetic plastic waste is a major environmental issue around the world. There are several policies adopted in many regions to save the environment. Moreover, Governments and businesses are restraining synthetic plastics either by searching for a better alternative, or by reducing the public and industrial consumption of synthetic waste. However, the problem is finding a biodegradable and a price-competitive alternative for synthetic waste. This review paper studies markets for biodegradable and synthetic plastics and also the governmental policies being adapted around the world to combat synthetic plastics were analyzed. Additionally, the main issues that face developing countries before adapting environment-friendly policies were taken into consideration in this review paper. The authors aim at finding a solution for the price issue in a developing country like Egypt, as its results may as well reflect on several developing countries around the world. The market analysis indicates a very promising future for biodegradable plastics in developed countries, with CAGR levels reaching 20% in some industries. Meanwhile, from an environmental perspective, strict policies all around the world are needed to battle synthetic plastics. This need is recognized in developed countries; however, in developing countries, the price is still the issue. Nonetheless, the authors have been capable of conducting a method to produce plastic bags from chitosan pellets that would cut the costs to 2,000 USD/Ton. A price as such would make biodegradable plastics almost as competitive as synthetic plastics, even in developing countries.

Highlights

a) The only factor preventing Egypt from being environment friendly is money.

c) Plastic waste falling in our oceans is expected to reach 160 million tons in 2025.

d) Biodegradable plastic bags can soon be as competitive as synthetic bags.

Keywords: Plastics; Biodegradable plastics; Shrimp shell waste; Waste; Feasibility

Introduction

Over the last two hundred years, the world has become dependent on synthetic plastics, from industrial applications to consumer use [1] plastics are among the prime products in many different applications, where huge masses are used. The most important feature of plastics can be the flexibility, abundance and durability of the raw materials; however, this feature comes with a side effect. Scientists claim that every piece of synthetic plastics that has ever been made is still floating somewhere in the oceans or lying down in some open areas around the world [2]. Researchers have been looking for some more environment friendly features to battle our dependence on plastics. However, most of these alternatives are still not that competitive with synthetic plastics, which is why they are trying to limit the use of plastics instead. Actions that the European Union has taken to reduce the dependence on plastic bags, for instance, has been relatively successful, as while the global average consumption of plastic bags is 513 bags per person per year, the average in the European Union is now 80, going down to around 20 in some specific countries [3]. In short, there are two ways to fight this environmental problem, either by banning or controlling the use of plastics, or by finding an alternative. The problem with the first alternative is that it would take a long time with full state-level commitment to change the culture towards plastics. Meanwhile, the problem with the second alternative is reaching the competitive price compared to plastics. However, researchers around the world expect to find an alternative soon that is more price competitive than oil-based plastics [4]. By dividing the world into developed and developing countries, we find that state-level policies to combat plastics are more successful in developed countries, in addition to the fact that biodegradable plastics, which (may not be that competitive with synthetic plastics) have a rapidly growing market in these countries. Meanwhile, in a developing country like Egypt, it is difficult and expensive to implement such a policy, due to the high cost of implementing such a policy and moving to an environment-friendly alternative [5]. On the other hand, the markets for biodegradable plastics are rapidly growing, one possible alternative is to produce biodegradable plastics from Chitosan, that is taken from shrimp shell waste in Egypt. Globally, the price for chitosan is not competitive, given that 1 ton of plastics costs around 1500USD [6] while 1 Ton of chitosan for industrial use is priced at 10,000USD [7]. However, researchers at Nile University, in cooperation with Nottingham University have found a new method to produce chitosan that may reduce the final cost to around 2,000USD, which would make it after comparing the expected density of chitosan with the density of LDPE, more competitive to use chitosan to produce plastic bags. Chitosan is the plastic alternative investigated; however, in order to make chitosan a proper alternative for plastics, some other natural additives should be added. The additives will enhance the physical and mechanical properties of chitosan.

Hypothesis

The proposed hypothesis is that biodegradable plastics can actually compete in the near future with polymer-based plastics. Despite the fact that polymer based plastics have social costs on both the society and environment, the competition we are addressing is mainly on the economic cost resulting in the price of these products, as social costs are not taken into account especially in poorer economics like the Egyptian. Therefore, if we succeed in making biodegradable plastics economically competitive, it can be the norm not to harm the environment anymore with polymer-based plastics. The question that persists though is, how competitive can biodegradable plastics be in the near future?

Biodegradable Plastics

Biodegradable Plastics Worldwide

The market in North America, Europe and Asia has grown around 15% CAGR from 2012 to 2017. Therefore, global demand is expected to hit 525000 tons in 2017 [8]. The biodegradable Plastics market is a growing market globally. In North America particularly, biodegradable plastics market has grown significantly due to the fact that biodegradable plastics have become more cost competitive with petroleum-based plastics [7]. The market in the United States of America alone is expected to be worth of 3.4 Billion USD in 2020, with an annual CAGR of 10.8% by a five-year period ending 2020 [9]. In 2012, Europe was the dominant market for biodegradable plastic products with 55% of global consumption; North America was second with 29%, followed by Asia with 16% [8]. The biodegradable plastics market in Europe is expected to further grow with a 20% CAGR year [10]. In fact, reports expect the market of biodegradable plastic products in the EU to grow over 300,000 Tons in 2020 [11]. The United Kingdom currently imports 3000 Tons of biodegradable plastic bags and domestically produces 1000 Tons [12].

Biodegradable Plastics in Egypt

The market for biodegradable plastics is not well established in Egypt. The Egyptian consumer mindset still is not aware enough of the real impact that an individual consumer can have on the environment by choosing to shift into more environment friendly products, like biodegradable plastics. The Egyptian market is a poor market in terms of financial numbers and thus the Egyptian manufacturer always has a preference for the cheapest alternative no matter how damaging this alternative can be on the environment [5]. In addition, the ministry of environment, according to [5] is not taking enough procedures to tackle the environmental issues in Egypt in general.

Biodegradable Plastics Applications

Biodegradable Plastics Applications Worldwide

Biodegradable Plastics are used in many applications worldwide. Applications very from bio-waste bags and shopping bags into relatively more complicated technical equipment products [11]. Precisely, according to this study, about 68% of 100000 tons of biodegradable plastics produced in 2015 in the European Union are used as biodegradable plastic bags, 21% in plastic packaging, 7% in consumer goods and the rest 4% in several other uses. These numbers are expected to grow to 320000tons in 2020, with only %57 for biodegradable plastic bags, %31 for plastic packaging, %7 for consumer goods, and %5 for other uses [11].

Biodegradable Plastic Applications in Egypt

Except for the fact that some supermarkets are using compostable plastic bags, there is no relevant information upon which we can define the size or even the existence of a market for biodegradable plastics in general. Biodegradable plastics are, thus, a new concept to the Egyptian market.

Biodegradable Plastic Bags

Biodegradable Plastic Bags Globally

The European Union has an environmental strategy to reduce the usage of synthetic bags which also paves the way for biodegradable plastic bags as the best alternative in the European market [3] Italy, and lately France banned entirely the use of plastic bags [3]. In comparison, in the United States of America, the consumption of biodegradable plastic bags was reported to be about 95 billion biodegradable plastic bags yearly (conservingnow.com, 2016). Upon the authors assumption, the average weight of 1 plastic bag is about 12g. The overall American consumption of biodegradable plastic bags is about twice that of the United Kingdom.

Biodegradable Plastic Bags in Egypt

The situation for biodegradable plastics is not that different when it comes to biodegradable plastic bags [12] The market for biodegradable plastic bags in Egypt is dominated by petroleumbased plastics. There are no reports that prove that biodegradable plastic bags as an industry even exist in Egypt; however, some reports suggest that a big supermarket chain, KheirZaman which is a well-known hyper market in Egypt is importing biodegradable bags to promote their cause of a better environment in Egypt. The authors think, this as a sign that the market for biodegradable plastic bags might be well established in the middle-far future with the increased awareness of the younger generations, but not the near future. D2W, the technology through which these bags were made, is a new technology that makes convenient plastics biodegradable by adding some oxidants at the manufacturing level. “It is the only oxo-biodegradable (controlled-life) plastic additive to be awarded an internationally recognized eco-Label [13]. The additive is used in the manufacturing of plastic bags and plastic packaging. Also, only about 1% inclusion rate is needed to control the life of the plastic material [13]. This additive material is provided solely from a UK based manufacturer, which means that in the case of KheirZaman, this material is imported.

Compostable Bags and Their Material

Compostable Bags and Their Material Worldwide

Reports suggest that in 2015, 50% of polymers used in compostable and biodegradable products were stretch-copolyester compounds, 20% PLA, 15% co-polyester, 13% PLA copolyester compounds and %2 of other compounds [11].

Compostable Bags and their Material in Egypt

According to [5] companies that try to go environmentally clean by using materials that are environmentally friendly get out of the market for the simple fact that the Egyptian plastic market is extremely competitive [5].

Synthetic Plastic Bags

The materials used in manufacturing synthetic plastic bags globally are either polypropylene or polyethylene, high or low density of each. Both these materials are petrochemical compounds [5].

Synthetic Plastic Bags Worldwide

When it comes to the usage of traditional synthetic bags worldwide, it is quite noticeable that synthetic plastic bags are much less used in more developed countries. Countries with more individual awareness regarding global environment issues record fewer numbers of plastic bags used per individual. In the European Union alone, the average is about 200 plastic bags per individual [3]. However, the averages differ between different countries that in countries like Greece, Poland, Portugal, and Latvia the average is 514 bags per person, 468 of which are single-time use bags [3]. The average gets as low as about 80 bags per individual in countries like the UK and Germany, and even as low as 20 bags in Ireland [3]. A huge portion of these plastic bags are imported from east Asian countries for relatively low prices, which is why they still have a relatively big share of the European market. However, a country like Italy has quite a history with banning plastic bags, while France started to ban plastic bags recently in June 2016. Finally, huge taxes are being added to plastic bags to push European manufacturers to choose biodegradable plastic bags instead of the traditional, environment endangering synthetic plastic bags [3].

Synthetic Plastic Bags in Egypt

Given the developing characteristics of the Egyptian market, synthetic plastic bags have quite an advantage due to the fact that it is much cheaper to produce a plastic bag from petrochemical materials in comparison to biodegradable plastic bags [5]. The Egyptian market for plastic bags uses a total of 1 million tons of polyethylene; 600,000 tons are produced from the Egyptian gas field, that is high-density polyethylene; and 400,000 tons are imported from abroad as low-density polyethylene [5]. The plastic bags industry in Egypt makes up about 20% of the plastic industry in Egypt. Out of 1276 factories making up the Egyptian market in 2012, 265 factories worked on the plastic bags and plastic packaging sectors [14]. These factories produced a total of 1,000,000tons of plastic bags and packaging per year [5].

Global Exporters and Importers of Plastic Worldwide

Reports show the United States are on top of the list of plastic bags importers with 2.7 billion USD worth of imports in 2016. This accounts to about 18% of plastic bags import worth on global bases [15] Second on the list is Japan with about 1.5 billion USD worth of plastic bags imported, 10% of the plastic bags imports worth on global bases. Third on the list are both Germany and the UK, with about 1.05 billion USD worth of plastic bags imported, about 7% each of the worth of plastic bags imported on global bases [15].

Exporting Market for Egyptian Plastic Manufacturers

Most of the plastic produced in Egypt is produced as a supplementary product for local industries, unlike East Asian countries, Egypt does not rely on exporting plastic products as a part of its economic system.

Plastic Bags Physical Properties

The density of a synthetic plastic bag slightly differs according to the type of raw material used. However, it is still between 0.9 and 0.965g per cm3 [16]. For instance, low density polyethylene (LDPE) density ranges between 0.916 and 0.925g. while high density polyethylene (HDPE) density ranges between 0.941 and 0.965g [16]. The approximated dimensions of a flat plastic bag before production is 65×25cm. However, the most important and critical part of a plastic bag is the required thickness of a plastic bag. The UK standard for a plastic bag is 40 microns, while sizes between 35 and 50 are also acceptable. Also, in the USA the standard is 50 microns. Therefore, the thickness of a plastic bag lies between 35 for thin plastic bags and 50 for thick bags [17] Therefore, approximately the volume of plastic in a thin plastic bag will be 0.0035 × 60 ×25 = 5.25cm3; and the volume of a thick bag will be 0.005 × 60 × 25 = 7.5cm3. The corresponding g needed for each of the received values are 5.25 × 0.925 = 4.86g, and 7.5 ×0.925 = 6.94g. The conclusion specifies that the weight of an average supermarket bag can take between 4.86 and 6.94g. Given the fact that 1 ton of Polyethylene costs between1200 and 1500 USD, which accounts to between 21,000 and 27,000 EGP [13] one plastic bag can cost between 0.12 and 0.19 EGP, the price differs according to type of plastic and market fluctuations. That is only taking into account the direct material costs included in producing the plastic bags, without any direct labor, and indirect costs that might be incurred and taxes. Comparatively, while the market price for 1 ton of Polyethylene is about 25000 EGP, the market price for 1 ton of chitosan is USD10,000 [17] which equals about 175,000 EGP, that is 7 times that of polyethylene.

Cost of Chitosan

Cost of Chitosan Worldwide

Studies show that the market and applications for chitosan are growing rapidly on global bases. The industry size for chitosan in the United States of America alone is about 1.52 billion USD [18]. Its application includes water treatment, industrial applications, cosmetics, biomedicine and pharmaceuticals, food and beverages, and agrochemical products and other applications. The CAGR growth is expected to be about 16% annually, with most of the growth expected in biomedicine and pharmaceuticals in the near future [18]. The high CAGR level also suggests that the market in the United States of America alone in 2024 alone is going to reach 5 billion USD. The dollar price for 1 ton of chitosan differs depending on the quality provided and application needed; the price ranges between 10,000 USD and 1 million USD, with the average industrial price at 10,000 USD per 1 Ton [17]. The quality and application of Chitosan differs heavily driving the huge difference in the price of chitosan.

Read More about Lupine Publishers Journal of Material Science Please Click on Below Link:
https://lupine-publishers-material-science.blogspot.com

Monday, 27 September 2021

Lupine Publishers| Effect of Laser Welding Parameters on Porosity of Welds in Cast Magnesium Alloy AM50

 Lupine Publishers| Journal of Material Science


Abstract

Pores in the weld metal lower the mechanical properties of the weld. It is therefore important to understand the pore formation mechanisms and find procedures that could reduce porosity. This study focused on laser welding of 3 mm thick magnesium alloy AM50, investigating how different parameters affect porosity formation. Low levels of porosity content were achieved by either increasing the welding speed or using a two-pass welding approach. It was found that higher welding speeds did not allow pores, which were pre-existing from the die-casting process, to have sufficient time to coalesce and expand. In the two-pass welding technique, pores were removed as a result of a degassing process which occurred through the second pass.

Keywords: Laser welding; Magnesium, Cast; Metallurgy; Porosity; Automotive; AM50

Introduction

Magnesium alloys are light-weight metals suitable for applications in several industries, such as automotive and aerospace. Compared with most materials they provide a possibility to reduce weight due to their high specific strength. However, their tensile strength is low (190-310MPa) compared with steels, which may limit their application; for example, to car interior parts such as seat frames, steering wheels or structural dashboard cross beams [1-4]. A common magnesium alloy is AM50 (4.4-5.5 wt% Al, 0.26-0.6 wt% Mn) which, compared with other magnesium alloys, is of relatively high strength, high hardness, high elongation and has excellent castability. Often magnesium alloys are cast into complex shapes using high pressure die-casting [5-8]. An alternative is to cast less complicated parts and join them by welding, commonly by tungsten inert gas (TIG) or metal inert gas (MIG) welding [2]. An alternative is laser welding, where high power densities are attained with small welding spots, allowing relatively high welding speed and low heat inputs to be achieved. Low heat input is an advantage for many metallic materials as a narrow fusion zone and HAZ will form, reducing negative effects on material properties [2]. Laser welding of magnesium alloys was reviewed by [9], who stated that crack-free laser welds with low porosity and good surface quality could be obtained when using appropriate welding parameters. Nevertheless, magnesium alloys may exhibit many processing problems and weld discontinuities, such as an unstable weld pool, spatter, drop-through, sagging, undercut, porosity, cracking, and oxide inclusions. Pores in the weld metal lower especially the tensile strength and may have a deleterious effect on fatigue performance if surface breaking. Therefore, it is important to understand the pore formation mechanisms and find procedures that could be used to reduce pore formation [2,10]. Porosity in welded magnesium alloys has been the subject of a number of previous investigations [2,10-15]. In these studies, a range of different factors have been found to cause pore formation including: hydrogen, an unstable keyhole, pre-existing pores from the die-cast process, surface condition, gas entrapment, and alloying elements with a low vaporization temperature. In studies by [15] and [11] porosity in laser welded AM60B (Mg-alloy with 5.5-6.5 wt.% Al and 0.24-0.6 wt.% Mn) was investigated. Pre-existing pores in the base metal coalesced and expanded in the weld metal during welding resulting in large diameter pores [16] presented three solutions to avoid porosity; specifically, removing the oxide layer with a separate plasma arc before welding, use of dual laser beam welding or using a two-pass laser welding procedure. The best results were obtained using a two-pass welding, with a pre-heating configuration for the first laser pass. However, a systematic study of how different parameters affect the amount of porosity in laser welded AM50 has not been previously performed. This study was therefore initiated to investigate how different parameters affect porosity formation in laser welded AM50, with the overall aim to ensure that high quality welds can be produced reliably and reproducibly. Investigations were undertaken on 3mm thickness AM50, since this is of common interest to many potential applications.

Experimental

Material

Die-cast magnesium alloy AM50 sheets of dimensions 3(T) x100(L)x170(W) mm were welded. The composition according to ISO 16220(00) and the composition measured with glow-discharge optical emission spectroscopy are presented in Table 1.

Table 1: Composition of AM50 magnesium in wt.%. ISO 16220(00) and measured values are shown.

Lupinepublishers-openaccess-material-science-journal

Welding

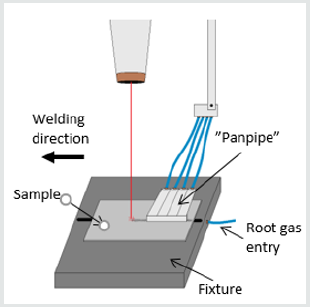
Figure 1: Schematic image of the laser welding setup. A trailing gas shielding was used on the top side with a ‘panpipe’ design, and root gas was applied through a 10mm wide efflux channel in the fixture along the weld line.

Lupinepublishers-openaccess-material-science-journal

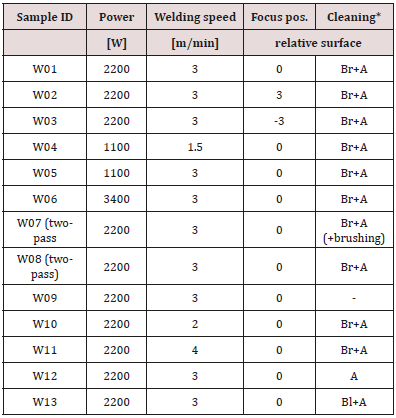
Welding was performed with an IPG 10kW fiber laser with a delivery fiber of 200μm core diameter. A 120mm focal length collimator lens and a 400mm focal length focusing lens were used, giving a nominal beam width of 0.66mm diameter the optics were aligned perpendicular to the sheet with the beam width on the top surface of the workpiece. Bead-on-plate welds, 100mm in length, were produced. Argon gas with a purity >99.99% (gas type I1 to ISO 14175:2008) was used as shielding gas at the top and root sides, with flow rates of 40 l/min and 5 l/min, respectively. On the top side a trailing gas shielding was used with a ‘panpipe’ design. The root gas was applied through a 10mm wide efflux channel in the fixture along the weld line Figure 1. Laser welding parameters and surface conditions were varied to study their influence on porosity formation. The welding parameters varied were power, welding speed and focus position (the laser beams minimum diameter with respect to the top surface of the workpiece). The surface condition was varied through different cleaning procedures, specifically wire brushing (Br), acetone degreasing (A) and grit blasting (Bl). In addition, single or two-pass welding was used Table 2. For the twopass welding, both passes were resulting in full penetration welds i.e. not a pre-heating setup.

Table 2: Parameters and cleaning procedure. Specimens W07 and W08 were welded with two passes. For W07, loose welding soot was removed with a soft brush between the passes.

Lupinepublishers-openaccess-material-science-journal

*Br=Wire brushing, A=Acetone, Bl=Grit blasting

Evaluation

Metallographic cross-sections, both transverse and longitudinal to the welding direction were prepared to study the resulting microstructure and porosity of the welds. The longitudinal sections were cut from the centre of the weld with a length of 20mm. All sections were grinded with 4000 grit paper, and polished with either a 6 or 1μm diamond suspension slurry for the LOM (Light Optical Microscopy) evaluation or and the SEM (Scanning Electron Microscopy) evaluation respectively. When performing LOM, an external ring-shaped light source (directed from the sides onto the sample) was used to provide additional illumination and increase visibility of the pores. This yielded a high contrast image suitable for image analysis using ‘Image J’, an open source Java-based image processing software [17]. A JEOL JSM-7001F field emission SEM equipped with a back-scatter detector and an Oxford Instruments EDS (Energy Dispersive Spectrometry) detector was used for microstructure studies and phase analysis.

Result

Microstructure

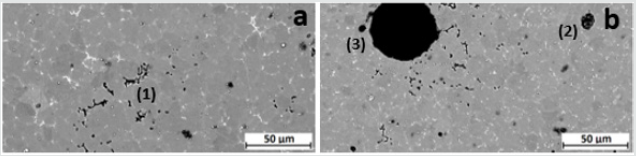
EDS analysis showed that the matrix of the as-received AM50 sheet material contained a Mg-Al phase (corresponding to β-Mg17Al12 according to literature [18]), particles of Al- Mn (typically Al8Mn5 [18]) and as Mg-Al oxides Figure 2. Also, occasional cavities were found in the base material. These are most likely shrinkage pores from the high-pressure die-casting process.

Figure 2: Cross section images of AM50 weld obtained using the back scattered detector in SEM showing (a) base material and (b) fusion zone. White areas are a Mg-Al and Al-Mn phases. Black areas are shrinkage pores from die-casting (1), Mg-Al oxides (2) or pores from welding (3).

Lupinepublishers-openaccess-material-science-journal

Porosity

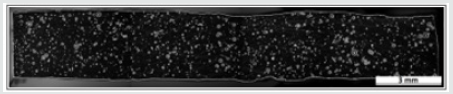
Figure 3: LOM micrograph of a longitudinal section of W01, obtained using an external ring shaped light source.

Lupinepublishers-openaccess-material-science-journal

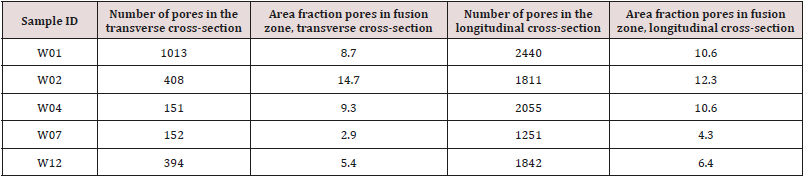
Table 3: Transverse and longitudinal cross-sections porosity content, including number of pores in the section as well as area fraction.

Lupinepublishers-openaccess-material-science-journal

*Br=Wire brushing, A=Acetone, Bl=Grit blasting

The porosity analysis was typically performed using images taken of the cross-section’s transverse to the welding direction. Longitudinal section images Figure 3 were also analyzed to verify that the transverse cross-sectional images were representative of the full length of the weld. Table 3 details the number of pores, including the percentage of the fusion zone cross-sectional area covered by pores (hereafter ‘area fraction pores’). The porosity counts in the transverse cross-sections show a good correlation with the porosity counts in the longitudinal cross-sections, suggesting that cross-sectional porosity is representative and can be used for evaluation. The size distribution of pores was analyzed for samples welded at three different welding speeds; specifically, 2m/min (W10), 3m/min (W01) and 4m/min (W11). Most pores had a radius in the range 10-40μm, independent of welding speed. However, for the lowest welding speed (2m/min) some pores exceeded 100μm in radius (Figure 4).

Figure 4: Graph showing the size distibution of pores for three welding speeds: 2 m/min (W10) 3 m/min (W01) and 4 m/min (W11). Most pores were in the size of 10-40 μm. Welding speed 2 m/min has some large pores in the size of >100 μm in radius.

Read More About Lupine Publishers Journal of Material Science Please Click on Below Link:https://lupine-publishers-material-science.blogspot.com