Showing posts with label SJFN. Show all posts

Thursday, 14 September 2023

Lupine Publishers | Staphylococcus Aureus Health Risk from Ready-To-Eat Raw Beef Meat and Associated Risk Factors in North West Ethiopia

 Lupine Publishers | Journal of Food and Nutrition


Abstract

Assessment of the food safety status is a pro-active measure to minimize the risks foodborne intoxications resulted from foodborne pathogens like S. aureus. This study was conducted from October 2018 to April 2019 on S. aureus with the objective of assessing prevalence and associated beef contamination risk factors from ready-to-eat raw beef in Bahir Dar city with cross-sectional study design. About 101 raw beef samples were collected from butcheries using simple random sampling method for prevalence estimation of S. aureus using conventional culture method. Potential risk factors related to meat contamination were evaluated by using personal observation and questionnaire survey. The data were analyzed by using STATA software version 12.0 for descriptive statistics and logistic regression model. The prevalence of S. aureus in ready-to-eat raw beef was 54.45%. Of all respondents, 80.59% showed positive attitude towards food safety; 75.39% had good overall food safety knowledge and 61.32% proper food safety practice. The main contamination risk factors for this prevalence were worker’s inadequate food safety training ( AOR=5(2.13-9.17)), low knowledge level of foodborne diseases (AOR=2.96, (1.37-2.65)), poor attitudes to the necessity of workers medical evaluation before employment (AOR=5.18, (2.03-8.12)), poor washing practice of working clothes (AOR= 3.16(1.31-3.65)) and use of rings, necklaces or watches while serving food (AOR= 8.63, (5.23-10.17)). In conclusion, S. aureus is a major meat contaminant in butcheries of Bahir Dar city due to inadequate food safety training and low level of hygienic practices. Therefore, improving the food safety knowledge and handling practice of meat handlers is important to prevent S. aureus foodborne intoxications.

Keywords: Bahir dar city; Butcher shops; Contamination; Prevalence; Staphylococcus aureus

Background

Staphylococcus aureus belongs to the genus Staphylococcus under the family of Staphylococcaceae. It is one of the more formidable disease-causing bacteria affecting humans and livestock with low DNA G + C content (32-36%) [1,2]. Staphylococcus aureus is a Gram-positive, facultative anaerobic bacterium with size 0.5-1.0μm in diameter which grows individually, in pairs, short chains or grape-like clusters [3]. The bacterium is catalase and coagulase positive, oxidase-negative, non-motile microorganism that does not form spores. On agar medium it creates smooth, convex, glistening, circular colonies with entire margins reaching a size of 6-8mm in diameter [4,5].

Billions of people are at risk every year and thousands die as a result of consuming unsafe
food. Many outbreaks of FBD are due to cross contamination that occurs during food preparation within food service establishments [6]. Staphylococcus aureus is a foodborne pathogen which is responsible for contamination of different food products and results food spoilage, reduction of food safety and shelf life and cause foodborne poisoning via production of deadly enterotoxins. From all major foods and food products, meat is the most perishable because of the presence of all required nutrients for the growth of bacteria, yeast and molds [7,8]. Many factors could be involved in food contaminations and intoxication at any point along the food chain, including the environment and animal handling procedures during slaughtering and processing practices [9]. The prevalence and burden of S. aureus is growing worldwide and it is a major concern of public health programs [10]. However, the true incidence of staphylococcal food poisoning is underestimated due to misdiagnosis, under-reporting, improper sample collection and laboratory examination [11]. Due to poor hygienic practices and low level of awareness, this problem is worse in developing countries. The global prevalence of S. aureus ranges from 23.3% to 73% [12]. Staphylococcal foodborne intoxication causes an estimated 1,513,000 cases of illnesses and 1,210 deaths annually in the United States with an estimated cost of $6.8 billion [13]. In Africa, there is scarce data regarding to the public health impact and burden of S. aureus. Considering the poor hygienic conditions during food production and processing, coupled with poor cooling facilities [14], there is a likely of high impact of staphylococcal food poisoning in African countries like Ethiopia. The prevalence varies from 16.0% in Tunisia to 52.0% in Egypt [15] and up to 57.8% in Ethiopia [16]. In addition, the prevalence in Ethiopia from meat reaches up to 40% reported form butcher shops of Mekelle city [17]. The epidemiology of S. aureus bacteria, the widespread habit of raw meat (locally called “Kurt”) consumption in the population and the availability of raw beef in open-air local butchers without the cold-chain process are suggestive of the risk of acquiring S. aureus related foodborne illnesses in Ethiopia [14-20]. Despite S. aureus prevalence (45%) reported from milk sample in Bahir Dar city [21], there is a paucity of data from raw beef in the city. Therefore, this study was focused on assessing the prevalence of S. aureus from ready-to-eat raw beef and its risk factors of beef contamination in Bahir Dar city.

Methods

Description of the study area

The study was conducted in Bahir Dar city, North West Ethiopia. Bahir Dar city is the capital city of North West Ethiopia. Geographically Bahir Dar city is located between 11.29° to 11.38° North latitude and 37.23° to 37.36° East longitude. Its average elevation is estimated to be 1810 meter above sea level. The city’s mean annual temperature ranges from 7.1 °C to 29.7 °C, whereas annual mean temperature was 20.85 °C [22]. Bahir Dar city is one of the leading tourist destinations in Ethiopia, with a variety of attractions in the nearby Lake Tana and Blue Nile River. In Bahir Dar city, there are about 137 butcher shops which prepare raw meat for human consumption [23]. Consumption of raw and partially cooked meat is commonly practiced in Bahir Dar city like other parts of Ethiopia.

Study design: A cross-sectional study was conducted from October 2018 to April 2019 in Bahir Dar city. The sanitary conditions of butcher shops and the meat handler’s food safety knowledge, attitudes and practices were assessed by using personal observation and structured questionnaire survey.

Sample size determination and sampling procedures

In Bahir Dar city, about 137 licensed butcher shops were operating on meat and meat products and all the butcheries were included in the sampling procedure. The butcher shops obtained legal license and supervised by the nearby health centers under the Bahir Dar city administration health department. The sample size was determined by using 95% confidence interval and 5% desired level of precision. Because there were no previous studies conducted in ready-to-eat raw beef products in the study area, the expected prevalence of S. aureus was taken as 50% and the size was determined by the formula for infinite population given below [24].

Where:- n = required sample size,
Pexp = expected prevalence,
d = desired absolute precision.
Based on the above given formula, the total sample size was expected to be 384. However, in relatively small populations, the required sample sizes need to be adjusted ( nadj) by the following formula for the same degree of precision [24].

Where:- n = the sample size based on an infinite population (384)
N = the size of the study population (137).
Based on the above calculation, the total sample size for this study was 101.
In the city, there were six health centers that supervise surrounding butcher shops. The lists of all 137 butcher shops were obtained from the health centers out of a total 101 retailers were selected based on simple random sampling.

Raw beef sample collection

From randomly selected butcher shops, about 250 gram of readyto- eat raw beef (Kurt) samples were collected in sterile stomacher plastic bags and kept in icebox containing ice. The collected samples were immediately taken to Bahir Dar University, Institute of Technology food microbiology laboratory for homogenization and the homogenate were transported to the Amhara Public Health Institute (APHI) microbiology laboratory unit within 4 hours by keeping the cold chain for bacteriological analysis.

Questioner survey and observation

Personal observation and structured questionnaire survey were used to assess the food safety knowledge, attitudes and practices of beef handlers and sanitary conditions of butcher shops of Bahir Dar city. The questionnaire was also prepared to include issues addressing demographic characteristics of respondents, health status and personal hygiene of beef handlers in retailers. The questionnaire was pre-tested and modified as needed before the formal study begins. The questionnaire was filled by face to face interview with one representative beef handler from each 101 retailers. Respondents were selected based on major contribution on food processing and handling. This questionnaire and observational checklists were developed based on comprehensive food safety literature reviews of several published questionnaires [25-29] and managed in-accordance with the standard guidelines of Codex Alimentarius Commission of Food and Agriculture Organization [30] and rearranged to suit target objectives of this research.

Bacteriological investigation

Isolation and identification of S. aureus from ready-to-eat raw beef was done according the methods described by ISO 6888- 3 [8,31]. Briefly 25 gram of raw beef sample was transferred aseptically into a sterile stomacher bag containing 225ml of peptone water and homogenized for 3 minute using a stomacher. From the original homogenate, a loopful aliquot was inoculated on blood agar plates (5% difibrinated sheep blood) and mannitol salt agar (MSA). Pure cultures of presumptive colonies were streaked on nutrient agar and incubated for 24-36h at 37 °C for Gram stain and further biochemical tests (catalase, coagulase test and oxidationfermentation test).

Data quality assurance

The data quality and the reliability of the study findings were assured by following standard operating procedures and the routine use of control bacterial strains. The sterility of prepared media was checked by incubating some randomly selected plates for 24- 48 hours at 37 °C. Uninoculated media was incubated as negative control to check for sterility. The quality of the culture media and test procedures were thoroughly checked using standard American Type Culture Collection (ATCC) strain of S. aureus (ATCC25923) as a positive control for screening tests, confirmatory tests and disk diffusion antibiotic susceptibility tests. Escherichia coli ATCC- 25922 was used as a negative control for culture on mannitol salt agar.

Ethical approval

The study was conducted after the protocol was ethically reviewed and approved by Institutional Review Board of Bahir Dar University, College of Agriculture and Environmental Sciences. A letter of support from Bahir Dar University was written to APHI. Then, ethical clearance was obtained from APHI and official permission was received from Bahir Dar city Administration Health Bureau. Retailer’s owner permission and interviewee’s willingness were asked to participate in the research with full consent by explaining the objectives of the study, their right and their participation is fully voluntarily. They were also being informed about their right during participation that refusing to participate or discontinue the interview at any time will not affect them and their family in anyway and their responses were kept confidential. To ensure confidentiality, any personal identifying information on participants was not collected and it was managed with unique code. A consensus was made that information collected for this study was not be used for any other study without their permission.

Data management and statistical analysis

Raw data and laboratory findings were encoded into Microsoft Excel exported into STATA software version 12.0 and analyzed using descriptive statistics such as frequency, percentages, mean and standard deviation (SD). The answers for respondents for the questions of knowledge, attitudes and practices of beef handlers were analyzed by giving ‘one’ point for each yes/correct reply and ‘zero’ point was awarded for each no/incorrect and I have no idea answers. Binary logistic regression model was employed and variables having p-value of < 0.2 were exported to multi-variable logistic regression model to assess the effect of confounders. The degrees of associations of risk factors with the occurrence of S. aureus in beef sample were quantified using adjusted prevalence odds ratio. In all the analyses, confidence level was held at 95% and used to determine association.

Results and Discussion

Prevalence of Staphylococcus aureus

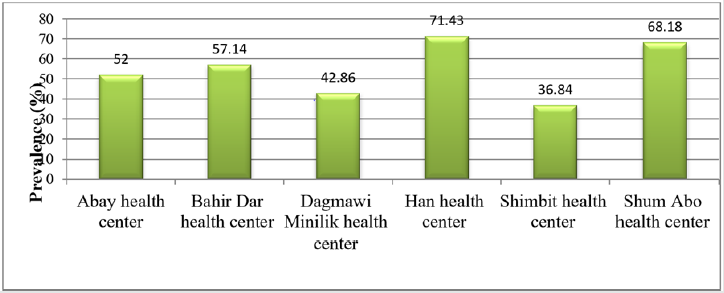
From a total of 101 ready-to-eat raw beef samples subjected for cultural and biochemical isolation, 55(54.45%) were positive for S. aureus. This high prevalence suggests the bacteria could be a major food contaminant in butcher’s shops and the higher rate of contamination of meat with S. aureus organism might be due to poor hygienic and sanitary practices employed right from the slaughtering house, transportation and processing at the butcher shops [32]. The present result was higher than the previous findings of 29.17% from butcher shops of Addis Ababa [33]; 32.22% from retail houses of Jigjiga town [34]; 40% from hand and knife in butcher shops of Mekelle city [17] and 36.5% from ready-to-eat meat in Debre-Zeit [35]. These differences in prevalence may reflect the level of meat contamination during their food handling practices, level of environmental hygiene and the degree of awareness related to microbial contamination. This notion was supported by the previous report stated that high level of food contamination with S. aureus has been related to improper personal hygiene of employees during food handling and processing [33]. The distribution of S. aureus varied between Bahir Dar city health centers in accordance with butcher shops they supervised. The highest prevalence was observed in butcher shops around Han health center (71.43%) followed by Shum Abo health center (68.18%) whereas the lowest prevalence occurred in butcher shops supervised by Shimbit health center (36.84%) (Figure 1). The probable reason for high prevalence around Han health center could be due to the presence of bus station and animal marketing centers which might be the main factor for contamination. Likewise, the butcher shops supervised by Shum Abo health center were vulnerable for contamination due to their location along the main road of the city with high human trafficking. This finding was supported by Fasanmi and his colleagues who stated that contamination of meat could be higher at meat establishments surrounded with high population density due to the presence of contaminated air in form of bioaerosol which is loaded with common microbial contaminants [36].

Figure 1: Prevalence of S. aureus within health centers with respect to butcher shops of Bahir Dar city.
upinepublishers-openaccess-Food-Nutrition

Demographic characteristics of respondents

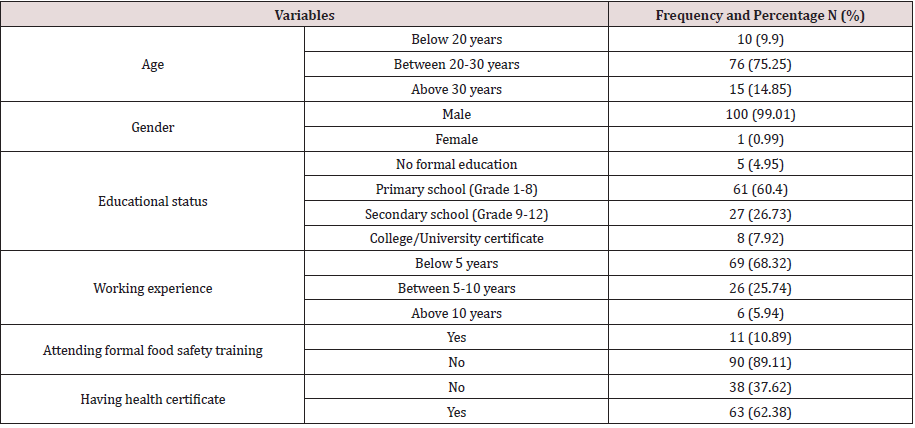
From total number of 101 food handlers participated in this study (with 100% response rate), 99.01% were male; 75.25% of the respondents had age range between 20-30 years and 14.85% were above 30 years (Table 1). This result was in harmony with of the reports of males were most likely involved in meat processing than females [29] and butchering activity requires much physical strength and it is more dominated by more energetic youth and middle aged (18-40years) men [37]. Based on education level, 60.4% of respondents were attended primary school (Grade 1-8) whereas 5 (4.95%) did not have formal education. Approximately 68.32% of the participants have been working below 5 years in this sector while only 6 people (5.94%) have worked for over 10 years. It was found that 89.11% of respondents did not attend formal food safety training which contradicts and violets the principle laid by the Codex Alimentarius, which states that all individuals coming into direct or indirect contact with food must be qualified and must recognize their role and responsibility in protecting food against contamination and deterioration. It further determines that every food producing area should provide a training program that is revised and updated whenever needed [38]. Additionally, training should include procedures to prevent food contamination, risks of foodborne pathogens, perception of good handling practices and personal hygiene, proper sanitation of food, utensils and the environment and ensure that food handlers are kept updated about the required procedures in maintaining the quality and safety of the food produced [39]. Despite that 62.38% of the participants passed through medical evaluation and certified before employment, no food handler had renewed the certificate, and this was on the contrary that the food handlers should be examined clinically and bacteriologically before they are employed and at regular intervals afterwards to avoid meat contamination [40].

Table 1: Demographic Characteristics of Respondents raw beef meat handler of Bair Dar City (N=101).
upinepublishers-openaccess-Food-Nutrition

Food safety knowledge of respondents

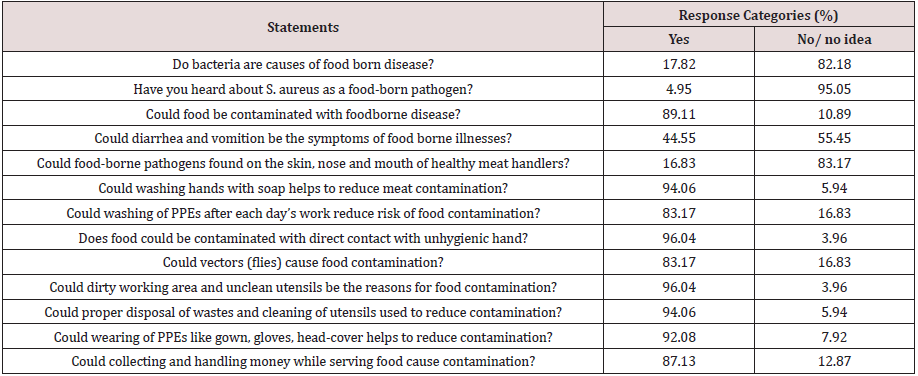
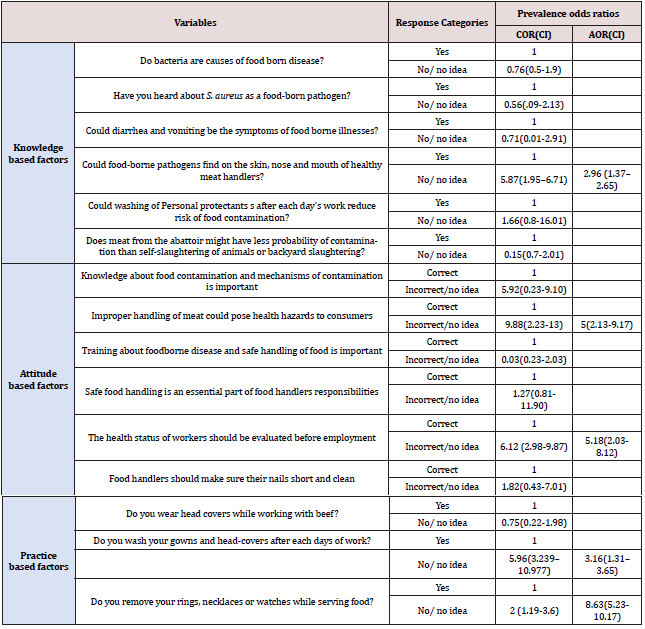
Respondents were asked to assess their knowledge on food safety related to foodborne disease, personal hygiene of food handler and level of cross contamination. The respondent’s overall knowledge level in this study was 75.39% and 96.04% of respondents were aware that meat can be contaminated with dirty working area and unclean utensils and people with skin injury and other diseases. However, only 4.95% of food handler’s had knowledge about S. aureus as source of foodborne intoxication, although 17.82% respondents knew that bacteria could cause foodborne disease (Table 2). Knowledge regarding to S. aureus as source of foodborne intoxication (4.95%) in this study was also highly different from the previous findings (71.4%) in Malaysia [25]. This variation might be due to differences in educational status of respondents and the acquisition of training about foodborne disease because 77% of the respondents attended secondary school and above in Malaysia. This claim was strengthened by the idea that as education level increases, food handler’s knowledge and attitude towards good food handling practice would have improved [41]. It was found that (89.11%) of the respondents had information about food contamination with foodborne pathogens which was fairly compatible with the finding (83.5%) [42]. A very large proportion (94.06%) of respondents knew that proper hand washing and cleaning of storage area before storing new product reduces the risk of meat contamination. The increased food safety knowledge of respondents in this finding was supported by previous reports indicated that knowing the importance of proper handling of meat, proper hand washing and other important hygienic procedures is very important since meat handlers can serve as vehicles for cross contamination and spread of foodborne pathogens [43]. In this study, only 16.83% of the respondents had knowledge about existence of foodborne pathogens on the skin, nose and mouth of healthy individuals. Those respondents who did not have this knowledge could contaminate meat with S. aureus by 2.96 times more likely than those who aware this (AOR=2.96 (1.37-2.65)) after holding other factors constant (Table 5).

Table 2: Respondent’s food safety knowledge in butcheries of Bair Dar city (N=101).
upinepublishers-openaccess-Food-Nutrition

Food safety attitude of respondents

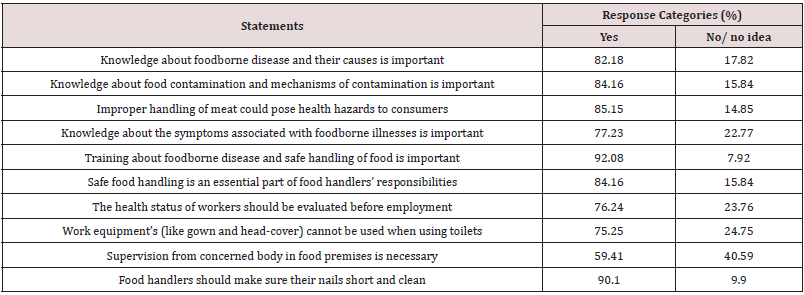
Apart from the knowledge, attitude is also a crucial factor that may influence food safety practice. Of all respondents participated in this study, 80.59% had positive attitude towards food safety (Table 3). Majority of respondents (92.08%) believed that giving training for food handlers regarding to safe handling of food can prevent foodborne infection and intoxication and this finding was in agreement with [44], who found that 96.7% of participants believe on training. In addition, 90.1% of the respondent’s advised that food handlers should make sure their nails short and clean. On the other hand, 85.15% of participants believed that improper handling of meat may pose public health hazard to the meat consuming community.

Table 3: Respondent’s food safety attitude in butcheries of Bair Dar city (N=101).
upinepublishers-openaccess-Food-Nutrition

This result was indicated that the odds of respondents who didn’t believe the health status of workers should be evaluated before employment had a probability of 5.18 times more contribution in beef contamination as compared to their counterparts (AOR=5.18 (2.03-8.12)). In this study, it was observed that food handlers who did not attend food safety training had the probability of contaminating meat with S. aureus 5 times more likely than those who have attended the training (AOR=5(2.13-9.17)) Table 5.

Food safety practices of respondents

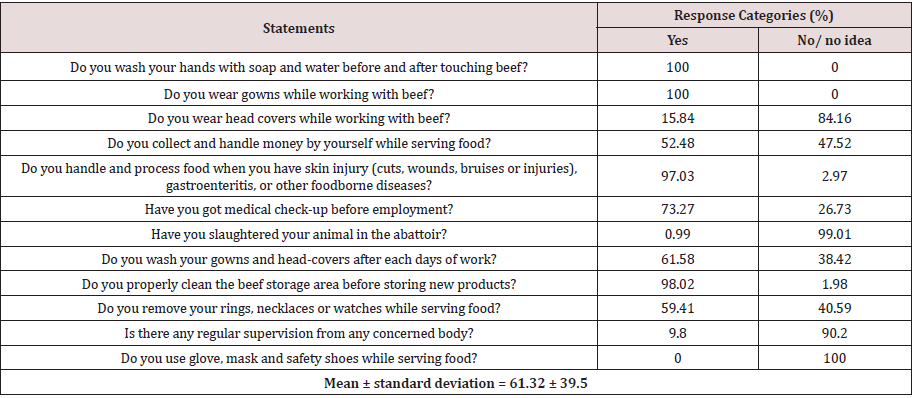
The average good food safety practice level of this finding was 67.64% with a maximum score percentage that all the respondents (100%) were always clean their hands with soap and water before and after touching meat (Table 4). In addition, all respondents were wearing protective gown. However, only 15.84% of the participants had wearing head cover and none (0%) of they were using face mask and glove. This practice was in contrary with the food hygiene principles of food handlers must wear suitable protective clothing to prevent contamination because, bacteria like S. aureus could live on the skin, nose, mouth, throat, ears and hair of humans and be transferred to food, work-surfaces and equipment by the food handler [45]. The overall practices of wearing protective clothes in the study area were poor and contradict with the recommendations of Ethiopian Ministry of Agriculture recommends that protective clothes (like gowns and hair cover) should be worn at all times when handling meat [46]. In this study, about 59.41% of the meat handlers were using jewelries like watches, earrings and rings which was against the principle that jewelry should not be worn in foodservice areas because bacteria and food could gather within them and the area underneath the jewelry warms up thus further encourage the growth and spread of bacteria [45,47]. In this research, the overall food safety knowledge level (75.39%) of respondents was better than the food safety practice of 67.64%, which supports the idea that although food handlers had good knowledge of food safety, they seldom applied this knowledge when handling foods [48]. This discrepancy between knowledge and practice may be explained by a few factors including reluctance to practice what they know due to negligence, lack of encouragement and the weak enforcement of sanitary provisions. Nearly half (48.52%) of the respondents had a practice of collecting and handling money while serving food. Money in hard currency is most widely and highly exchanged for goods and services for every trade in Ethiopia. This makes it as a prime transmission medium for various microorganisms and it may pose a major health hazard particularly, when meat and money were grasped together without washing hands [49]. Food safety practices respondents revealed that meat handlers who did not have every day gowns and head-covers washing practice had the likelihood of providing S. aureus contamination of their beef 3.16 times more than those handlers who had washing practice after each days of work (AOR; 3.16(1. 31–3.65). In addition, meat handlers who use rings, necklaces or watches while serving meat had 8.63 times higher probability of contaminating meat with S. aureus as compared to their counterparts (AOR; 8.63(5.23-10.17)) after considering other variables constant (Table 5).

Table 4: Respondent’s food safety practice in butcheries of Bair Dar City (N=101).
upinepublishers-openaccess-Food-Nutrition

Table 5: Multi-variable logistic regression analysis of factors associated with prevalence of S. aureus in butcheries (N=101).
upinepublishers-openaccess-Food-Nutrition

Conclusion and Recommendations

This study revealed that S. aureus was a major contaminant of ready-to-eat raw meat in Northwest Ethiopia. This was due to inadequate food safety training and low level of knowledge regarding to foodborne diseases. This necessitates education and training regarding to safe food handling and source of foodborne pathogens should be delivered for meat handlers. Awareness creation and strict follow-up with regular medical checkup should be installed for meat handlers. Poor habit of washing gowns and head-covers after each working day and in ability to remove jewelries like rings, necklaces or watches should be discouraged while serving food. This requires monitoring of cleanliness of food premises and food safety on a regular and more active basis, then carrying out a more comprehensive and effective law enforcement activities by the sanitarian authorities. Future epidemiological investigations should be conducted with type of strain and larger number of samples.

Availability of Data and Materials

The datasets used and/or analysed during the current study are available from the corresponding author on reasonable request.

Competing Interests

The authors declare that they have no competing interests.

Funding

The fund for this study was obtained from Mizan Agricultural Technical Vocational and Educational Training College and Bahir Dar University; College of Agriculture and Environmental Science

Authors’ Contributions

BT developed research idea and conducted the main study. TA and BA supervised, commented and corrected the research protocol, data analysis and all the write-up processes. All authors read and approved the final manuscript.

Acknowledgements

As per their contribution to this study, stuff members of Mizan Agricultural Technical Vocational and Educational Training College and Bahir Dar University are acknowledged. The support of laboratory technicians of Amhara Public Health Institute and Bahir Dar University Technology Institute, and butcher shop owners of Bahir Dar city is highly appreciated.

Read More About Lupine Publishers Journal of Food and Nutrition Please Click on Below Link:
https://lupine-publishers-food-and-nutrition.blogspot.com/

Saturday, 22 July 2023

Lupine Publishers | The Combined Effects of IgA-Mediated Immunity and Rice Consumption in Suppressing COVID-19 Infections

 Lupine Publishers | Journal of Food and Nutrition


Abstract

The number of COVID-19 cases in 19 major countries on 5 continents revealed a strong negative correlation with rice consumption per capita. As previously reported, the overall frequency of IgA-deficiency is inversely correlated with COVID-19 infection. We therefore studied the correlation between rice consumption and IgA-deficiency in a subset of 8 countries for which enough data were available. The results revealed a negative correlation with a coefficient of determination (R2) of 0.55. To further confirm the relationship between rice consumption and COVID-19 cases, we selected 9 Asian countries. The result was the same as described, and countries with the rice consumption more than 80-100kg/capita/year showed the lower incidence. In Japan, the specific COVID-19 infection rate by age groups was investigated, in relation with average rice consumption by age categories. The crude correlation between rice consumption and COVID-19 incidence was -0.59, but the age-adjusted correlation became -0.81. These suggested that SARS-CoV-2 infection is strongly affected by staple foods, and that rice dieters have a stronger innate immunity toward COVID-19. Improvement of agricultural policies and eating habits, especially the promotion of brown rice food and rice bran, are expected to be useful strategies against to counter the coronavirus pandemic.

Keywords: COVID-19; Innate immunity; Rice consumption; IgA deficiency; Statistics

Introduction

We have previously reported that brown rice eaters are less likely to be obese and in healthy state [1,2]. They showed a daily bowel movement and good stool figures. Their intestinal microbiota showed a predominance of Firmicutes phyla, including Blautia, Faecalibacterium, Ruminococcus generi. These are known to contribute to the balance of innate immunity. We considered this microbiota pattern to be a possible factor to explain large differences in COVID-19 infection rates between Japan and Western countries. Statistical analysis based on data from 19 major countries on 5 continents revealed a strong negative correlation (coefficient of determination = 0.59) between rice consumption and the incidence of COVID-19 cases [3]. By contrast, wheat consumption showed a positive correlation. The cumulative number of COVID-19 patients per 100,000 population varies between countries [4-6] Spain and Italy have more than 30, many European countries have between 10 and 20. And East Asian countries have 0.1-0.3. Various host factors can influence mortality, but innate immunity prevails at the initial stage of infection. IgA is a major factor of mucosal immunity, but genetic deficiency of IgA is common in Caucasians [7-10]. We found that COVID-19 infection was paralleled with IgA deficiency [11]. Diarrhea and other gastrointestinal symptoms occur in about 10% of people with SARS-CoV-2 infection. The infected pharyngeal epithelium may fall into the digestive tract along with saliva, and infection may be established when the intestinal immunity is weak. IgA has a secretory form, and IgA deficiency is common in Europe and the United-States, compared people of East-Asian origin. This difference may also explain variations in COVID-19 mortality. So, we felt it was necessary to further investigate the relationship between the frequency of IgA deficiency and rice consumption by comparing countries. Another question was how much is the effective dose of rice consumption? To analyze more deeply, we selected rice-eating countries in Asia, and analyzed the relationship between rice consumption and COVID-19 incidence. Rice consumption habits have decreased by half during the last 60 years in Japan. So, we watched the relationship between rice consumption and COVID-19 to know whether or not the decreasing rice consumption effected on the incidence by age subpopulation.

Statistical Analysis

The coefficient of determination was calculated by the least square method and regression analysis of two variables, using the IBM-SPSS version 24 software [12]. Data on per capita consumption of rice by country (kg/year, 1998) and the incidence of new corona cases are based on the literature [13,14]. Original data on rice consumption come from the USDA (United States Department of Agriculture) in which rice consumption was defined as the amount of polished rice ingested per individual per year. In a previous report, we used data on rice consumption in 1998. This time for Asian countries we adjusted the 60-year average to secular changes observed from 1960 to 2019 and re-calculated the correlation. Regarding IgA-deficiency, data are available for a limited number of countries: Saudi Arabia, Nigeria, Italy, Spain, the United Kingdom, the United States, China and Japan [6-8].
Trends in rice consumption in 9 Asian countries (Vietnam, Myanmar, Indonesia, Thailand, Philippines, China, India, South Korea and Japan), were obtained from the USDA [15]. The cumulative number of COVID-19 infected persons in Japan (as of June 6, 2020) relative to 1 million people was used as the dependent variable. In Japan, the age-related distribution of COVID-19 patients could be obtained, so rice consumption was estimated using the same age categories. Rice consumption by age categories was calculated by using lifetime rice consumption as the denominator. For example, if people were in their 50s, the cumulative total for the previous 55 years was divided by 55 to obtain the annual consumption.

Correlation between rice consumption and IgA deficiency

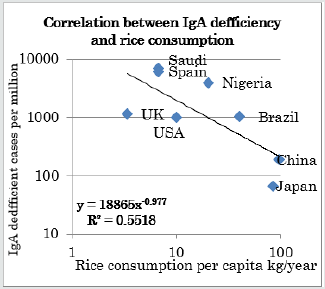
Figure 1:Correlation between IgA deficiency and rice consumption by country.

upinepublishers-openaccess-Food-Nutrition

In Figure 1, the horizontal axis shows rice consumption per capita (kg/year) and the vertical axis shows the number of IgA deficient people per million. Both axes use logarithmic scales. The coefficient of determination is 0.55, confirming a negative correlation.

Rice consumption and COVID-19 incidence in Asian countries

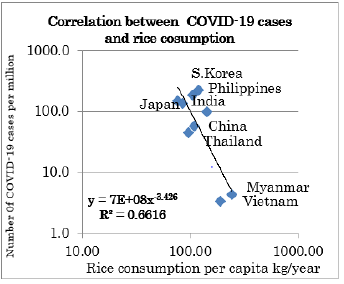
The next survey was conducted on the number of infected people in nine Asian countries. A negative correlation was also confirmed by coefficient of determination is 0.55 in Asian countries (Figure 2).

Figure 2: Correlation between COVID-19 patients and rice consumption in Asian countries.

upinepublishers-openaccess-Food-Nutrition

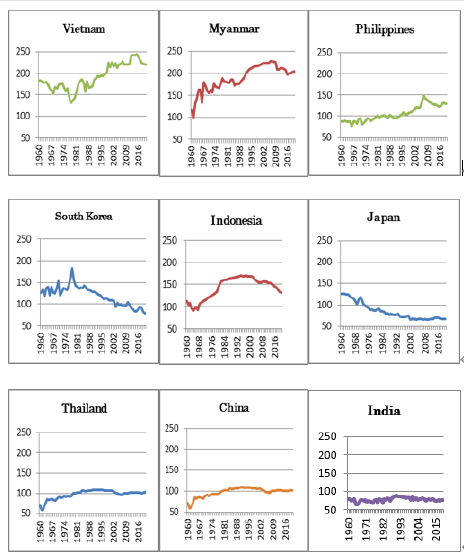
We investigated the transition of rice consumption in nine Asian countries for 60 years, according to world food statistics. Rice consumption increased in Vietnam and Myanmar, where the number of infected people is low, while rice consumption was halved in Japan and South Korea, where the number of infected people was high. There was little change in rice consumption in the other five countries (Figure 3).

Number of infected people and rice consumption in Japan by age categories

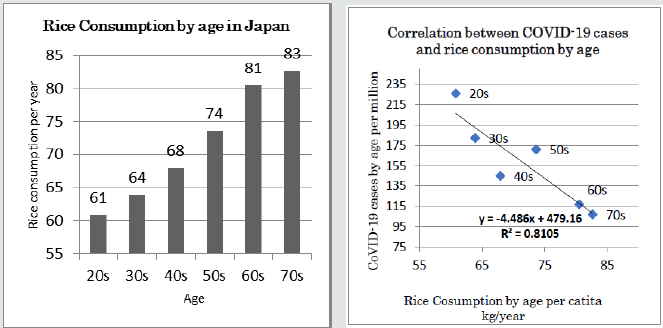
The annual per capita rice consumption of Japanese people has halved in 50 years due to the Westernization of food, as shown in Figure 3. On the other hand, according to the Nikkei Corona Statistics of 2020/6/10, the age distribution of people infected with SARS-CoV-2 shows a higher incidence in younger age groups [16]. Figure 4 shows the correlation between the number of infected people (per 100,000 population) in Japan and rice consumption by age group (20s to 70s). The coefficient of determination is very high at 0.82. Infection resistance seemed to decrease as rice is no longer the main staple food.

Figure 3: Changes of rice consumption in Asian countries High consumption was kept in Myanmar and Vietnam. Most countries kept more than 80kg/year, but Korea and Japan decreased below the 60kg/year.

upinepublishers-openaccess-Food-Nutrition

Figure 4: Estimated rice consumption in age category in Japan and age-related COVID-19 incidence. Younger generations who left rice eating habit showed a higher incidence.

upinepublishers-openaccess-Food-Nutrition

Discussion and Conclusions

Our data suggested that infection with SARS-CoV-2 coronavirus is strongly affected by the nature of staple foods [3]. The reason would be that rice dieters have a favorable intestinal microbiota profile, which strengthens their innate immunity to suppress COVID-19 infection [2]. This is more clearly shown by the lower incidence of COVID-19 observed in East-Asia, typically in Vietnam and Myanmar. In Japan and South Korea, rice consumption has been decreasing almost by half, and younger people showed a higher incidence of COVID-19. An exception is Taiwan, where the COVID-19 incidence rate has remained low despite a markedly decreased consumption of rice. Dietary factors other than rice may be involved, like vegetables [17,18]. However, Italy and Spain, where Medeteranean diet is common have not shown signs of suppression of corona pandemic [4-19]. In Taiwan another factor would be the strong leadership of public health specialists, who took measures based on their experience of SARS. This confirms the importance of political leadership for the success of public health measures. The epidemiological situation of the new coronavirus pandemic varies greatly from country to country. Why has Japan been less affected? Professor Shinya Yamanaka of Kyoto University has called upon the world to broaden investigations of an unknown factors X. The authors think that “X = rice”, and that rice eaters have better innate immunity. This hypothesis is supported by a statistically significant negative correlation between the prevalence of IgA-deficient people and the magnitude of local rice consumption. The coefficient of determination is 0.75 for a total population of 4.5 billion people in 19 major countries (58% of the world population). Furthermore, in the Japanese subpopulation the negative correlation is even stronger (R2 = -0.82) after adjustment for age. Based on the above, the authors believe that rice eaters have higher immunocompetence and thus suppress more easily SARS-CoV-2 infection.
It is expected that the pandemic due to virus infection will hit again. Among future measures, it is important to scale up the capacity of health systems, but it is difficult to predict if vaccines will be available, and there are economic constraints to their deployment in developing countries. As measures against virus infection from a medium to long-term perspective, it is recommended to incorporate rice in the diet, promote the use of brown rice and rice bran, and review the capacity of rice farming. It would be the best way to keep the advantage of intestinal innate immunity [20-22]. Improvements in agricultural policies and eating habits, especially the promotion of brown rice and rice bran, are expected to be effective strategies to counter the COVID-19 pandemic [23,24]. The main functional nutrients contained in rice are vitamins, minerals, and antioxidants, with decreasing relative contents as one moves from rice bran, brown rice, polished rice and flour. The mechanisms whereby rice strengthens the intestinal innate immunity relate to dietary fibers and short-chain fatty acids produced by particular intestinal bacteria which stimulate regulatory T cell proliferation [25,26]. The suppression of cytokine storm seemed to be effective to prevent severe COVID-19 infections. We regard brown rice as “Medical Rice” and we are working to promote its spread [27,28]. It should be noted that with the advance of food in Europe and the United States, rice consumption in Korea, Taiwan, as well as Japan, has halved in 50 years. If this tendency is left unchecked, there is a risk that resistance to infection will fall to similar levels seen in the West.

Acknowledgement

The authors deeply appreciate Dr. Philippe Calain for his sincere discussion and editing of this manuscript.

COI

The authors declare that there are no conflicts of interest.

Read More About Lupine Publishers Journal of Food and Nutrition Please Click on Below Link:
https://lupine-publishers-food-and-nutrition.blogspot.com/
Saturday, 10 June 2023

Lupine Publishers | Standardization of Technology for Preparation of Sani-A Jaggery Based Crushed Sesame

 Lupine Publishers | Journal of Food and Nutrition


Abstract

Sesame seeds are used in the preparation of a number of food products. In north India, the black sesame seeds are used in preparation of Sani-Jaggery based crushed sesame. In this study an attempt was made to standardize the method for preparation of sani and enrich its quality with addition of different levels of dry fruits (cashewnuts and Almonds, date, Figures, Coconut shreds) and Honey and also assessed organoleptic and storage stability. The standardized sani was organoleptically evaluated using a sensorial affective hedonic scale. The results indicate that Sani samples prepared from raw sesame with 60% Jaggery and mixed with different level of dry fruits and packaged in PET (Polyethylene Terephthalate) container and stored at room temperature got good mean score up to 25 days storage except honey-based samples which was spoiled after 10 days storage. It was revealed that among all the sani treatments, Sani prepared with 10% addition of shredded cashewnuts and almonds (1:1) got highest mean sensory score for overall acceptability up to 25 days storage. There was a considerable growth in the microbial population during storage of sani samples but recorded below the satisfactory level up to 25 days of storage. E. coli and Salmonella was not detected in any of the samples during entire storage period.

Keywords: Sani; Sesame; Sensory; Storability; Microbial load

Introduction

Sesame (Sesamum indicum L) is one of the world’s important and oldest oilseed crop known to man that plays an important role in human nutrition. Sesame seeds are good source of proteins, complex carbohydrates and some minerals. The chemical composition of sesame shows that the seed is an important source of oil (44-58%), protein (18-25%), carbohydrate (~13.5%) and ash (~5%). Sesame seed is of approximately 50 percent oil (out of which 35% is mon Ranganna ounsaturated fatty acids and 44% polyunsaturated fatty acids) and 45 percent meal (out of which 20% is protein) [1,2]. It is source of nutritional and helpful biologically active components, such as phytochemicals Kanu et al 2007. Presence of isoflovones and sesamin plays a role in human health. India is the second highest producer of sesame seeds after Myanmar with an annual production of 751000 MT, followed by China and Tanzania during year 2017(Anon., 2020). Gujarat contributes 30% of total production followed by West Bengal (17.8%), Rajasthan (17.6%), Tamil Nadu (7.6%) Andhra Pradesh (5.4%) and Madhya Pradesh (5.2%) [3].

Sesame seeds are used in the preparation of a number of food products. In the Far-East, sesame seeds are roasted (180-200 °C) and their oil is extracted and sold as roasted sesame oil. Sesame oil is used as a salad or cooking oil, in shortenings, margarine and to marinate meat and vegetables. The seed is also consumed throughout the world in condiments and as an essential constituent in different recipes. It is used to add texture and flavor to bread, biscuit, cracks and salad dressing. In Gujarat sesame seeds are used in preparation of till chikki and particularly the black sesame seeds are used in preparation of Sani. Sani is the product prepared by mixing the jaggery with raw or roasted sesame seeds and partially crushing in equipment called ghani until the oozing of oil from sesame seeds. Sometimes sani is enriched by using date, Figures, cashew nut, almond, gums, coconut and many other valuable ingredients. Sani is especially prepared and consumed in winter to keep the body warm and aiding blood circulation. But no scientific and standard method is available for the preparation of sani. Therefore, this study was proposed to standardize the method for preparation of sani and to evaluate it’s organoleptic.

Materials and Methods

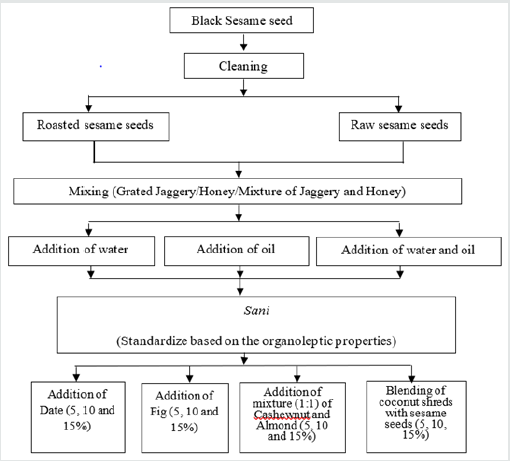
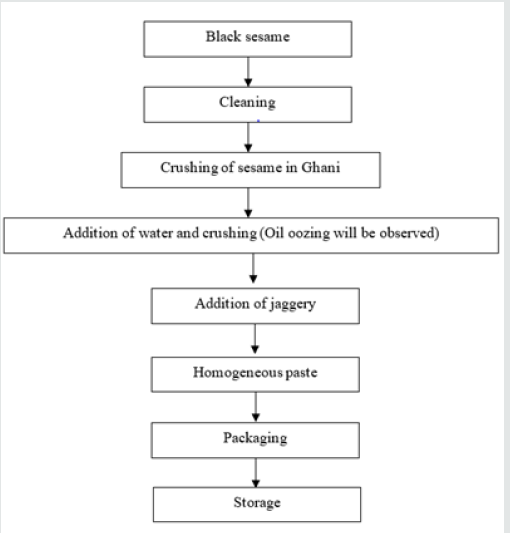
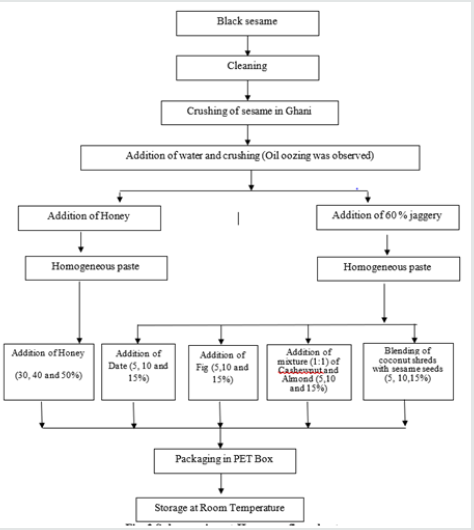
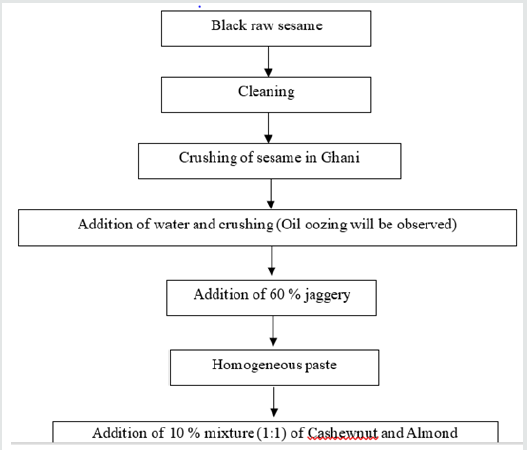
Initially Sani-Jaggery based crushed sesame was developed according to the experimental details shown in Figures 1. Earlier, it was decided to add oil and oil with water but during the experimentation, it was found that oil separated out during the crushing process was sufficient to prepare the sani. So, there was no need to add extra oil. Hence, it was decided to discard the treatment of addition of oil and oil with water. The sani prepared using honey was found to be sour after 3-4 days of its preparation. The samples added with honey got the good sensory score, but its shelf life was shorter. Keeping all these facts in view, the experiment was divided in to two parts viz., sub-experiment-I and sub-experiment-II as per flow charts given in Figures 2 & 3, respectively. All the samples of both experiments (Sub Exp-I &Exp-II) were kept for 1 month of storage and analyzed in terms of arithmetic mean of their sensory attributes such as taste, flavour, colour, texture, appearance and overall acceptability at 5 days interval by 9-points Hedonic scale standard method as suggested by Ranganna et al. [4]. Mean sensory score of different attributes table is presented here under. The panelists from different ages including students and faculties were given the coded samples of sani and allowed to judge the samples for different sensory attributes based on their degree of preference [5-8].

Figure 1: Experimental process flow chart for the preparation of Sani.

upinepublishers-openaccess-Food-Nutrition

Figure 2:Sub experiment-I process flow chart.

upinepublishers-openaccess-Food-Nutrition

Figure 3: Sub experiment-II process flow chart.

upinepublishers-openaccess-Food-Nutrition

Experimental Details Sub-experiment I

The sub experiment I was carried out as per details and flow chart given below.

Independent parameters

Type of sesame (A): (A1= Roasted and A2= Raw). Level of Jaggery (B): (B1=40 %, B2=50 % and B3=60 %).

Results and discussion of sub-experiment I

Effect of sub-experiment-I treatments on organoleptic properties viz., taste, flavor, texture, Color, Appearance and Overall acceptability were studied, and their results are summerized below.
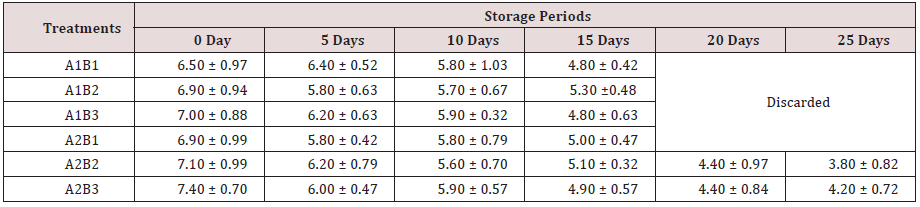
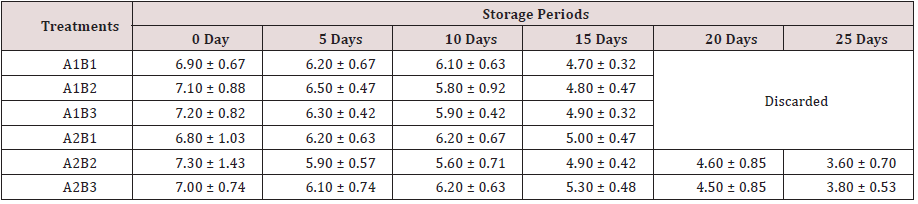
From the Table 1, it can be seen that the sensory mean score for the taste of different samples was decreased with an increase in storage period. On the first day, the highest mean score for the taste was reported for the sample A2B3 (7.40±0.70) followed by A2B2 (7.10±0.99). It was also noted that after 15 days of storage treatmets A1B1, A1B2, A1B3 and A2B1 were spoiled hence this four treatments are discarded. A2B3 treatment got highest taste mean score (4.20±0.72) followed by treatment A2B2 with taste mean score(3.80±0.82) after 25 days storage.

Table 1: Mean score for Taste of different samples at 5 days interval of storage (Mean ± SD, n=10).

upinepublishers-openaccess-Food-Nutrition

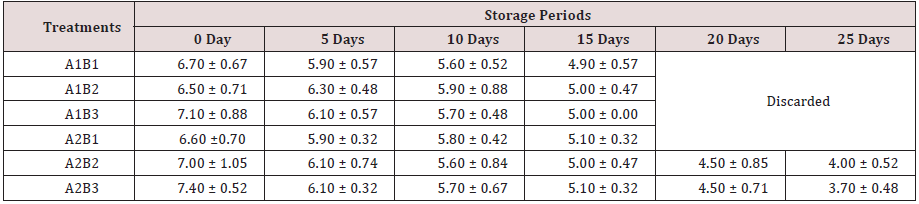
From the Table 2 it can be seen that as the storage period increases, the sensory mean score for the flavour decreases. On the first day, treatment A2B3 had highest mean score (7.46) followed by treatment A2B2 (7.40±0.52). But after 25 days of storage, remainig both treatments had decreased sensory mean score for the flavour, treatment A2B2 and A2B3 had sensory mean score of 4.00±0.52 and 3.70±0.48 respectively.

Table 2: Mean score for flavor of different samples at 5 days interval of storage (Mean ± SD, n=10).

upinepublishers-openaccess-Food-Nutrition

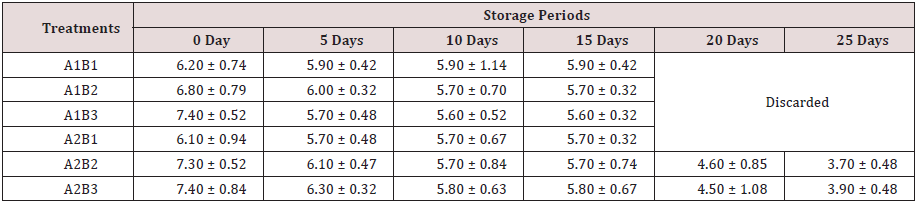
From the Table 3, it can be seen that as the storage periods increased, the sani had poor texture. As the time passed, sensory mean score of the texture decreased. The product slightly got dried-up due to evaporation of moisture which also resulted in decrease in texture mean score. The sani found harder with the increase in storage period. On the very first day, the treatment A1B3 and A2B3 found highest sensory mean score (7.40) followed by the treatment A2B2 (7.30±0.52). Hardness in the form of texture increased as the storage life increased. At the end of the 25 days treatment A2B3 had mean score of 3.90±0.48 for the texture followed by 3.70±0.48 (A2B2).

Table 3: Mean score for Texture of different samples at 5 days interval of storage (Mean ± SD, n=10).

upinepublishers-openaccess-Food-Nutrition

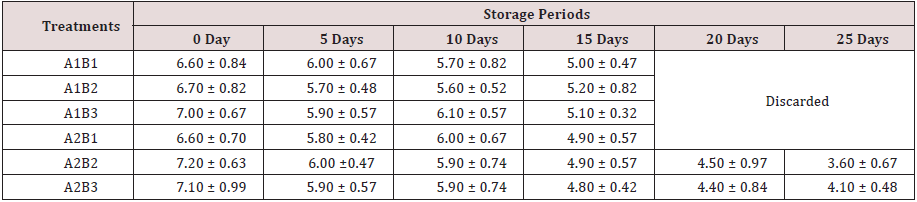
From Table 4, it can be seen that the mean score for the appearance decreased as the storage period increased. At the first day, the treatment A2B3 had the highest mean score of 7.20±0.63 followed by A2B3 (7.10±0.99) and A1B3 (7.00±0.67). At the end of the Day-25, the sensory mean score for the appearance decreased in comparison to Day 25. The (4.10±0.48) mean score was noted for the treatment of A2B3followed by treatment A2B2 (3.60±0.67).

Table 4: Mean score for appearance of different samples at 5 days interval ofstorage (Mean ± SD, n=10).

upinepublishers-openaccess-Food-Nutrition

Table 5 represents the mean sensory mean score for the color of different sani samples. From the data, it can be seen that highest mean score for color was noted for the treatment A2B2 (7.30±1.43) followed by A1B3 (7.20±0.82). But as the storage period increased, mean score for the color decreased and at the end of the Day-25, treatment A2B3 had highest mean score for the color (3.80 ± 0.53) followed by A2B2 (3.60±0.70).

Table 5: Mean score for color of different samples at 5 days interval of storage (Mean ± SD, n=10).

upinepublishers-openaccess-Food-Nutrition

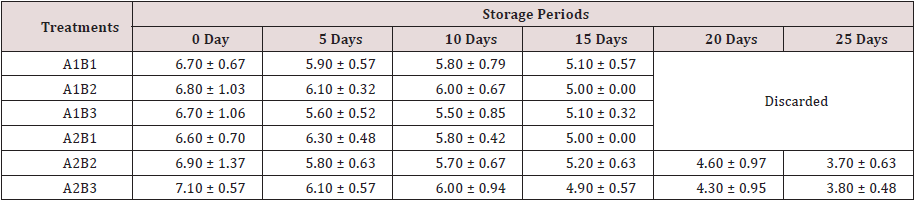
Table 6 represents the overall acceptability of the different treatments. It can be seen that the mean score for the overall acceptability decreased as the storage period increased. At the first day, the treatment A2B3 had the highest mean score of 7.10±0.57followed by A2B2 (6.90±1.37) and A1B2 (6.80±1.03). At the end of the Day-25, the sensory mean score for the overall acceptability decreased in comparison to Day 1. The highest mean score was rated for the treatment of A2B3 (3.80±0.48) followed by A2B2.

Table 6: Mean score for overall acceptability of different samples at 5 days interval ofstorage (Mean ± SD, n=10).

upinepublishers-openaccess-Food-Nutrition

Results of sub experiment I

Sani samples were prepared according process flow chart shown in Figures 2 and packaged in PET (Polyethylene Terephthalate) container and stored at room temperature. During storage it was found that the mean sensory score of all treatments were decreased, but remained well within acceptable limits during 15 days storage period. After the 15 days storage the treatment A1B1, A1B2, A1B3 and A2B1 were spoiled therefore after 15 days storage period, these four treatments were discarded. The mean sensory score of treatments A2B2 and A2B3 reported within acceptable limits up to 25 days storage period.
Among these two treatments, treatment A2B3 (raw sesame with 60% Jaggery) had the highest mean score of 7.10±0.57 for overall acceptability. Treatment A2B3 also got good sensory mean score up to 25 days storage. Keeping above fact in view, it is revealed that the raw sesame with 60% Jaggery is best combination for sani making process.

Further the Sub experiment-II was carried out to developed Sani as per treatment A2B3 (raw sesame with 60% Jaggery) of sub experiment-I with addition of dry fruits at different levels according to the experimental details and flow chart given below.

Experiment details of sub-experiment II

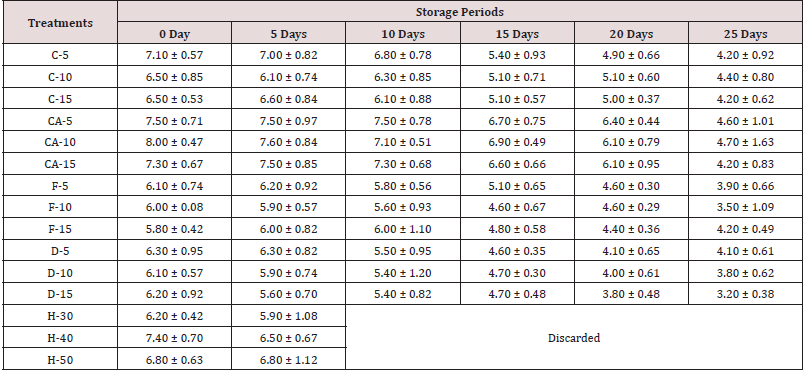
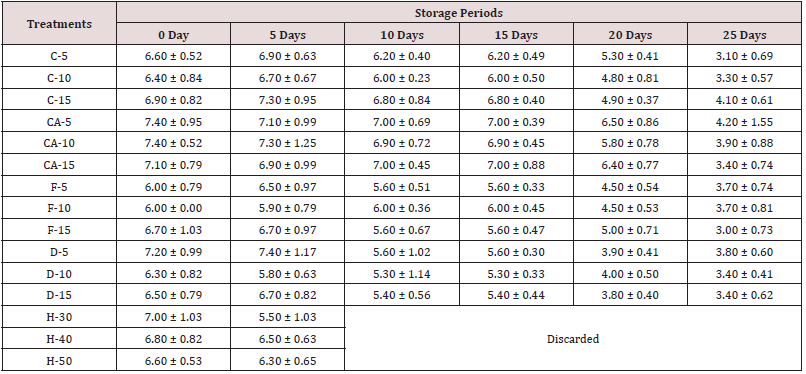
Effect of different treatments on Taste of sani sample at 5 days’ intervals of storage is reported in the Table 7. From the data it can be seen that the mean sensory mean score for the taste of different samples was decreased with an increase in storage period. On the first day, the highest mean score for the taste was reported for the sample CA-10 (8.00±0.47) followed by CA-5 (7.50±0.71). From the data, it can also be seen that fresh honey-based samples got good sensory mean score but after 10 days of storage, they started to become sour so they were discarded after 10 days of storage. After 25 days of storage, the highest taste mean score (4.70±1.01) was observed for the treatment CA-5 and CA-10 while the lowest taste mean score (3.20±0.38) was recorded by the treatment D-15.

Table 7: Taste mean score of different sani treatments at 5 days intervals of storage (Mean ± SD, n=10).

upinepublishers-openaccess-Food-Nutrition

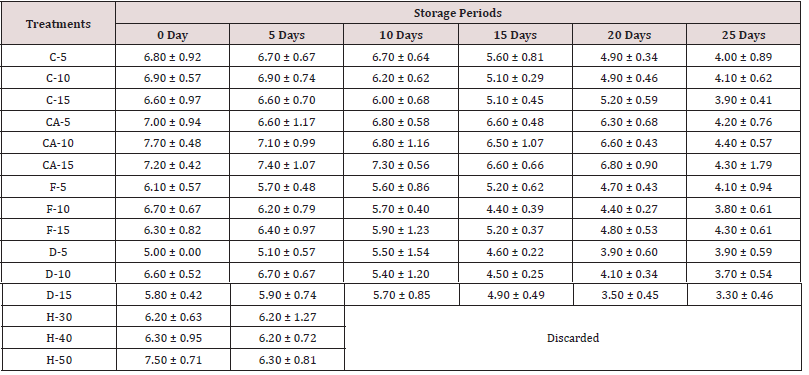
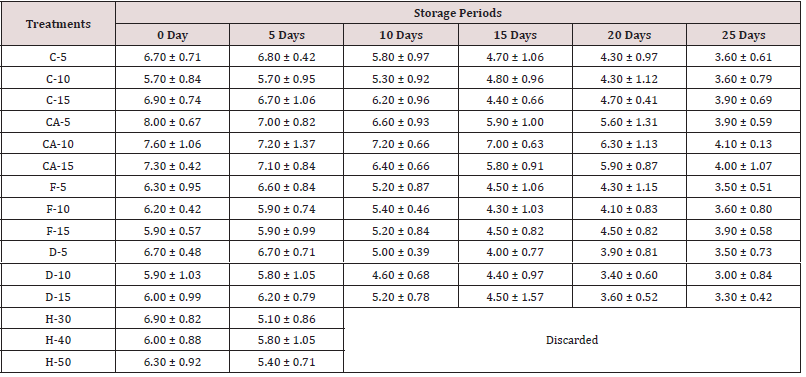
Table 8 represents the Flavor mean score of different sani treatments at 5 days’ intervals of storage.it can be observed from the Table 8, that the mean sensory score for the flavor of different samples was decreased with an increase in storage period. On the first day, the highest mean score for the flavor was found for the sample CA-10 (7.70±0.48) followed by CA-5 (7.00±0.94). At the end of 25 days of storage, the highest flavor mean score (4.40±0.57) was observed for the treatment CA-10 while the lowest taste mean score (3.30±0.46) was reported by the treatment D-15.

Table 8: Flavor mean score of different sani treatments at 5 days intervals of storage (Mean ± SD, n=10).

upinepublishers-openaccess-Food-Nutrition

The influence of different treatments on Texture of sani sample during storage is shown in Table 9. From the data it was noted as the time passes, sensory mean score of the texture decreases. The sani found harder with the increase in storage period. At the first day, the cashewnuts and Almonds added Sani sample got highest mean score. The treatment CA-5 and CA-10 had the highest mean score of 7.40±0.95followed by D-10 (7.20±0.99). At the end of the 25 day, the sensory mean score for the texture decreased in comparison to 1st Day and the highest mean score was rated for the treatment CA-5 (4.20±1.55) followed by C-15 (4.10±0.61).

Table 9: Texture mean score of different sani treatments at 5 days intervals of storage (Mean ± SD, n=10).

upinepublishers-openaccess-Food-Nutrition

Table 10 represents the color mean score of different sani treatments at 5 days’ intervals of storage. It can be seen that the mean score for the color decreased as the storage period increased. At the first day, the treatment CA-5 had the highest mean score of 8.00±0.67followed by CA-15 (7.30±0.42). At the end of the 25 days, the sensory mean score for the color decreased in comparison to 1st day and the highest mean score was rated for the treatment CA-10 (4.10±0.13) followed by CA-15 (4.00±1.07).

Table 10: Color mean score of different sani treatments at 5 days intervals of storage (Mean ± SD, n=10).

upinepublishers-openaccess-Food-Nutrition

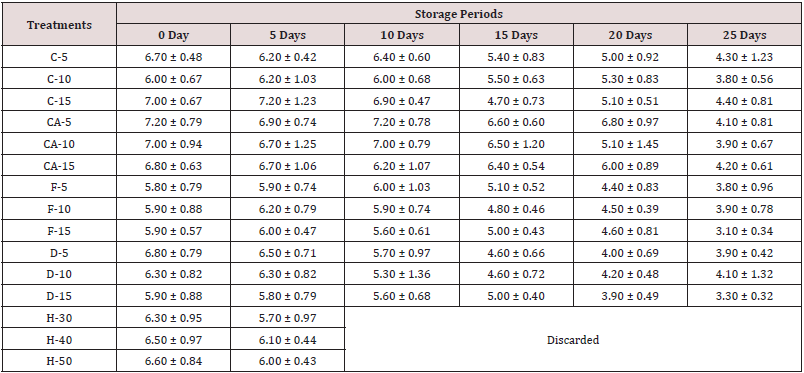
Table 11 represents the appearance mean score of different sani treatments at 5 days’ intervals of storage. Mean score for the appearance is gradual decline in sensory attributes during storage in all treatments. At the first day, the treatment CA-5 had the highest mean score of 7.20±0.79, followed by C-15 (7.00±0.67) and CA- 10 (7.00±0.94). At the end of the 25 days, the highest sensory mean score for the appearance was rated for the treatment C-15 (4.40±0.81) followed by treatment C-5 (4.30±1.23).

Table 11: Appearance mean score of different sanitreatments at 5 days intervals of storage (Mean ± SD, n=10).

upinepublishers-openaccess-Food-Nutrition

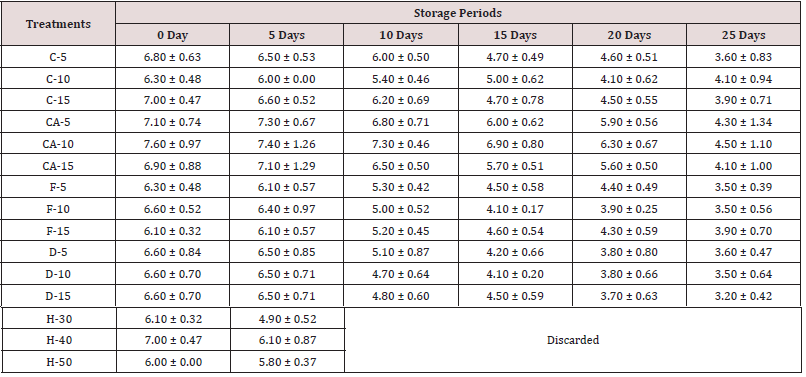
It is clearly observed from the Table 12 data that the mean score of overall acceptability of the different sani products stored at room temperature decreased with the passage of time. On the first day, the highest mean score for the overall acceptability was found for the sample CA-10 (7.60±0.97) followed by CA-5 (7.10±0.74). At the end of 25 days of storage, the highest overall acceptability mean score (4.50±1.10) was observed for the trea

Table 12: Overall acceptability mean score of different sani treatments at 5 days intervals of storage (Mean ± SD, n=10).

upinepublishers-openaccess-Food-Nutrition

Microbial status of sani during storage

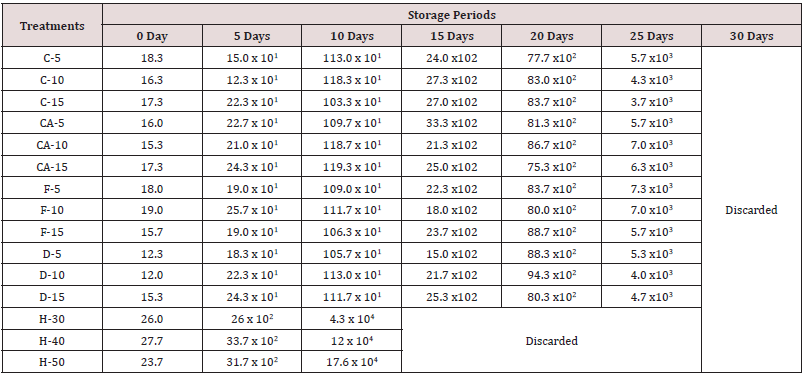
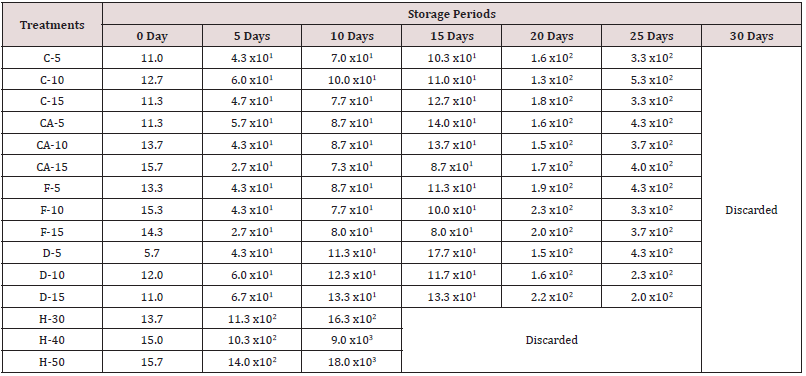
Microbial analysis in terms of Total plate count (cfu/g), yeast & mould (cfu/g), E. coli (cfu/g) and Salmonella (cfu/g) count were determined as described by AOAC 2006 [7] 18th ed. 1g of each sample was added to 9ml sterile distilled water and vortexed. This formed the initial dilution from which subsequent tenfold dilutions were made and used for analysis. Portions 0.1ml of different serial decimal dilution was spread plated on nutrient agar for total plate count and potato dextrose ag APEDA ar for fungi count. Total plate count and Yeast & Mold count (cfu/g) are presented in Table 13 & 14. E. coli and Salmonella was not detected in any of the samples during entire storage period.

Table 13: Total plate count (cfu/g) of different sani treatments at 5 days intervals of storage.

upinepublishers-openaccess-Food-Nutrition

Table 14: Yeast & Mould count (cfu/g) of different sani treatments at 5 days intervals of storage.

upinepublishers-openaccess-Food-Nutrition

The perusal of Table 13 & 14 revealed that there was a considerable growth in the microbial population during storage of different sani samples. In jaggery based sani counts were recorded below the satisfactory level i.e. < 1x10⁴ cfu/g hence, assumed to be safe and fit for human consumption up to 25 days of storage. After the 30 days of storage all the samples cross the recommended level of total plate count as well as yeast & mould count, therefore all the sample were discarded after 30 days of storage. It was observed that the honey based sani gave the satisfactory results for microbial population up to 5 days’ storage. After the 10 day of storage, honey became sour and microbial population of the honey-based samples was reached above the prescribed limit. They are assumed to be unsafe for human consumption so, all the honey-based samples were discarded after 10 days of storage.

Conclusion of sub-experiment-II

Sani samples prepared from raw sesame with 60% Jaggery and mixed with different level of dry fruits according to process flow chart shown in Figures 3 & 4. The samples were packaged in PET (Polyethylene Terephthalate) container and stored at room temperature during the sub experiment-II. All the samples got good mean score up to 25 days storage except honey-based samples which was spoiled after 10 days storage. Therefore, all the honeybased samples were discarded after 10 days storage. It was found that among all the sani treatments, treatment CA-10 (Sani prepared with 10% addition of Cashewnuts and Almonds (1:1)) got highest mean sensory score for overall acceptability up to 25 days storage. The treatment CA-10 had overall acceptability mean score of 7.6 on 1st day and 4.5 on 25th day of storage (Table 15).

Figure 4: Standardized method for sani preparation process flow chart.

upinepublishers-openaccess-Food-Nutrition

Table 15:

upinepublishers-openaccess-Food-Nutrition

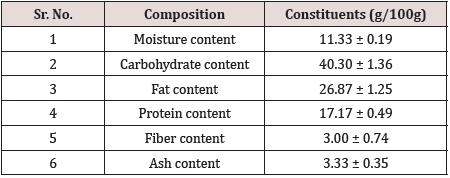
The Bio-Chemical Analysis of Optimized Sani Sample

The bio-chemical constituent of optimized sani sample was analyzed in triplicate for moisture content, fat content, protein content, fiber content and ash content using standard methods of Association of Official Analytical Chemists (AOAC, 2006). The carbohydrate content was obtained by difference (i.e. subtracting the values obtained for moisture content, fat content, protein content, fiber content and ash content from 100). The results are as under.

Conclusion

In this present study the formulation and process for preparation of sani enriched with different level of dry fruits were standardized. The research data discovered from this research suggest that Sani should be prepared from black raw sesame with 60% jaggery added with 10 % Cashewnut and Almond (1:1). The sani prepare from this method and packed in PET (Polyethylene Terephthalate) container safely stored at room temperature without quality deterioration up to 25 days storage except honey-based samples which was spoiled after 10 days storage.

Acknowledgments

The authors are grateful to Project Coordinator (Sesame & Niger), All India Coordinated Research Project on Sesame and Niger, ICAR authors would also like thank to the Junagadh Agricultural University for cooperation and provided necessary facilities to achieve the desired goals of this research.

Conflict of Interest

We declare that we have no conflict of interest.

Read More About Lupine Publishers Journal of Food and Nutrition Please Click on Below Link:
https://lupine-publishers-food-and-nutrition.blogspot.com/
Wednesday, 5 April 2023

Lupine Publishers | The Climate does not Change from Carbon

 Lupine Publishers | Journal of Food and Nutrition


Opinion

The climate is changing from the artificial fumes that mankind has created. Artificial fumes differ from natural fumes in quality, volume and speed. Water is intended only for consumption-for drinking. But we, not understanding her essence, made her a slave. Turned into a working reagent, a means of increasing comfort. They began to use it as a liquid to wash everything and everything, move it with pumps, heat and boil, cool, dissolve all chemical elements in it, fill in the fields, destroy its molecules in the air with engines, furnaces and compressors. Almost everything used goes into the atmosphere, bypassing the biota, with unnatural fumes directly and from the sewer sumps. Artificial fumes destroyed the everlasting process of sedimentation, which has been developing for millions of years. A different structure of water molecules of new volumes, evaporation rates form a different mechanism. New quantities create new qualities. The processes of concentration, movement, interaction with the atmosphere have changed - pressure, temperature, moisture transfer in new time parameters have changed. Uncontrollable in volume and time, precipitation is formed in other volumes, in a different quality, and falls in other places. Therefore, floods occur in some places, droughts - in others. Therefore, the level of the oceans rises - heavy clouds do not reach the mountain and polar glaciers. The hypothesis requires proof. The proof of the hypothesis leads to discovery. The discovery should lead to a new concept. The basis of the concept is the return of its natural functions to water. These functions are embedded in wild forests and untouched areas. But with our desire for comfort, we took over 70% of the land from nature -flooded with reservoirs, plowed, covered with garbage and ore landfills, structures, and roads (Figure 1).
Throughout this area there was vegetation and living creatures, which processed water into vapors and vapors having special qualities. You can still save life on the planet. Not by appeals and wishes, but by fundamentally restructuring our attitude towards water, reducing our water needs, making this a strategy of every state, every person. Nature urgently needs to return its natural process of water circulation. All the cares, work, movement on green technologies, reducing carbon dioxide emissions, alternative energy, preserving biodiversity, protecting, and restoring nature-all this is combined under a single action. There are such opportunities if we use the experience of developed countries and use many inventions in this direction. It is known that in the Scandinavian countries and Japan there are no more landfills; in Israel, plant products are grown with minimal water consumption. Famous houses with vertical and roof landscaping. Known inventions that allow you to generate electricity without reservoirs in rivers. There are ways to economically consume water on airplanes and trains. All such measures should be developed and applied when using water in all technologies in all cities and countries. Only returning it to nature, the accumulated water cycle for millions of years, can reduce natural disasters and stop climate change. Performing such tasks is necessary for the whole world, each enterprise, each country, each person.

Thursday, 2 March 2023

Lupine Publishers | Low COVID-19 Infection and Mortality in Rice Eating Countries

 Lupine Publishers | Journal of Food and Nutrition


Abstract

The relationship between rice consumption and the cumulative number of COVID-19/1000000 at June 6, 2020 was examined after compilation of data from 19 major countries on 5 continents. A strong negative correlation with a coefficient of determination of 0.59 was found. On the contrary, wheat consumption showed the positive correlation. This suggests that resistance to SARS-CoV-2 infection is influenced by the nature of staple foods. This is compatible with previous findings indicating that rice eaters have a specific profile of intestinal microbiota, which strengthens the innate immunity to virus infection. Lower infection rates in Asia than in the West appear to be partly due to dietary differences. Improvements in agricultural policies and eating habits, especially the promotion of the use of brown rice food and rice bran, should be part of the national strategies to counter the COVID-19 pandemic.

Keywords: COVID-19; Innate Immunity; Rice; Brown Rice; Wheat

Introduction

“Let food be thy medicine and medicine be thy food.” This quote is attributed to Hippocrates in ancient Greece. The idea of a link between medicine and food stems from the concept of common grounds for illness, health, and diets. This thinking permeates all popular cultures, fitting in very nicely with an historical phenomenon. Recently, this concept has broadened our scientific horizon, and appears to apply to the case of COVID-19 infection as well [1]. Staple foods of the world are roughly divided into those made from rice and or wheat. Rice is popularly used in Asia, and wheat is used in Europe and America. To test the hypothesis that dietary differences play a role in the immunity to COVID-19 infection, we looked for a possible correlation between rice consumption, and SARS-CoV-2 virus infection and mortality.

Methods, Data and Statistical

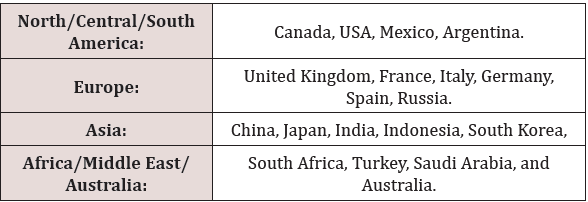
Country data on the daily incidence of cases and deaths (per 1 million inhabitants) caused by COVID-19 are publicly available [2,3]. The reference data were set at June 6, 2020. For correlation analysis, we selected a sample of 19 representative countries, distributed over 5 continents (Table 1). Of these countries, 18 are members of the G20 (Group of Twenty). Additional data from Spain was adopted. For the same countries, per capita consumption of rice and wheat (kg/year) were taken as independent variables. The source of food data is [worldfood.apionet.or.jp/web/9-1.htm]/jt, and data of 1998 were used [4]. The two variables were subjected to regression analysis after common logarithmic transformation. Correlations were calculated by the least square’s method by IBMSPSS ver.24.

Table 1: Selected countries by continent, and COVID-19 incidence as of June 6, 2020.

upinepublishers-openaccess-Food-Nutrition

Relationship between Per Capita Rice Consumption and Cumulative Number of COVID-19 Patients by Country

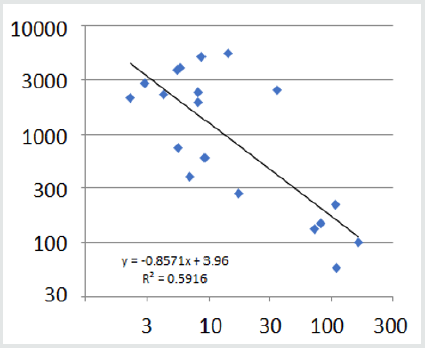
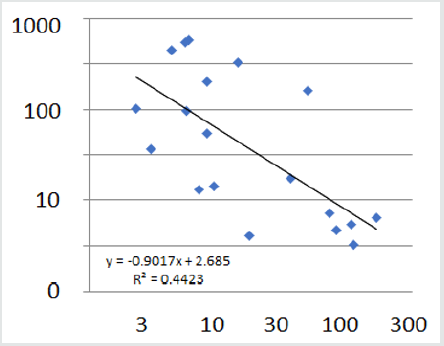
Figure 1 shows the rice consumption per capita (kg/year) on the horizontal axis and the number of COVID-19 infected people per million population on the vertical axis. Both axes are logarithmic. The coefficient of determination is 0.592, confirming a negative correlation. The mortality rate shows a weaker correlation (0.44) than the number of infected people, because the mortality data is independently affected by medical care and other conditions (Figure 2).

Figure 1: Scatter plots between number of COVID-19 patients and rice consumption per capita. Y-axis; Number of COVID-19 patients/million, X-axis; rice consumption/ capita kg/year.

upinepublishers-openaccess-Food-Nutrition

Figure 2: The scatter plot between the number of deaths per one million population and rice consumption per capita. Y-axis; Number of COVID-19 deaths/million, X-axis; rice consumption/capita kg/year.

upinepublishers-openaccess-Food-Nutrition

Correlation between Wheat Consumption and the Number of COVID-19 Cases

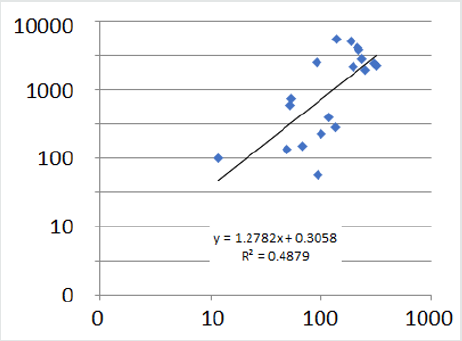
The correlation between the number of COVID-19 patients and the wheat consumption (kg/year) by country shows the positive correlation in contrast to the rice consumption. The correlation with wheat consumption is positive, quite contrary to rice, but the coefficient of determination is 0.49, which is smaller than Rice (Figure 3).

Figure 3: Scatter plot of wheat consumption by country and the number of COVID-19 patients. Y-axis; Number of COVID-19 patients/million, X-axis; wheat consumption/ capita kg/year.

upinepublishers-openaccess-Food-Nutrition

Discussion and Conclusion

The magnitude of the new coronavirus epidemic varies greatly from country to country. Why is the Japanese population less frequently infected? Why are there so many cases in America? Why are the situations of Asia and Europe so different? It seems that there has never been a model that can answer these questions consistently. We proposed a hypothesis that the high proportion of sIgA deficiency among Caucasians would be one explainable factor [1]. This time we conducted a statistical analysis by scatter plot of the correlation between staple food and coronavirus infection. The coefficients of determination between the number of infected people or the number of deaths, and rice consumption showed negative correlations of 0.59 and 0.44, respectively. Moreover, there was a positive correlation with wheat consumption. Such a big contrast could cover the effects of many other confounding factors, and strongly support the importance of innate immunity based on rice foods. These results suggest that rice eaters have an intestinal environment characterized by a special microbiota composition, whereby secreted short chain fatty acids stabilize the innate immunity by T17/Treg balance [5,6]. It appears that the Asian-type meal centered on rice and fish provides more resistance to virus infection than the Western-type meal centered on bread and meat. Among rice foods, it has been known that ingestion of brown rice and rice bran contributes greatly to health [7]. These methods could be employed for population-based prevention of the second wave COVID-19 pandemic in developed countries, and those still spared from the spread of corona virus infection in developing countries [8,9].

Acknowledgement

The authors deeply appreciate Dr. Philippe Calain for his sincere discussion and editing of this manuscript.

Read More About Lupine Publishers Journal of Food and Nutrition Please Click on Below Link:
https://lupine-publishers-food-and-nutrition.blogspot.com/
Friday, 23 December 2022

Lupine Publishers | Quality Issues Relating to Composition of Imported Honey into Saudi Arabia

 Lupine Publishers | Journal of Food and Nutrition


Abstract

This study evaluated the quality of honey imported from eighteen different countries into Saudi Arabia. Twenty pesticides, 5-hydroxymethlfurfural and the antibiotic chloramphenicol were analysed. Approximately 20% of honey was rejected out of 712 consignments. Ten countries breached the regulations for one or more of the following: exceeding the MRLs, using banned pesticides or presence of chloramphenicol. Three neonicotinoids; acetamiprid, imidacloprid and thiamethoxam was found in combination with other pesticides. The HMF content of honey from eight exporting countries exceeded 80mg/kg. Despite the years of monitoring for pesticides, breaches of MRLs continue to be reported. Recommendation for more stringent approaches to the management of pesticide along the supply chain are suggested as the implications to bee pollinators, environment and human life are wide, varied and unsafe.

Keywords: Pesticides; Monitoring; Honey; Saudi Arabia

Introduction

Honey is defined by Codex Alimentarius [1] as the natural sweet substance produced by honey bees from the nectar of plants or from secretions of living parts of plants or excretions of plant sucking insects on the living parts of plants, which the bees collect, transform by combining with specific substances of their own, deposit, dehydrate, store and leave in the honey comb to ripen and mature. The demand for natural sweeteners is on the increase globally [2-3] and many consumers prefer honey since it has a multitude of uses and benefits [4-5]. In Saudi Arabia, and in many other countries, the major motivators for consuming honey include health and wellbeing, medicinal and nutritional value [6]. However, bee products can also be a source of toxic substances [7-8]-antibiotics (such as chloramphenicol) [9], pesticides (neonicotinoids) [10] and heavy metals (e.g lead, cadmium and arsenic) [7] due to environmental pollution and misuse of beekeeping practices. Pesticide residues have been implicated in genetic mutations and cellular degradation while the presence of antibiotics may increase resistance in human or animal pathogens. In addition, Abeshu and Gelata [6] reported there have been cases of infant botulisms that have been attributed to contaminated honey. Honey that has not been analysed and sterilized should not be used in infants and should not be applied to wounds or used for medicinal purposes. The Maximum Residue Limit (MRL) set for neonicotinoids by the European Union Commission are 50ng/g for acetamiprid, imidacloprid and thiacloprid and 10ng/g for clothianidin and thiamethoxam [11]. Due to their high acute toxicity and concern, the European Food Safety Authority re-assessed the risks and placed a moratorium in 2013 on three [12-14] of the most harmful neonicotinoids (imidacloprid, clothianidin and thiamethoxam). The poisoning of bee pollinators is a result of serious adverse effect of insecticide use, which leads to a drastic decrease in the insect numbers, reduction of honey yields, destruction of plant life, presence of insecticide residues in food, and ultimately, to significant losses in the income of beekeepers. Thus, the main purposes for monitoring bee products are to assist in public health protection, global commercial competition and to realise better quality products. In addition, this provides a greater understanding of some of the issues in the supply chain with regard to pesticide loads as bee pollinators have been recognised as bioindicators of environmental pollution [15].

Saudi Arabia imported US$73 million worth of honey and the worldwide importation of honey totalled US$2.01 billion in 2019 [16]. In international trade, the quality of honey will vary depending on a number of factors. These may include the authenticity (nature, organic, region etc) type of honey (blossom honey, honeydew honey, comb honey, filtered honey, bakers honey etc), moisture content, electrical conductivity, diastase activity, 5-hydroxymethylfurfural (HMF) content, antibiotics, colour and sugar content (glucose and fructose together and sucrose). According to Codex Alimentarius Standard [17] these quality standards are not compulsory for governments and can be voluntarily agreed upon, while according to the EU draft they have to be fulfilled by all commercial retail honeys. Many organisations use the Codex Standard for Honey but importing countries may use this standard with their own stipulation that vary in specifications. This work examined the quality of imported honey arriving at the Port of Jizan in Saudi Arabia. The objective of this study was to analyse the imported honey from different regions around the world in order to highlight the variances in the quality of honey by country. In addition, the results of this study will provide guidance to importers as well as competent authorities about breaches and practices in the countries of origin. Recommendations for Good Agricultural Practice (GAP) that incorporate HACCP and rigorous auditing are made.

Materials and Methods

Sample Collection

Our approach utilises the sampling method by Grainger (2000) [18]. Product arriving at the Port of Jizan during 2018 was placed on hold until the final results were obtained. Each consignment was randomly sampled at 2.5% of the volume of shipment. Drums were thoroughly mixed using a paint mixer for five minutes. After allowing two minutes for settling of contents, three samples were removed, one from the top, one from the centre and one from the bottom. Each sample was analysed in triplicate. Any product in bottles within cartons was also sampled at the above rate.

Analytical Procedures

Determination of Pesticides

Pesticide analysis was conducted using the procedure by Camino-Sanchez et al (19) as reported in Khatri et al. (20). The pesticides acetamiprid, imidacloprid, carbendazim, methomyl, metalaxyl, pyridaben, indoxacarb, azoxystrobin, difenoconazole, tebuconazole, boscolid, linuron, ethion, metalaxl-m, chlorpyrifos, thiamethoxam, mycobutanil, hexythiazox, chinomethionat and biphenyl were determined by means of liquid chromatography coupled with tandem mass spectrometry (LC-MS/MS) using standards obtained from Dr. Ehrenstofer GmbH (Germany).

Extraction Procedure

Accurate sample weights of 10±0.1g were measures and then samples were transferred into a 50ml PTFE tube (extraction kits). To this 10ml acetonitrile was added and shaken vigorously for 1 min. Buffer salt was added. The mixture was then shaken vigorously for 1 min and centrifuged at 10 000 RPM for 10 min. The upper clear solution was transferred into dispersive solid phase extraction tubes (15ml Polyethylene tube) containing 150mg primary secondary amine (PSA) and 900mg anhydrous magnesium sulphate. The tube was capped and the extract was mixed with sorbent and vigorously mixed for 1 min followed by centrifugation at 4000 RPM for 5 min. Two millilitres of the clear extract was transferred into stoppered vials.

Analytical Procedure

The preferred technique for determination of multiresidue methods reported for fruits and vegetables are based mostly on the use of liquid chromatography coupled with tandem mass spectrometry (LC-MS/MS). LC‐MS/MS was performed with an Agilent 1200 series HPLC instrument coupled to an API 3200 Qtrap MS/MS from Applied Biosystems with electrospray ionization interface (ESI) (AB SCIEX, Dublin, CA, USA) and operated under unit mass resolution. The pesticide analysis procedure was conducted as reported in [15] by Sanchez et al (2010). The samples were extracted following the quick, easy, cheap, effective, rugged and safe method known as QuEChERS.

A 20μl sample extract was injected for chromatography into a C18 column ZORBAX Eclipse XDB‐C18 4.6x150mm, 5μm particle size (Agilent, Santa Clara, CA, USA), in which Mobile Phase A contained 5mM ammonium format and Mobile Phase B was methanol. An ESI source was used in the positive mode, with nitrogen as the nebulizer curtain gas. Other gas settings were optimized according to recommendations made by the manufacturer; source temperature was 300 °C, gradient elution programme was 0.3ml/min flow, ion spray potential: 5500 V, de‐cluster potential and collision energy were optimized using a syringe pump by introducing individual pesticide solutions into the MS instrument to allow optimization of the MS/MS conditions.

Identification and Quantification

The selected reaction monitoring (SRM) mode was used in which one transition ion product was used for quantification and the other for confirmation. The identification of a pesticide residue was considered to be confirmed when the retention time of the pesticide matched with that of the pesticide in the pure standard in and the appearance of two product ion transitions that matched the relative intensity criterion under SRM conditions. Once the presence of a pesticide residue was confirmed in an extract, the concentration of the residue was obtained from the appropriate calibration function which corresponds to the matrix‐matched calibration standards. Calibration standard curves were produced by plotting the peak areas for each pesticide versus its concentration with the matrixmatched standard solution and used for the quantification of each pesticide in the sample extract. All sample analyses were conducted in triplicate. The standard curves were linear in the range 0.005- 0.200μg/g with correlation coefficients greater than 0.998. The concentration of the pesticide in the sample extract, Cs (μg/g), was calculated using the following formula:

Cs = Ci x Vtot/Ve x Vf/W Where:
Cs = sample concentration (μg/g)
Ci = injection concentration (μg/ml)
Vtot = total volume of extraction (ml)
Ve = volume for evaporation (ml)
Vf = final volume (ml)
W = sample weight (g)

Antibiotic Determination

Chloramphenicol testing was achieved using the method provided by Ortelli et al. [10]. LC-MS/MS was utilised to test samples against a chloramphenicol standard from Thermo Fisher Scientific (UK). The AB SCIEX Triple Quad 3500 system enables relatively rapid laboratory performing antibiotic testing and was operated with Turbo V source and Electrospray Ionization (ESI) probe set to 500°C. QuEChERS extracts were diluted 10 times with water to minimize possible matrix effects. Honey samples were diluted with 5 times water and injected directly. LC separation was achieved using a Phenomenex Kinetex Biphenyl 2.6u (50 x 2.1mm) column and a fast gradient of water and acetonitrile with 0.1% formic acid at a flow rate of 0.5 mL/min. An injection volume of 10μl was used.

Determination of 5-Hydroxymethylfurfural

HMF content was measured using method by Winkler [23] as reported in Zapalla et al. [24]. Ten grams of honey were dissolved in 20ml water and transferred to a 50ml volumetric flask. Exactly 2ml of the diluted honey solution and 5.0ml of p-toluidine solution were placed in two separate test tubes; to the first tube 1ml of distilled water was added (this acted as a reference solution); to the second tube, 1ml of 0.5% barbituric acid solution was added (this was the sample solution). The absorbance of the sample was measured against the blank at 550nm was determined using a Varian UVVIS Cary 400 spectrophotometer. For the calibration, a standard solution of 0.300μg of HMF was spectrophotometrically assayed. The quantitative value of HMF was calculated using the proposed formula for the method [25].

Statistical Analyses

Data analysis was performed using SPSS software, version 19.0 (IBM Corporation, Armonk, NY). Descriptive statistics for frequencies and ranges were used to summarise the variables of interest.

Results and discussion

Table 1: Pesticides Detected in Imported Honey.

upinepublishers-openaccess-Food-Nutrition

A total of 712 batches of product from 18 countries (Benin, New Zealand, Poland, Bulgaria, Pakistan, USA, Morocco, Hungary, Portugal, Kazakhstan, Kyrgyzstan, Tajikistan, Slovenia, Turkey, Italy, France, UK and Germany) were analysed. Products were rejected based on any one of the following - exceeding the pesticide MRLs or presence of banned pesticides, detection of the antibiotic chloramphenicol or HMF greater than 80mg/kg. Figure 1 shows that 19.9% of product was rejected (n=142) with 80.1% being accepted (n = 570). The countries breaching the limits are shown in Figure 2. These countries were: Benin 8 batches, Pakistan 6 batches, Kazakhstan 12 batches, Kyrgyzstan 52 batches, Tajikistan 6 batches (all being rejected), Slovenia 12 batches, Turkey 9 batches, Italy 27 batches and France 8 batches. The number of accepted batches were 13, 161, 3, 8, 10, 2, 8, 2, 1, 32, 69, 78, 25, 126, 24, 8, and 3 for Benin, New Zealand, Poland, Bulgaria, Pakistan, USA, Morocco, Hungary, Portugal, Kazakhstan, Kyrgyzstan, Slovenia, Turkey, Italy, France, UK and Germany respectively. The number of samples from various batches containing different pesticides is shown in Table 1. There were 192 breaches of MRLs in the 712 batches. One or more of these pesticide residues was present in some of the imported batches. Thus, neonicotinoids coexisted with other pesticides which could increase harmful effects to pollinators and humans. Ethion, acetamiprid, carbendazim and imazalil are banned in Saudi Arabia and their presence is a concern for importers as well as exporting bodies. Table 2 the reasons applied for rejection are provided by country of origin. Benin, Kazakhstan, Kyrgyzstan and Tajikistan had consignments rejected due to the presence of chloramphenicol, exceeding the MRLs authorised for human consumption and levels of HMF greater than 80mg/kg. Batches from Morocco, Slovenia, Turkey and Italy contravened the MRLs as well as the HMF requirements while honey from Pakistan and France breached the MRLs only.

Figure 1: Percentage of Imported Honey Rejected/Accepted.

upinepublishers-openaccess-Food-Nutrition

Figure 2: Compliance Rate for Imported Honey.

upinepublishers-openaccess-Food-Nutrition

Table 2: Reasons for Rejecting Imported Honey from Various Countries.

upinepublishers-openaccess-Food-Nutrition

In the study by Mitchell et al. [11], they found neonicotinoids in 75% of the samples, although, concentrations in all cases were below the admissible levels. Many pesticides were present in tandem with others. Despite this fact, evidence from two fairly recent studies [26-27] on the impact of neonicotinoids on human health could warrant re-evaluation of the MRLs towards more stringent levels and control measures, especially, when up-regulation of nicotinic a4b2 Achars receptors in mammalian brains during long-lasting exposure and higher affinity metabolites have been found using imidacloprid. Sub-lethal effects of neonic pesticides on bees have been documented as suppression of the immune system, cognitive ailments, impaired reproductive function, queen survival and poor honing capacity [11]. The level of HMF in honey is an indicator of freshness and quality. It is formed from reducing sugars on heating in the Maillard reaction under acidic conditions. Typically, HMF is absent in honey (or is present in only very small amounts in fresh honeys), while its concentration tends to rise during processing and/or because of storage. HMF has been shown [22, 28] to have negative effects on human health, such as cytotoxicity toward mucous membranes, the skin and the upper respiratory tract, mutagenicity, chromosomal aberrations and carcinogenicity toward humans and animals. The maximum levels of HMF used in international trade is 40mg/kg. However, a level of 80mg/kg is used for tropical honeys and bakers honey.

Chloramphenicol is normally used to control bee brood disease [8]. Both Codex and EU Standards prohibit the use of antibiotics in honey. It is permitted in some countries such as India and Iran [29], Turkey [30] and has also been detected in samples from China that were imported into Canada [31]. Concerns relating to antibiotics include allergic reactions in hypersensitive individuals and disorder of the haemopoietic system, or problems indirectly through induction of resistant strains of bacteria. It is quite clear that the quality of honey provides invaluable information about certain aspects in the supply chain. Measuring pesticide MRLs and antibiotic residues (in this case chloramphenicol) have revealed issues about misuse of neonicotinoids and prohibited pesticides and excessive use beyond internationally recognised standards, several pesticides used in combination as well as some of the countries flaunting the regulations and utilising banned substances. Measuring the HMF level reveals information on further processing which includes heating and also of its age. Bee and other pollinators, the environment and human health are at risk and therefore agricultural authorities are urged to provide appropriate and rigorous training for the use of pesticides, provide a clear understanding between importing and exporting bodies as well as importing country legislation. Furthermore, auditing of facilities with rigid specifications should include HACCP requirements on farm in line with GAP.

Conclusion

Imported honey into Saudi Arabia from eighteen countries was analysed for pesticides, chloramphenicol and HMF. Approximately 20% of imported honey was rejected. Moreover, imported honey from 10 countries breached the MRLs and in some cases, with pesticides that have been banned as well as the presence of chloramphenicol from four countries. HMF was in excess of 80mg/ kg from 8 countries. Routine monitoring programmes for pesticides in honey can assist in the prevention, control and reduction of pollution of the environment and minimise risks to health. However, more rigid approaches to the management of pesticide along the supply chain are necessary. These include training for all individuals concerned with specified objectives, audit schemes on bee farms, assisting bee farmers to reduce the risks of contamination, understanding of legal requirements and specifications in domestic and international trade as well as cooperation between competent authorities and exporting countries. The reduction of pesticide use, in particular neonicotinoids is essential as bee and other pollinators are at high risk. With dwindling bee populations across the globe, the long-term production of honey that is sustainable and safe for human consumption will require agriculture authorities, policy makers and epidemiologists to intervene rapidly as the supply of honey may be threatened.

Read More About Lupine Publishers Journal of Food and Nutrition Please Click on Below Link:
https://lupine-publishers-food-and-nutrition.blogspot.com/