Over the past decade the amount of transactions and reported frauds
on Automated Teller Machines (ATM) has significantly
increased. Various types of frauds have been reported around misusing
ATM cards and many methods have been deployed to detect
and prevent them. In some countries, banks sell ATMs to investors under
predefined circumstances and pay them in commission
in order to increase the availability of the service but some ATM owners
have been found to create fake transactions to obtain
extra commissions. This paper attempts to detect such frauds using a
two-stage method. In the first stage fraudulent customers
are detected by certain rules and in the second stage their accomplices
are identified using transaction loop and cycle detection
algorithm. Transactions of an Iranian bank have been used to evaluate
the proposed method and all detected fraudsters by system
were confirmed by bank fraud detection office.
Keywords: Fraud Detection; Cycle Detection; ATM Fraud Detection; Data warehouse
Introduction
Using credit and ATM cards for different purposes, such as
buying services and products, has become one of prevalent methods
in digital economy [1]. These cards help people buy anything
without carrying cash and facing its risks. ATM cards also help
buyers pay their product and service fees with minimum details of
invoice. Effectively many customers use these cards instead of cash.
Using ATMs for paying bills, transferring money, buying cell phone
charges, viewing transactions list, and many other services causes
customers to prefer doing their affairs without the need to be at bank,
and banks benefit from these services through customer retention
and higher cash flow. They can also use their human resources for
other tasks and gain more productivity or alternatively reduce their
staff to decrease their expenses. To increase customer satisfaction
and liquidity, banks try to promote their services in cities. For this
purpose they provide ATMs to investors under special conditions:
if an investor can prepare required security and communication
infrastructure banks allow them to buy ATM. The business model
between bank and investors let banks to pay some percent of daily
ATM transactions as commission to ATM owners.
Although ATM cards provide many advantages and services
for customers and banks they are very susceptible to fraud. The
significant number of ATM transactions compared to other payment
methods has made them a worthy target for fraud [2]. This leads
card issuers and beneficiaries to try to detect and confront ATM
frauds. There are many methods proposed to detect frauds, which
are presented in Figure 1. Due to Anderson classification on frauds
there are eight classes of fraud [3]. In this classification ATM fraud
is a subcategory in “Technologies ATM &Internet” category which
can be further categorized into [4]
Figure 1: Types of Fraud.

Physical Attacks
Attacker tries to move or damage ATM device physically.
Gaining ATM User’s Banking Information
There are many methods for gaining ATM users information.
Attacker tries to attach illegal objects to ATM in order to capture
card data and password, card password is stolen using different
methods such as looking over the shoulders of ATM users and etc.
Financial Transactions Made by Inappropriate Methods
or Users
Inappropriate methods or users consist of many items like
using stolen cards by fraudsters and using forged notes in ATM
environments, etc.
Self-Payment Attack
Unlike other mentioned types of fraud, which are related to a
third party, frauds can also be conducted by ATM owners to obtain
more commission. This is known as self-payment attack. Due
to bank business model the more transaction amount ATM has,
more commission is paid to its owner. This is the main reason for
creating fake transactions by some ATM owners. In this paper a
novel method is proposed to detect self-payment frauds on ATMs.
In this method the fraudsters are identified using rules obtained
by experts. Then transactional networks of these customers are
built and by extracting loops in these networks, other users who
collaborated in the fraud are extracted. Using this method in an
Iranian bank many fraudsters were identified. The rest of the
paper is organized as follows. In the next section, definitions and
related studies are reviewed briefly. Then in section 3, the proposed
method is described with details. Result of this proposed method
on the practical data of Iranian bank transactions is presented and
discussed in section 4. Finally, the conclusion and some other hints
for future works are described in section 5.
Related Works and Definitions
In this section related studies about ATM fraud detection along
cycle detection algorithm, which is used in this paper, are explained.
ATM Fraud Detection
Extensive research has been carried out to prevent these crimes,
which can be divided into three categories [4]. Detection of physical
damage on ATM, prevention of ATM banking user’s information
and prevent financial transaction made by inappropriate users
and methods. For detecting physical attacks motion sensors are
used to detect the suspicion activities around ATMs [5]. Also, in
[6] mentioned three ways to overcome physical attack of ATMs:
the certification level of the ATM safe, using alarm and sensors to
detect physical attacks and at last using ink stain technology that
will mark and effectively make any removed money unusable.
There are methods to detect illegal objects, such as cameras and
card reproducers, attached to ATM [7]. Also, in [8] proposed a
system to detect criminal objects attached to ATM like cameras
that could read the users’ password. To prevent password theft in
[9] diversifies password entering methods to avoid another people
looking from behind of user. In [8] a system developed which warn
user when loiterers are behind the customer. To detect and prevent
financial transactions made by inappropriate methods or users
there are methods such as card holder identification via biometrics
[6,10,11], forged note detection in ATM environment [6,9] and
recording facial images of ATM users [5,12,13].
Eft Switch
Figure 2: EFT switch architecture.
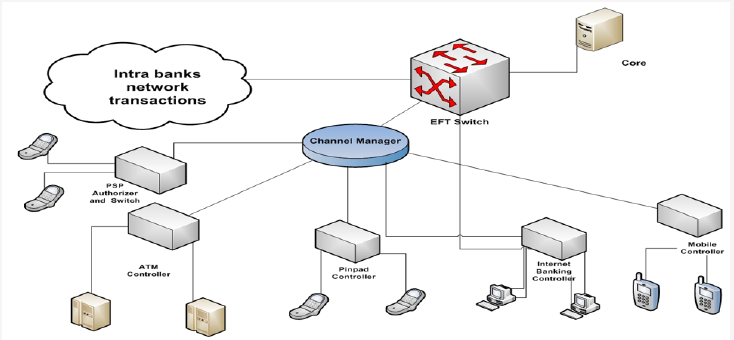
Electronic banking architecture in many banks is as following
Figure 2. The standard is used for financial transaction is ISO8583.
This standard has three versions and they are related to 1987,1993
and 2003. Messages in this standard have 128 fields containing
transaction information such as Amount, Date, Time, Device code,
Function code, Process code etc. So, all devices on bank network
have to be compatible with ISO8583 and they have to send and
receive message with this format. For more information see [14]. As
it is shown in Figure 3 each transaction is done by a device which is
sent to its controller. After verifying message’s security and content,
the transaction is sent to Channel manager. In addition to control
payment channels this switch controls content and security of sent
messages. After verifying messages by channel manager, they are
sent to central EFT switch of bank. At central EFT switch if card
is issued by other banks message is sent to Intra bank electronic
message network, otherwise it is sent to Core banking system. The
response is then provided to the customer.
Figure 3: Transfer loop.
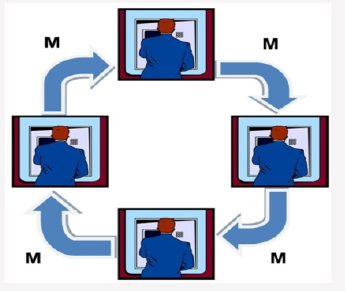
Self-Payment Fraud
As mentioned before, some banks sell their ATMs to investors
under predefined conditions. They pay some percent of transactions
done by ATMs to the owner as commission. Unfortunately, some
ATM owners make fake transactions for increasing their obtained
profits, which is called self-payment fraud. For instance, suppose
that there are four people with ATM card. First person transfer
amount M to second person and second person transfers this
amount to third person. Similarly, fourth person gets amount M
from third person and finally transfer it to the first one. This way,
four transactions with amount of M are done on the ATM for which
the ATM owner obtains commission. Figure 2 depicts the elaborated
process. This fake cycle could repeat many times and with shorter
paths. Consequently, these transactions cost a lot in commission for
the bank and also hinder them from their main goal and business
model. Therefore, in this paper we focused on detect this type of
frauds.
Proposed Method
In this part the proposed method for self-payment fraud
detection is introduced. ATM’s transaction information is first sent
to ATM controller and then they are sent to central bank switch.
Information is periodically extracted from switch database of bank
and ETL process is done on them. After this phase data warehouse
is created. Due to high volume of bank transactions, using data
warehouse increases fraud detection speed dramatically.
Phase I
In this part all EFT central switch data items need for future
processes are extracted.
All transactions with ATM Device code are selected
From previous step transactions, all transactions with local
transfer Function code are selected (As it was mentioned before
fake transactions are created by local transfer)
All successful transactions are selected (transactions with
response code=00)
In this step we have transactions in ISO8583 format, so ATM No,
Card No, Amount, Date and Time data items are selected.
Selected items in previous step are transferred to a table with
following format.
If money is transferred to card, “Deposit” field will be transferred
amount and “Withdrawal” field will be 0 and if money is transferred
from card, “Deposit” field will be 0 and “Withdrawal” field will be
transferred amount.
In this part data warehouse and cubes are created on Table 1.
ATM No, Card No, Date and Time are considered as dimensions.
Deposit and Withdrawal amount are considered as measures. Sum
function is selected for data warehouse function. Also, a KPI is
defined as Amount ratio (ϴ). The formula is defined as follow:
Table 1:

ϴ(Card No)=Deposit/Withdrawal
In this formula Deposit is the amount transferred to card and
Withdrawal is the amount transferred from card. Amount ratio ϴ
(Card No) shows Deposit / Withdrawal for a card. Table 2 shows
information about Dimensions and Measures. Data warehouse
general schema is shown in Figure 3. As demonstrated, Time
dimension includes Year, Month, Day and Hour. This dimension is
used for fraud detection in various time ranges and with different
granularities. In this paper following rules are used for fraud
detection. 1-Cards with ϴ=1, ϴ between 0.9 and 1.1 or ϴ between
0.8 and 1.2 have higher probability of creating fake transactions.
The smaller granularity on a dimension and KPI, the higher the
probability of fake transactions. For example, if a customer on
an ATM in a day has equal deposits and withdrawals with a high
probability he has committed self-payment fraud (Table 3).
Table 2:

Table 3:

2-Because it is possible the fraud takes place on two or more
ATMs, ATM dimension is omitted and then investigation about
Amount ratio is repeated again. Each of transactions meeting KPI
thresholds is considered as a probable fake transaction. In this type
of fraud, customers of multiple ATMs collaborate to create fake
transactions on their ATMs. Above rules are extracted from experts’
knowledge. The customers who fall into the above category are
considered to have most likely committed the fraud. These rules
can detect suspicious customers. Customers extracted by this
method with high probability really have committed fraud actions.
Phase II
After extracting data items from central switch database, a
restricted network is built with customer transactions. In previous
section some customers who create fake transactions with high
probability are discovered. But the point about this kind of fraud
is that customers for doing this fraud need other customers. So,
for finding other customers that are collaborating to create fake
transactions more analysis is needed. As mentioned before, for
increasing ATM amount operation, some customers transfer some
amount of money to each other several times. With more analysis a
loop is created between these customers. Result table format is as
follow. Following algorithm is used for related card extraction.
First all cards that have relation with suspicious cards are
extracted. These cards are those that transfer/receive money to/
from suspicious cards. So, all transactions which are related to
these cards are extracted (Figure 4).
ϴ for extracted cards is calculated (as mentioned in Phase 1).
Transactions which have ϴ out of threshold range are omitted
from transactions set.
Set Visited field for all transactions to 0.
Following Algorithm is used for Loop Detection
For more clarification an example is provided in Figures 5-9.
Assume that there is a network of transactions. Figure 6 shows
this network. Amount of transaction is on each edge. First phase of
proposed method are executed on each node (card) and all nodes
which have equal input and output are extracted(ϴ=1). These nodes
are suspicious nodes. Figure 7 shows this phase. In this Figure 4
card holders are detected as suspicious. But as you see in Figure
7 not all of them are fraudsters. After detecting suspicious nodes,
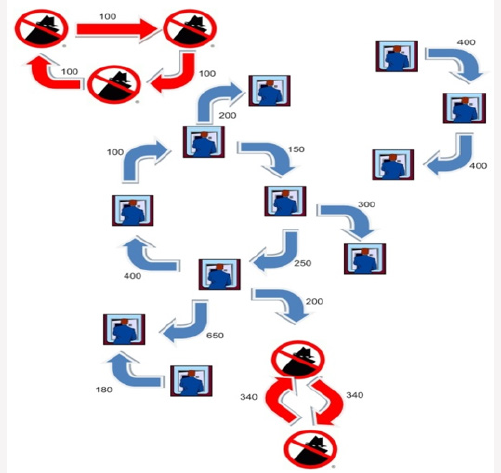
Phase 2 algorithm is executed on suspicious nodes. Detected loops
are shown in Figure 8. As demonstrated some suspicous nodes
from previous phase have been detected as normal behaviour. Two
suspicious loops are detected in Figure 9. In addition to creating
loop, all card holders which are in loop must have predefined
range of amount ratio. In Figure 9 Amount ratio is equal to one.
The detected customers can be introduced to bank fraud detection
office for further investigations.
Figure 4: Data warehouse design.
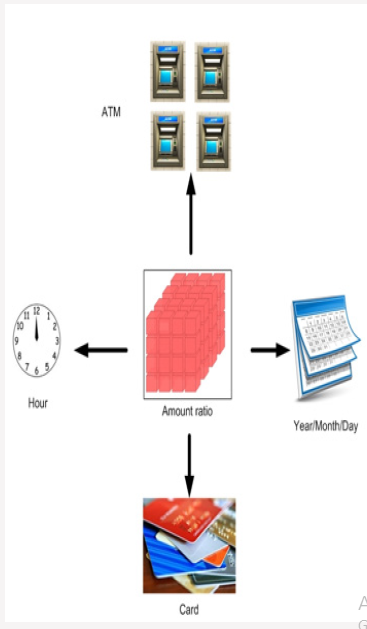
Figure 5: Extract related cards flow chart. .
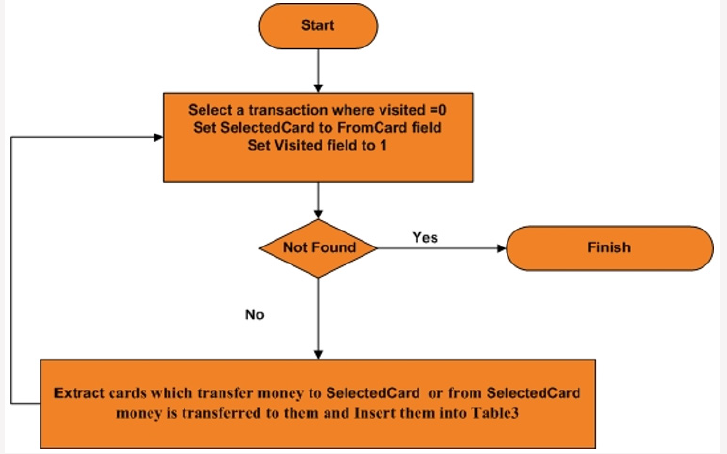
Figure 6: Extract related cards flow chart. .
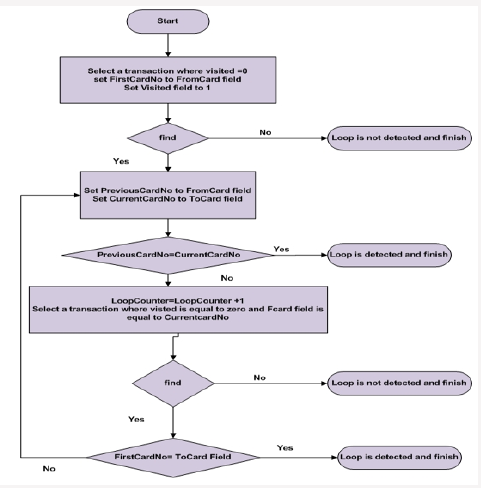
Figure 7: Transactions network.
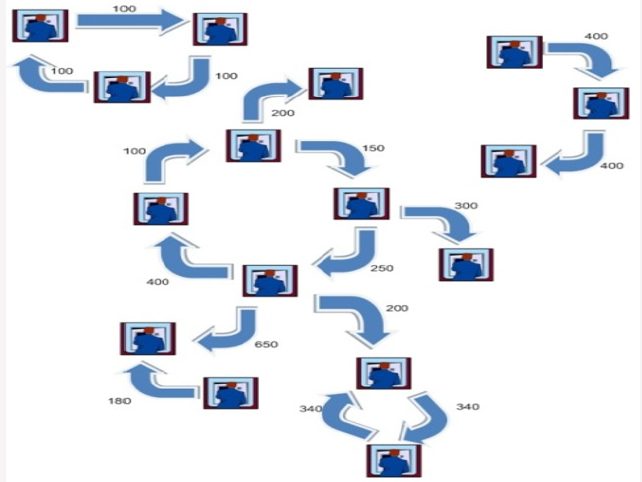
Figure 8: Detecting suspicious nodes.
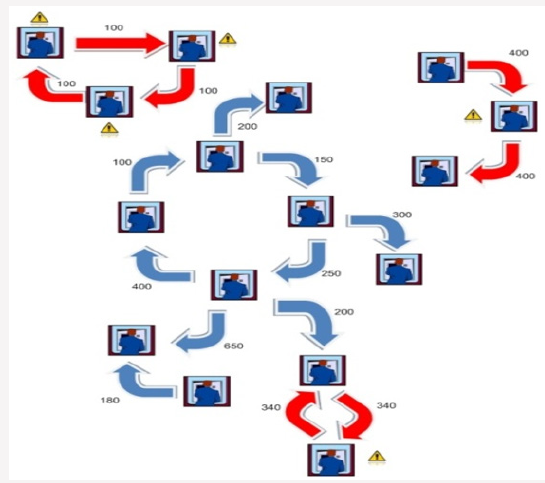
Figure 9: Loop detection.
Results
To evaluate the proposed method, it is applied on transactions of
an Iranian bank. For this purpose92702 local transfer transactions
were investigated. Table 4 shows results of first phase of proposed
method due to various dimensions (Card No, ATM, and Time). As it
is illustrated in Table 4 using different periods for time dimension
could affect the number of suspicious transactions. In Table 4
different ranges for ϴ is used. Due to these ranges and changing
dimensions different card numbers and transactions are extracted.
When ϴ range and Time dimension are bigger, more transactions
and cards are extracted. But if ϴ range and Time dimensions are
smaller fraud probability is higher. Because proposed method used
database and data warehouse techniques, it has high performance
for large amount of data like be Table 5 shows Phase II of proposed
method results. As it can be seen in this table suspicious cards and
related card are detected as it was described before. Then amount
ratio filter applied on them. Finally loop detection phase is applied
on cards. Table 5 shows detected cards, detected transactions,
detected loops, average loop lengths and transactions which are
bigger than 1000000 Rials. Detected cards certainly committed
self-payment fraud. These cards, related ATMs, Date and Time
were delivered to bank fraud detection office. They investigated
transactions and loops and put some filters on these transactions.
For example, if amount of a transaction in loop were smaller than
10000 Rials, these transactions were probably for system function
test and were not fraud. Also, they decided if loop count for a specific
card is bigger than one then this card committed self-payment
fraud. With these two rules final results are as Table 6. Based on the
amount of fake transactions some ATM owners had to pay penalty
to the bank and for others the ATMs were seized.
Table 4:
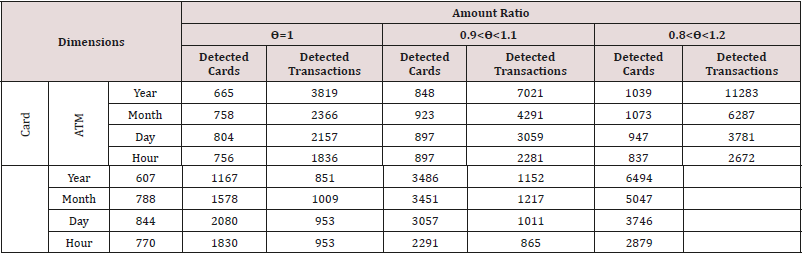
Table 5:
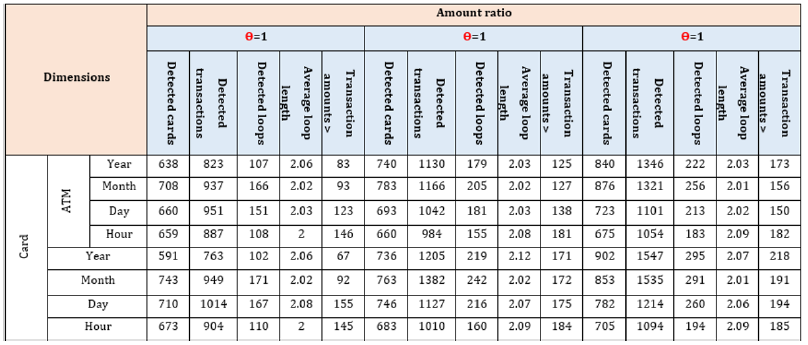
Table 6:

Conclusion
In this paper we discussed self-payment fraud. Due to the nature
of this fraud, all transactions should be investigated and fraud loops
should be extracted. Two approaches were discussed in this paper.
To the best of our knowledge there was no method for ATM owners’
fraud detection. Also, in this paper a method for loop detection
is introduced that can be used for loop detection in many other
systems. Proposed method extracts suspicious transactions in the
first phase. Then related transactions are extracted in the second
phase and all transactions are investigated again. Finally, it presents
a list of fraudsters’ loops. Self-payment frauds are guaranteed in
these loops. There is a problem with proposed method when all
members of fraudsters loop have other transactions in addition to
their fake transactions and amount sum of fake transactions by total
transaction is lower than ϴ thresholds. For future work, proposed
method can be used for link analysis in anti-money laundering.
Also, it can be used for fraud detection on other payment channels
like point of sale (POS) and fraud committed by their owners.
Generally, proposed method loop detection can be used for all big
data environments which need loop detection with some changes
in details.

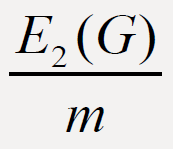 and
and 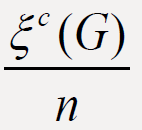 of connected graphs G of order
n and with m edges.
of connected graphs G of order
n and with m edges. . Also, the diameter
of G, denoted by d(G), is the maximum distance between vertices
of a graph G and hence
. Also, the diameter
of G, denoted by d(G), is the maximum distance between vertices
of a graph G and hence  . A vertex
v with ∈G(v)= r(G) is called a central vertex in G. A graph G with
d(G) = r(G) is called a self-centered graph. A graph which contains
only two non-central vertices is called almost self-centered graph
[2] (ASC graph for short). Moreover, the eccentricity is also applied
in chemical graph theory. There are several eccentricity-based
topological indices, including the second Zagreb eccentricity index
E2(G) [3] and eccentric connectivity index ∈c (G) [4], of graphs G
where
. A vertex
v with ∈G(v)= r(G) is called a central vertex in G. A graph G with
d(G) = r(G) is called a self-centered graph. A graph which contains
only two non-central vertices is called almost self-centered graph
[2] (ASC graph for short). Moreover, the eccentricity is also applied
in chemical graph theory. There are several eccentricity-based
topological indices, including the second Zagreb eccentricity index
E2(G) [3] and eccentric connectivity index ∈c (G) [4], of graphs G
where 
 or any graph G.
In this paper we prove some comparison results between
or any graph G.
In this paper we prove some comparison results between 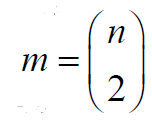 and
and 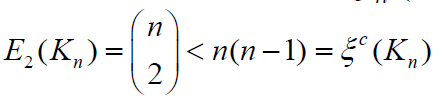 . Then our result follows. Next
it suffices to consider the case when d = 2. If G has maximum
degree Δ = n −1by Lemma 2.1, we have E2(G) <ξc(G) for any graph
G∈ζ(𝓂,𝒹) .Moreover, we have 𝓂≥𝓃−1 If 𝓂=n-1, then G≅Sn with
. Then our result follows. Next
it suffices to consider the case when d = 2. If G has maximum
degree Δ = n −1by Lemma 2.1, we have E2(G) <ξc(G) for any graph
G∈ζ(𝓂,𝒹) .Moreover, we have 𝓂≥𝓃−1 If 𝓂=n-1, then G≅Sn with for any n ≥ 5. Moreover,
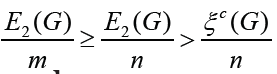 . finishing the
proof of the theorem. Next we consider the case
. finishing the
proof of the theorem. Next we consider the case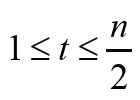 . If
r(G) ≥ 3, then
. If
r(G) ≥ 3, then 




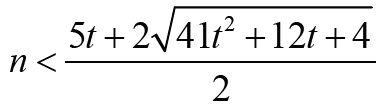 .
.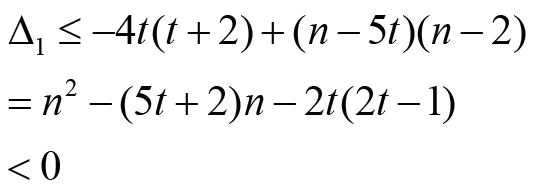
 Note that
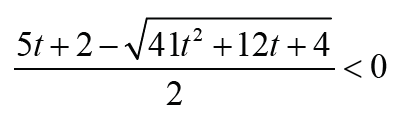 Thus Δ1 < 0 is equivalent that
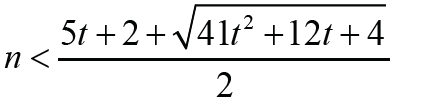 with t ≥1. Therefore the result holds immediately. It is much
interesting to search more generalized graphs G with different
comparison results between
with t ≥1. Therefore the result holds immediately. It is much
interesting to search more generalized graphs G with different
comparison results between 

