Showing posts with label Agriculture journal. Show all posts

Tuesday, 2 February 2021

Lupine Publishers | Economic Analysis of Poverty Status of Small-Scale Farmers in Bayelsa State, Nigeria

    Lupine Publishers | Current Investigations in Agriculture and Current Research


Abstract

The study analyzed the household poverty status of small scale farmers in Bayelsa State, Nigeria using a multi-stage random sampling technique to sample six hundred farmers. Data were collected using structured questionnaire and were analyzed using descriptive statistics, FGT [1] index and the logistic regression model. The result revealed that the majority of the farmers 80% were females, while 79% of the respondent was married with 46% of them having no formal education. Twenty-seven (27) percent of the crop farmers are poor while thirtyeight (38) of the livestock farmers were poor. Also, the poverty depth and severity of crop farmers were 0.072 and 0.038 respectively whereas they were 0.098 and 0.052 respectively for the livestock farmers. The logistic regression model revealed that age, educational level, household size, farming experience, farm/herd size, household income, household expenditure and membership of cooperative contributed significantly in determining the poverty status of the farmers. This study therefore recommends measures needed to be put in place to encourage and improve the welfare of the farming household towards productive and sustainable agricultural development for poverty reduction.

Keywords: Economic; Poverty; Status; Small Scale; Farmers

Introduction

Nigeria is a vast country endowed with substantial natural resources which include; 68 million hectares of arable land, fresh water resources covering about 12 million hectares, 960 million hectares of coastline and ecological diversity that favor the production of a wide variety of crops, livestock, forestry and fisheries product [2]. These coupled with its 37 million hectares of natural forest and rangeland and total land mass of 923,768km2 [3] makes agriculture one of the prominent sub-sector. In spite of these resources’ endowment, the productivity of agriculture continues to dwindle. One of the major problems confronting Nigeria today is how to improve the quality of life in the rural areas and reduce the level of poverty [4]. Poverty in Nigeria is not only a state of existence but also a process with many dimensions and complexities [5]. The report of the 2006 Nigerian Core Welfare Indicator (CWI) on the poverty profile in the country stated that the dependency ratio, which was defined as the total number of household members aged 0 – 14 years and 65 years and above to the number of household members aged 15 – 64 years was 0.8 Central Bank of Nigeria [6]. This indicated that almost a one-to-one dependency ratio and reflected the high population growth rate in the country. There is also large income inequality with the top 10% of the income bracket accounting for close to 60% of the total consumption of goods and services [7].

The World Bank [8] describes poverty to comprise of many dimensions. It includes low incomes and the inability to acquire the basic goods and services necessary for survival with dignity. It encompasses low levels of health and education, poor access to clean water and sanitation, inadequate physical security, lack of voice and insufficient capacity and opportunity to better one’s life. It may also result in not having enough capacity to feed and clothe the family and/or earn a living. About 90% of the country’s food is produced by small scale farmers cultivating tiny plots of land who depend on rain fed agriculture [9]. According to Omonona [10], poverty is pervasive although the country is rich in human and material resources that should translate into better living standard. Despite its plentiful resources and oil wealth, poverty is widespread in Nigeria [11]. The situation is said to have worsened since the late 1960s, to the extent that the country is now considered one of the 20 poorest countries in the world. Over 70% of the population is classified as poor, with 35% living in absolute poverty. Poverty is especially severe in the rural areas, where social services and infrastructure are limited or non-existent. Majority of those who live in rural areas are poor and depend on the agriculture for food and income.

The concern on the threat posed by poverty has led the Nigerian government over the years to devote considerable attention to alleviating its scourge through various policy projects and programmes which seems not to have stem the ugly situation till date. In view of these, the question about the poverty status of rural dwellers especially the small scale farmers remained unanswered. It is on this premise that this study was carried out to answer these questions.

a) What are the socio-economic characteristics of these small scale farmers?

b) Are the small-scale farmers really poor?

c) What are the factors influencing poverty status of the small scale farmers? and

d) What options are available to small scale farmers in reducing their poverty levels?

Thus, the main objective of this study is to evaluate the poverty status of small scale farmers in Bayelsa State, Nigeria. The specific objectives are to:

a) Describe the socio-economic characteristics of small scale farmers.

b) Compare the poverty status of crop and livestock farmers in the study area;

c) Determine the factors influencing poverty status of the farmers; and

d) Make policy suggestion towards poverty alleviation.

Methodology

Study Area

The study was conducted in Bayelsa State, Nigeria. It is located between latitude 5° 001 to 10° 301 N and longitude 4° 551 to 6° 001 E and covers an estimated land area of 1,810km2 with a population of about 856,729 thousand [12]. It shares local boundary with Delta State, Anambra State and Rivers State with the Bight of Benin at the Southern Flank. There are eight (8) Local Government Areas (LGAs) in the state with Ijaw as their major language. Mean annual rainfall of the area is 2,200mm for upland or dry regions where water bodies are few and 3,500mm for wetland or lowland region which comprises of land areas being surrounded by water bodies. Temperature range is between 23 – 31°C and vegetations found in the area include the saline water swamp, mangrove swamp and the rain forest. Major seasons are the dry (November – February) and wet seasons (October – March). Also, the seasonal condition of the area presents a healthy environment for farming which is the main source of income and livelihood of the state’s population and agriculture accounts for about 72% of the labor force.

Sampling Procedure and Sample Size

The sampling involved a multistage random sampling technique. Firstly, six (6) local government areas were randomly selected using the proportionate sampling method at 75% precision level from the purposively selected three (3) agricultural zones according to Agricultural Development Programme (ADP) structure. In the second stage, ten (10) villages were also randomly selected from the six (6) LGAs each making a total of sixty (60) villages. The third stage involved a simple random selection of five (5) crop and five (5) livestock farmers each from the villages using the list provided by ADP from each of the villages. A total of six hundred (600) respondent farmers were used.

Data Collection

Both primary and secondary data were used for the study. The collection of primary data was achieved using a set of structure questionnaire that was administered by the researcher and trained enumerators complemented with oral interview, information that was collected covered the areas of socio–economic characteristics, farming operations, and income and expenditure patterns. Secondary data were sourced from relevant material both published and unpublished.

Analytical Technique

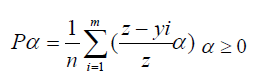
Three analytical tools namely; descriptive statistics; Foster, Greer and Thorbecke (FGT) model of poverty decomposition [1]; Logistic regression were used for the study. Descriptive statistics such as frequency, percentages, mean were used to profile the socio-economic characteristics of the farming households and also to present the results of the findings. The FGT measure was used to assess the incidence, depth and severity of poverty of the farming households. The approach makes use of the aggregate values of the poverty indices – poverty headcount, poverty gap, and squared poverty gap. The use of the FGT measures required the definition of poverty line and this was calculated on the basis of aggregated data on household income. The FGT measure as used by Baiyegunhi and Fraser [13] is expressed as:
Lupinepublishers-openaccess-Agriculture

Where:

z = Poverty line

m = Number of households below poverty line

n = number of households in the reference population

yi = Per adult equivalent income of ith household

α = Poverty aversion parameter

z-yi = Poverty gap of the ith household

z – yi = Poverty gap ratio

The headcount index was obtained by setting a = 0, the yield poverty gap index when a = 1, and squared poverty gap index when a = 2. The poverty line is a predetermined and well defined standard of income and value of consumption. In this study, the poverty line was based on the income of the households. A relative poverty line was used in which a household was defined as poor relative to others since they are all farmers. Two third of the mean per capita income (MPCI) was used as a moderate poverty line while one third was taken as the line for extreme poverty. Thus, the farming households were grouped into three categories based on their levels of poverty: the extremely poor (those whose income was less than one-third of MPCI), the moderately poor (those whose income lies between onethird and two-third of the poverty line) and the non-poor (those whose income was above two-third of the poverty line).

Adult equivalents were generated following Nathan and Lawrence [14], thus:

AE =1+ 0.7(N1 −1) + 0.5N2

Where

AE = Adult equipment

N1 = Number of adults aged 15 years and above

N2 = Number of children aged less than 15 years.

Logit Regression Model

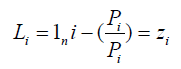
A binary logistic regression model was used to analyze the determinants of poverty. Thus, poverty is the dependent variable and is determined by independent variables such as socioeconomic characteristics of households and access to services. The dependent variable is binary (1 if the household is poor and 0 if the household is non-poor). The logit model is based on the cumulative logistic distribution function expressed as:
Lupinepublishers-openaccess-Agriculture

Where:

Li = log of the odd ratio, which is not only linear in Xi but also linear in the parameters,

Pi = is the probability of being poor and ranges from 0 to 1.

Zi = the function of the explanatory variables (x) which is expressed explicitly as:

Lupinepublishers-openaccess-Agriculture

Where:

Bo = Intercept, Bi – B9 = coefficient of the independent variables, xi = is the vector of relevant independent variables and U = is the stochastic error term, z = the dependent variable defined as the mean annual per capita expenditure. It was measured in binary terms such that 0 = poor, that is if the mean per capita household expenditure is below the poverty line and l = not poor, that is if the mean per capita household expenditure is above the poverty line and:

X1 = Age (number)

X2 = Farm size (number of herds/hectares)

X3 = Marital Status (1 = Married, 0 = otherwise)

X4 = Household size (number)

X5 = Education Level (number of years)

X6 = Major Occupation (1 = farming, 0 = otherwise)

X7 = Farming Experience (years)

X8 = Household income (Naira)

X9 = Household Expenditure (Naira)

X10 = Extension contact (1 = yes, 0 = otherwise)

X11 = Cooperative Membership (1 = yes, 0 = otherwise)

Results and Discussion

Socio-Economic Characteristics of Respondents

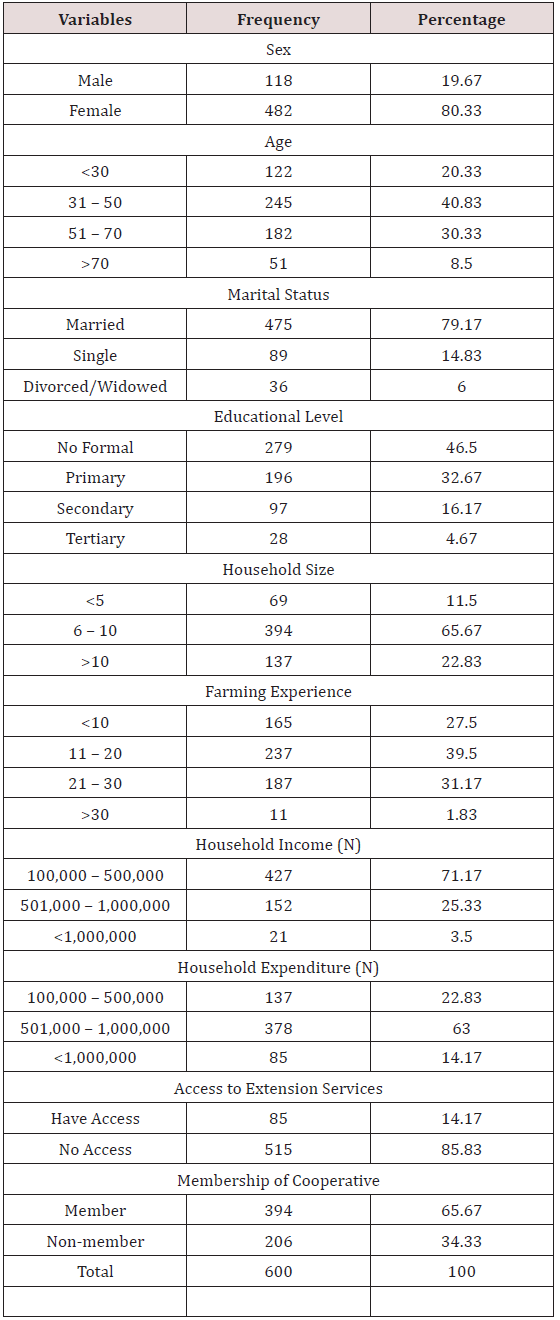
Table 1 shows the socio-economic characteristics of the respondents. The majority, 80.3% of the respondents were female while 19.7% were male. This suggest that majority of small scale farmers in the study area are female. About 61% of the respondent were age <30 to 50years with the mean age of 41 years. These results suggest that majority of the farmers were in their active productive age. Moreover, 79.17% of the respondent farmers were married, only 14.83% were single and 6.00% of the farmers were either divorced or widowed. About 46.50% of the farmer does not have formal education, while 32.67% had primary education. Only 16.17% and 4.67% of the respondents had secondary and tertiary education respectively. These result confirm the low level of education in the study area as the state was rated as an educationally disadvantage state in Nigeria. Majority of the respondent farmers 65.67% had a household size ranging between 6 – 10 persons, while 11.50% had less than 5 persons and 22.83% of the respondent had above 10 persons. The result suggests a large household size among the respondent farmers (Table 1).

Table 1: Socio-Economic Profile of Respondents.
Lupinepublishers-openaccess-Agriculture

On the basis of farming experience, about 27.50% of the respondents had less than 10 years farming experience, while 39.50% had farming experience ranging between 11 – 20 years. Only 31.17% had farming experience ranging between 21 – 30 years and 1.83% had farming experience of more than 30 years. Based on household income, about 71.17% of the respondents had annual income ranging between N100,000 – N500,000, while 25.33% had annual income ranging between N501,000 - N1,000,000, only 3.50% of the respondents had annual income above N1,000,000. Majority of the farmers 63.00% had household expenditure ranging between N501,000 – 1,000,000, while 22.83% had expenditure ranging between N100,000 – N500,000 and 14.17% of the farmers had household expenditure above N100,000. These result suggest that majority of the respondent farmers spend more than they earn thereby pushing them more into poverty. Majority of the farmers 85.83% have no access to extension services while only 14.17% of the farmers have access to extension services. Moreso, 65.67% of the respondent farmers are members of cooperative societies while 34.33% do not belong to cooperative society (Table 2).

Table 2: Poverty Incidence, Depth and Severity of Respondents.

Lupinepublishers-openaccess-Agriculture

Analysis of Poverty Status of the Farmers

Table 2 shows the summary of the poverty incidence (P0), depth (P1) and severity (P2) among the respondents. The MPCI of the crop farmers was 21,017.20. This gives a moderate poverty line (2/3 MPCI) of 14,011.47 and a core poverty line (1/2 MPCI) of 7005.73. The MPCI of the livestock farmers was 17,213.10. This gives a moderate poverty line (2/3 MPCI) of 11,475.40 and a core poverty line (1/2 MPCI) of 5737.70. Hence, crop farmers whose monthly per capita income falls between 14,011.47 and 7005.73 were regarded as moderately poor while those who fall below 7005.73 were regarded as core poor and those above 14,011.47 were regarded as non-poor. For the livestock farmers, households whose monthly per capita income fall between 11,475.40 and 5737.70 were regarded as moderately poor while those below 5737.70 were regarded as core poor and those who are above 11,475.40 were regarded as non-poor. The poverty incidence (Table 2) shows that among the crop farmers, 27% of the populations were poor while among the livestock farmers, 38% of the populations were poor. The poverty depth of the crop farmers and livestock farmers was 0.072 and 0.098 respectively. This implies that they would need to be increased by 7.2% and 9.8% respectively for them to come out of poverty and become non-poor. The poverty severity measures the distance of each poor person to another. Among the crop farmers, the distance was 0.038 while in the livestock farmers the distance was 0.052. Overall, a comparison of the poverty status of the crop and livestock farmers indicated that the poverty status is relatively close even though it is higher among livestock farmers. The result may not be unconnected to excessive expenditure incurred by head of household as a result of increase household size and low-income occasion by subsistence nature of farming.

Factors Influencing Poverty Status of the Respondents

Table 3 shows the factors influencing poverty status of the farmers. The regression classification table revealed that the binary logistic model predicted 97% of the regression correctly. The model fits the data at (P<0.001) as indicated by the chi-square goodness of fit statistic (73.28). The goodness of fit of the model proved that the variables tested in this study were valid to explain the determinants of poverty in the study area. Besides, the Nagelkerte R2 value (0.867) shows that about 87% of the outcome (Likelihood of being poor) can be explained by the selected independent variables captured in the model (Table 3).

Table 2: Logistic Regression Result on Factors Influencing Poverty Status of the Respondents.

Lupinepublishers-openaccess-Agriculture

Percentage Prediction = 97.57%

Goodness of fit chi-square (df=11) = 73.28 (P<0.001) Nagelkerte R2 = 0.867

***, ** and * = figures significant at 1%, 5% and 10% levels respectively.

Source: Computation from field survey data, 2017.

The results of the regression model indicated that eight (8) of the eleven (11) explanatory variables influenced the poverty status of the farmers. The variables were age, educational level, and household size, farming experience, farm/herd size, household income, household expenditure and membership of cooperative. The coefficient of age of the farmer was significant and negatively related to the probability of a household becoming poor. This implies that the age of the farmers is a causative factor of poverty. As age of the farmers increase, the likelihood of being non poor is reduced. This conforms to a priori expectations and work by Ayalneh [15], Obiesesan [16], who opined that older households had greater likelihood of being non-poor. This may be attributed to increased experience and exposure to farming operations and management practices as their age increases.

A positive and significant relationship was found between educational qualification and the likelihood of being non-poor, hence, the higher the educational level, the lower the tendency of been poor. The result is in conformity to a priori expectations and work by Ogwunike [16] who found that a positive significant relationship existed between educational level and the probability of being non-poor. The coefficient of household size was negative and was significant at 1% level. This implies that, the higher the household size, the more likely to become poor. Ceteris paribus. This could be as a result of the fact that the members of such households would have to depend on the limited resources that is available to the household thereby reducing the per capita income of the household. This is in agreement to a priori expectations and work by Khan [5] and Ogwumike [16].

A positive and significant relationship was found between farming experience and the likelihood of being non poor at 5% level. This implies that the higher the years of farming, the higher the probability of being non-poor. This is in conformity to a priori expectations and work by Omonona [10] who stated that exposures and experiences gathered over the years help rural poor people to fight poverty. The author further opined that experience in farming help to reduce losses thereby encouraging proper handling and management of relatively scarce resources. There was a positive and significant relationship between farm/herd size and the likelihood of being non-poor. This implies that as the farm/herd size of the farmer increases, the probability of the household being nonpoor is increased. This finding conforms to a priori expectations and work by Eneyew [17] and Alemu [18] who found that a unit increase in land holding increased the probability of being nonpoor. The coefficient of household income was significant at 1% level and positively related. This implies that as the household income increase, the probability of being non-poor increases. This is in agreement to a priori expectations and work by Alemu [18] who found a positive relationship between household income and the likelihood of being non-poor.

In conformity to a priori expectations, the coefficient of household expenditure was negative and significant at 5% level. This indicated that, the higher the household expenditure, the lower the likelihood of being non-poor. Ogwumike [19] stated that, excessive expenditure by household head is a pointer to poverty. The coefficient of membership of cooperative was positive and significant at 5% level. This implies that, if a household head is a member of cooperative, the likelihood of being non-poor increases. This will not be unconnected with the fact that members of cooperative in the rural settings help their cooperative members in time of needs and also provide incentive and loan facilities to those in need.

Conclusion

The research has shown that, the incidence, depth and severity of poverty were high among the farming households even though some of the farmers fall above the poverty line. The study has also shown that the rate of poverty is relatively higher among livestock farmers compared to crop farmers. Meanwhile, the study has revealed that several factors influences the poverty status of the farming households such as age, educational level, household size, farming experience, farm/herd size, household income, household expenditure and membership of cooperative [20].

Given these findings, therefore, it is recommended that:

a) Government and other relevant non-governmental organizations should provide incentives and infrastructures that will enhance productive and sustainable agricultural development in the rural areas.

b) The farming households need to diversify their productive activities through mixed farming and value addition to improve their non-farm income thereby reducing poverty.

c) Policy makers and the operators of rural economy should carefully understand those variables that influence the poverty status of the farming households and address them critically and vigorously.


Read More Lupine Publishers Agriculture Journal Article:

Tuesday, 26 January 2021

Lupine Publishers| Impact of Some Fertilization Treatments on Crop and It’s Atrebuites on “Fuerte” Avocado Trees

  Lupine Publishers | Current Investigations in Agriculture and Current Research


Abstract

This study was carried out throughout two successive seasons 2015 and 2016 at Horticulture Research Station at El-Kanater El-Khayria, Qalyubeia Governorate on 20-year-old avocado trees (Persea americana Mill.) “Fuerte” cultivar grafted on Dayouk rootstock and irrigated with through farrow (surface) irrigation system. In this sequence (N1) as the control or untreated trees and other trees were treated with four treatments of different addition times of nitrogen soil fertilization (N2, N3, N4 and N5) all only once and once with boron and zinc as foliar spraying in concentrations (1, 2 and 3 g/L) beside combination between them. Nitrogen fertilization rated 1200g /tree in 3 times as (NH4No3) 33. 5%. Boron was used as sulaphate boron (17, 5%) and zinc was used as sulphate zinc (34%) each treatment was sprayed independently or in combination three times during (October, January, April). Pollen germination, fruit set as well as yield, fruit weight, flesh weight, oil content percentage and vitamin C were determined to assess the effect of the treatments. The obtained results showed that nitrogen soil application time and boron and zinc foliar spraying were significantly affected on improving all the tested parameters compared with control trees. The study also showed that, nitrogen soil application time N2 with boron and zinc combination at 1g/L/tree was more effective than the other treatments and gave significantly the highest values in comparison of other testes treatments in both seasons of study.

Keywords: Avocado; Fuerte; Nitrogen; Boron; Zinc, Foliar spraying; Application time; Fruit set; Fruit quality and oil content

Introduction

The avocado Persea Americana, Mill belongs to the family Lauraceae. It has developed into three horticultural races (West Indian, Guatemalan and Mexican [1], which are adaptable to a wide range of soil and climatic conditions. Avocado which has been referred to as the most nutritious of all fruits [2], has gained worldwide recognition and significant volume in international trade. Although relatively new in international commerce, this unique fruit has been appreciated and utilized for at least 9000 years in and near its center of origin in Meso-America [3]. Avocado is a relatively new crop in areas of the world outside its native range in the American tropics. In 2013, world production of avocados was 4.7 million tons, with Mexico alone accounting for 32% (1.47 million tons) of the total production. Other major producers include Dominican Republic, Colombia, Peru and Indonesia, together totaling 1.26 million tons or 28% of world production (FAOSTAT of the United Nations 2013). “Fuerte” is one of the most common avocado cultivars in the international market. “Fuerte” accounts for about 55% of the production in Mexico and California and is important in other countries [4] and [5]. In Egypt, the avocado was grown in limited areas in El-Delta, in 50s and 60s of the previous centuries. Only Fuertre and Dayouk were grown in these areas until recent were new areas as El-Nubaria, Ismailia and El-Khatatba started to be grown with avocado.

“Fuerte” the most spread cultivar is a Mexican _ Guatemalan hybrid, Trees are large, with spreading crowns; leaves have aniseed smell when crushed, red flecking on wood of new shoots; flower Group B, fruit pyriform with distinct neck but variable ranging from elongated with long narrow neck to dumpy with short broad neck, medium to large size weighing 170–500 g, skin thin, green, medium gloss, supple leathery texture, pimpled surface, seed size is Medium to large, conical with pointed apex, early maturing with pale yellow flesh, 75–77% recovery, excellent quality with flavoursome, nutty after-taste, good on-tree storage, but short shelf-life when ripe. The chemical composition of avocado depends on the cultivar and stage of ripening [6]. In Egypt, “Fuerte” is harvested all year round but its’ main season is from October to December. Main problems facing avocado plantations are slow to reach production, low yields in cooler climates with a marked tendency for erratic cropping and sensitivity to low temperatures during flowering and fruit set [7].

Nitrogen seems to be the most important element in avocado nutrition. Deficiencies of nitrogen in avocado result in small, pale leaves, early leaf drop, and smaller and fewer fruits [8]. In addition, nitrogen deficient trees were found to be more susceptible to frost damage [9]. Boron is essential for pollen germination, for successful growth of the pollen tube through the stigma, style and ovary to the ovule [10]. On worldwide basis zinc (Zn) is a very critical microelement because the avocado is very susceptible to their deficiency. Symptoms of Zn deficiency are observed in acid soils from which it is easily leached at a low pH and in calcareous soils in which it is fixed in unavailable forms. Early deficiency symptoms are mottled, narrow, disproportionately small leaves at the terminals, usually light green or chlorotic in color. Leaf margins are necrotic, and internodes are shortened in advanced cases [11].

Numerous fertilization regimes were proposed by several scientists to overcome cropping problems [12] studied the effect of nitrogen fertilizer application times and rates on “Hass” avocado to increase total yield without reducing fruit size and found that application time proved to be an important determinant of total yield lower annual N would reduce fertilizer expense and protect the environment. Boron sprays applied either during fall or spring on trees not deficient in boron (based on leaf analyses) have been effective in increasing fruit set in a number of deciduous tree fruit, nut crops and in avocado [13]. [14] on avocado trees proved that B and Zn were significantly improved pollen germination; fruit set number as well as yield per tree and increased fruit weight, length and breadth of fruits. They showed that the combination of B+Zn had positive synergistic effect and gave the highest values in the tested parameters. According to [15] Zn level at (0.5 %) improved fruit set wheras levels (0.25, 0.5 %) were more effective on fruit drop number and enhanced production of piryform fruits with more elongation. The scope of the present study was to illustrate the impact of nitrogen fertilization regimes with or without foliar sprays of both zinc and boron on the performance of Fuerte avocado trees.

Materials and Methods

This investigation was carried out through the two successive seasons of 2015 and 2016 on 20-year-old avocado trees (Persea Americana, Mill.) “Fuerte” cultivar grown in the experimental orchard of the Horticulture Research Station located in El-Qanater El-Khayreia, Qalubia Governorate, Egypt. Trees were planted at 7x7 meters (86 trees/ feddan (. One hundred and fifty Feurte cultivar trees grafted on Dayouk rootstock were chosen for this study. The chosen trees for the investigation were uniform in their vigor, size, shape and disease free, grown on loamy clay soil and irrigated with a farrow (surface) irrigation system. Trees were subjected to normal cultural practices recommended by the Ministry of Agriculture except for the treatments of this investigation. Experimental design followed the complete randomized block design. The following regimes were conducted each on three separate trees (each acting as a replicate).

Considered fertilization regimes

Nitrogen fertilization regimes: All trees used in this investigation were fertilized by broadcast with 1200 gm N as the recommendation of ministry of Agriculture (the fertilizer ammonium sulfate 20% N was used). Five regimes were considered based on percentage and time of application. The considered regimes were:

N1: Control as farm’s regime. Fertilizer was split into 3 doses i.e. November 400 g/tree (33.3%), 400 g/tree (33.3%) in January and 400 g/tree (33.3%) in May.

N2: Fertilizer was split into 3 doses 240g/tree (20%) in (January), 600 g/tree (50%) in (May) and 360 g/tree (30%) in (August).

N3: 600 g/tree (50%) in (January), 360 g/tree (30%) in (May) and 240 g/tree (20%) in (August).

N4: 600 g/tree (50%) in (January) and 600 g/tree (50%) in (May).

N5: 600 g/tree (50%) in (May) and 600 g/ tree (50%) in (August).

Boron and zinc regimes

B: boron the product boron sulphate (17. 5% B) was used in three concentrations (1, 2, 3 g/L) / tree i.e. (175, 350, 525 ppm) respectively as B1, B2 and B3.

Zn: zinc the product zinc sulphate (34.5% Zn) was used in the same concentrations (1, 2, 3 g/L) / tree (345, 690, 1035 ppm) respectively as Zn1, Zn2 and Zn3.

B+Zn: combination between them as (B1+Zn1, B2+Zn2 and B3+Zn3) in (1, 2, 3 g/L) / tree.

Treatments were sprayed with a mechanical sprayer until runoff each for three times, the first at the beginning of flower bud induction in (October), the second spray was at bud burst during (January) and the last and third one was at anthesis in (April). Fifty treatments were performed each on 3 separate trees as follows: N1, N1+B1, N1+B2, N1+B3, N1+Zn1, N1+Zn2, N1+Zn3, N1+B1+ Zn1, N1+B2+ Zn2 and N1+B3+ Zn3 and the same way with the treatments N2, N3, N4 and N5.

The following parameters were assessed to evaluate the comparative effects of the conducted treatments.

a) Pollen grains germination percentage

Five inflorescences were chosen randomly on each of the considered trees to assess comparative effects of conducted treatments on this parameter and the fruiting parameters. Pollen germination (%), Pollen grains were collected during anthesis stage. Flower in the male stage of the reproductive cycle were collected in paper bags then transferred to the laboratory. After anther dehiscence when pollen shed they were collected and incubated in Petri dishes on a medium containing 15% sucrose and 0.8% agar according to [16]. Pollen germination was recorded after 6 hours as the percentage of germinated pollen in a total of 500 grains from different areas of plat. Each pollen sample was replicated three times. Pollen was considered to have germinated if pollen tube length was at least twice as long as the diameters of grain, samples were observed by Optical microscope.

b) Yielding Parameters

In both seasons, fruit set was determined by marking five flowering branch ends around the circumference of each treated trees two weeks after full bloom and fruit set percentage was calculated. On the last week of August just at harvest time the number of fruit/ branches was counted to estimate the final fruit set (number of fruits per branch/number of initial flowers *100). At harvest, fruits of each tree were picked, counted and weighed with a digital balance in Kgs. The yield (Kg) was determined as total number of fruit / tree *Average fruit weight (gm)/1000).

c) Fruit quality Parameters

Mature Fuerte fruits were harvested at the 3rd week of September maturity according to [17]. Samples of five representing fruits from each considered tree are harvested, cleaned packed in carton boxes in one layer and transferred to laboratory then both of physical and chemical parameters were assessed.

i. Physical Parameters

The following parameters were determined: fruit weight (g) and flesh weight (g) by using a digital balance.

ii. Chemical Parameters

Free fatty acids were determined by comparison of retention time of the gas chromatographic peaks with these of commercial free fatty acid methyl ester standards, then automatically computed as a percentage by the data processor (Chrom card) from the ratio of individual peak area to the total peaks area of fatty acids. Vitamin C as mg ascorbic acid/100 gm fruit weight was determined and estimated/ 100 ml fruit juice, according to [18].

d) Statistical design and data analysis

Experimental design followed the complete randomized block design. The obtained data was subjected to factorial analysis according to [19]. Attained means were compared by using New LSD method at 5%.

Results and Discussion

Fruit set parameters

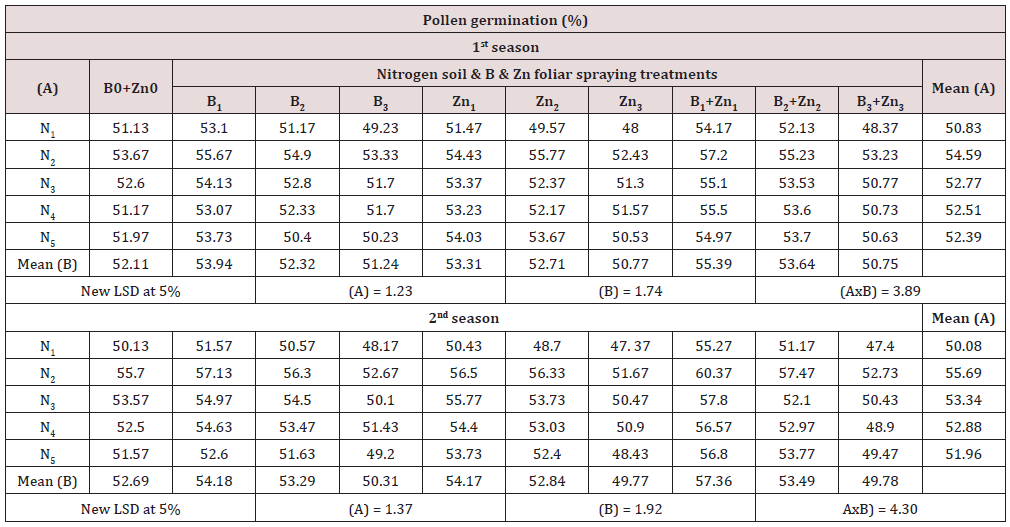
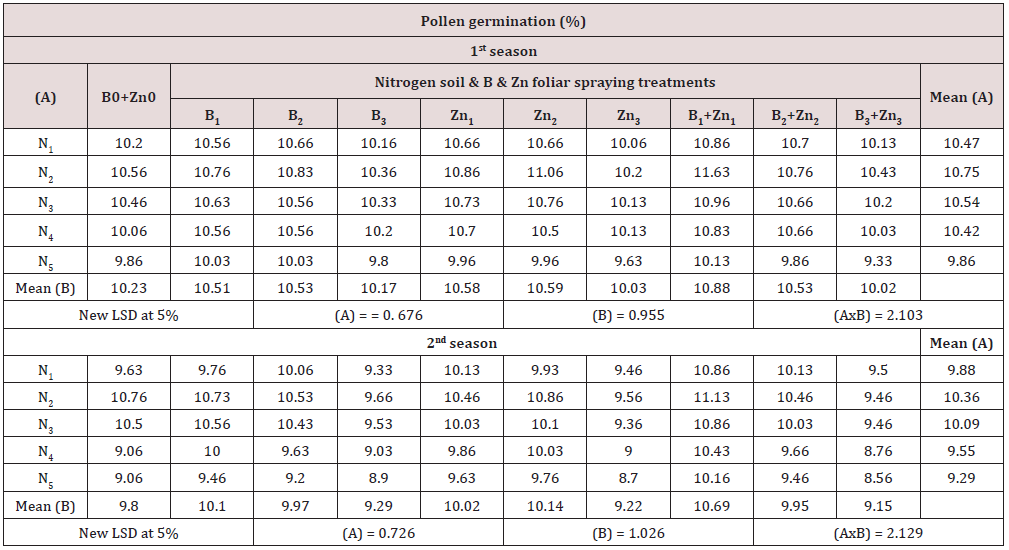
Table 1: Effect of nitrogen soil application time, boron and zinc foliar spraying on pollen germination percentage per tree.

Lupinepublishers-openaccess-Agriculture

Pollen grains germination (%): Data presented in Table 1 showed that pollen germination percentage significantly varied with adopt treatments. With respect to nitrogen regimes, on the average the highest significant percentage attained was dedicated to (N2) treatment amounting to (77.36 &77.74 %) for both seasons respectively whereas, the significantly the lowest percentage was due to (N1) treatment (control) amounting to (59.04 & 59.23 %) for both seasons respectively. With respect to the foliar spray treatments on the average the applied treatments increased this parameter in the first season significantly compared with control except for (B3, Zn3 & B3+Zn3) treatments whose effects were statistically equal to control. In the second season however, treatments (B1, Zn2, Zn3 & B3+Zn3) did not induce any significant effect compared with control. The other treatments resulted in significantly higher percentages. Highest significant germination percentage was attributed to (B1+Zn1) treatment in both seasons amounting to (76.59 & 77.55 %) in both seasons respectively.

Interaction between the two main factors was significant. The highest values of pollen germination percentage (84.33 & 86.13 %) and (84.50 & 84.17 %) in both of seasons respectively were dedicated to (N2+ B1+ Zn1) and (N3+ B1+ Zn1). While the lowest percentage (553.57 & 55.27%) were due to (N1) and (N1+B3) treatments respectively in the first season. While in the 2nd season they were (53.27 & 54.63%) for both with (N1+Zn3) and (N1+B3) respectively. The obtained results are in line with the finding of [20] who proved that effect of combination of these nutrients positively affected pollen germination. [21] reported that boron plays an important role in pollen germination and pollen tube growth.

Fruit set (%): Table 2 showed that the on the average the applied nitrogen regimes in the both seasons were more effective significantly than control with (N1) which resulted in the lowest percentages (50.183 & 50.08 %) respectively whereas, (N2) treatment recorded the highest significant percentage (54.59 & 55.69 %) for both seasons respectively. With respect to foliar treatments, on the average their effects varied. Highest significant percentage in both seasons were attributed to B1Zn1 in both seasons amounting to 55.39 & 57.36 respectively and B1 treatment in the first season (53.94%) while (B3+Zn3) and (Zn3) recorded the lowest values (50.75 & 49.87 %) and (49.87 & 49.77 %) for both seasons respectively.

Table 2: Effect of nitrogen soil application time, boron and zinc foliar spraying on fruit set percentage per tree.

Lupinepublishers-openaccess-Agriculture

Furthermore, interaction between nitrogen soil application regimes and boron and zinc foliar spraying application during both seasons was significant. Data showed that the combined (N2+B1+Zn1) induced the highest fruit set percentage amounting to (57.2 & 60.37 %) in both seasons respectively. These findings are in agreement with [22] who found that increase in fruit set due to boron might be attributed to its role in maintaining high pollen viability and germination. also, it seems that the improvement in fruit set percentage could be explained as a result of increase pollen tube elongation due to boron treatments [23]. [24] on date palm found that (N, P, K and Zn) spray application can improve fruit set, yield and fruit size without thinning. In addition, zinc is involved in protein synthesis, influence on electron transfer reaction including those in the Kreb’s cycle and subsequently on energy production in the plant and also directly involved in the synthesis of indole acetic acid [11].

Yield (Kg)/tree: It is obvious from data in Table 3 that in both seasons of study on the average yield significantly varied in response to nitrogen soil application regimes. The highest significant yield (106.60 & 107.33 kg) in both seasons respectively was attributed to (N2), while significantly the lowest yield (74.49 & 75.42 kg) was obtained from (N1) treatment as control in both of seasons. On the other hand, yield of avocado varied on the average due to foliar treatments. Supreme crop was attributed to the (B1+Zn1) treatment in both seasons (102.66 & 104.59 kg). Whereas both (Zn3) and (B3+Zn3) resulted in statistically the least crop in both seasons amounting to (87.82 & 89.01 kg) and (82.58 & 84.71 kg) respectively.

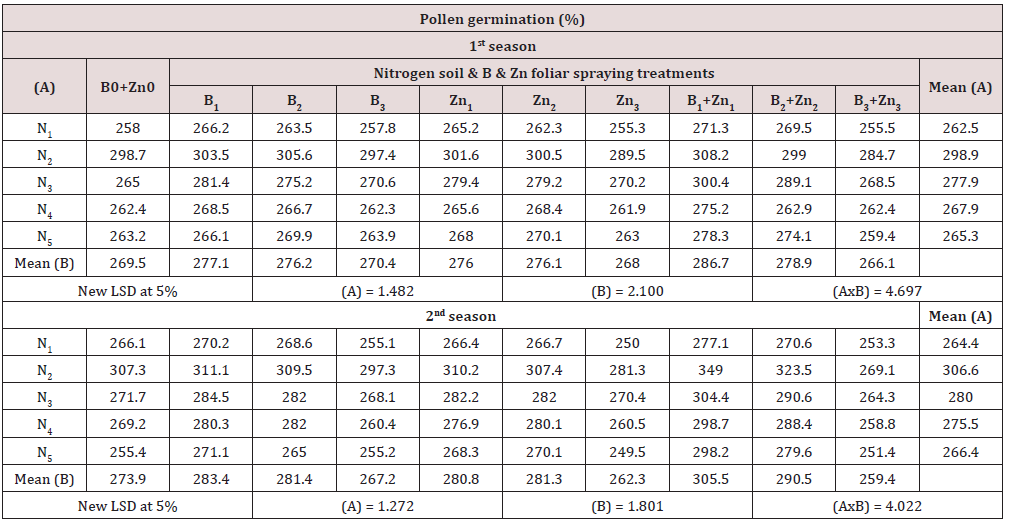
Table 3: Effect of nitrogen soil application time, boron and zinc foliar spraying on fruit weight (g) /tree.

Lupinepublishers-openaccess-Agriculture

Interaction between the studied factors was statistically significant which referred to that nitrogen soil application and boron, zinc foliar spraying act dependently in this concern. The highest yield (113.9 & 116.1 kg) was attributed to from (N2+B1+Zn1) treatment in both seasons respectively, while the lowest yield (69.2 & 64.4 kg) and (68.1 & 65.7 kg) were obtained from (N1+B3+ Zn3) and (Zn3 treated in both seasons, respectively. Enhancements in crop due to the afore mentioned treatments are basically due to their effects on increasing both the pollen grain germination percentage and fruit set percentage .The available reports concerning the effect of nitrogen application time, boron and zinc foliar spraying on avocado yield are in agreement with the results of [14] on avocado and [15] on guava, they found that foliar sprays either boron or zinc increased tree yield.

Physical fruit parameters

Table 4: Effect of nitrogen soil application time, boron and zinc foliar spraying on flesh weight (g)/tree.

Lupinepublishers-openaccess-Agriculture

Fruit weight (g): Table 4 indicated that in both of seasons on the average all considered N regimes significantly increased the average fruit weight than control. Highest significant effect was due to (N2) treatment (298.9 & 306.6 g). While, (N1) control showed the lowest values (262.5 & 264.4 g) for both seasons respectively. With regards to boron and zinc foliar spraying treatments on the average, (B1+Zn1) induced the highest significant fruit weight in both seasons (286.7 & 305.5 g) respectively. While both (Zn3) and (B3+Zn3) treatments showed statistically the lowest values (268.0 & 266.1 g) and (262.3 & 259.4 g) respectively. On other hand, interaction between nitrogen soil application and foliar spraying of boron and zinc was significant. Data cleared that fruit weight also attained significantly the highest magnitude due to. (N2+B1+Zn1) treatment resulted (308.2 & 349.0 g) respectively in both tested seasons. Whereas control (N1) in both seasons with (Zn3) and (B3+Zn3) treatments induced the least fruit weight (255.3 & 250.0 g) and (255.5 & 253.3 g). These results are in general concurrence with [25] and [26,27].

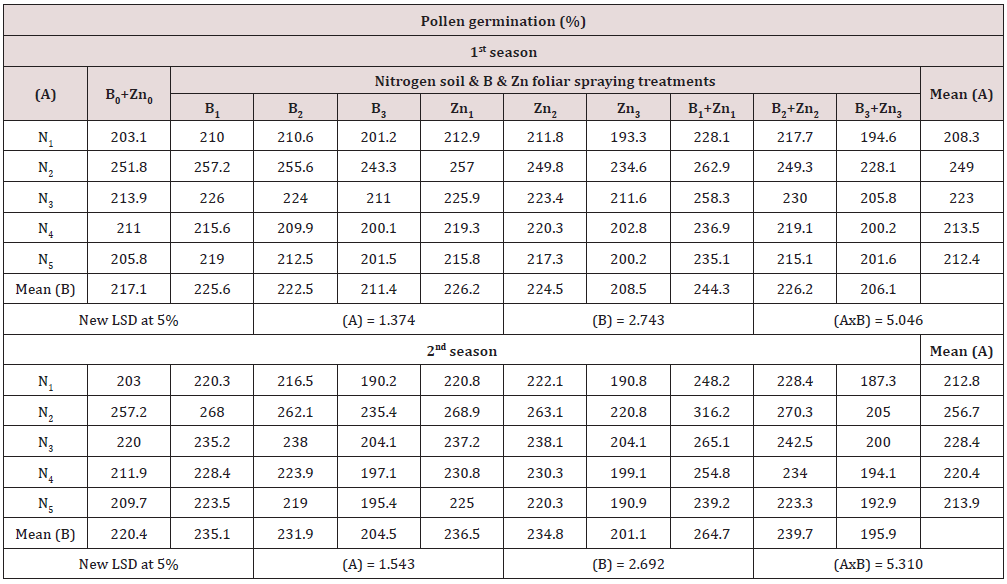
Flesh weight (g): Data in Table 5 showed that flesh weight was significantly affected by applied nitrogen regimes on the average. Significantly the heaviest flesh weight was attributed to (N2) treatment (249.0 & 256.7 g). Whereas, control in both seasons and (N5) treatment in the second one showed the lowest flesh weighted. Concerning boron and zinc foliar spraying treatments, on the average significantly the heaviest flesh weight recorded was (244.3 & 264.7 g) was due to (B1+Zn1). Whereas, (B3+Zn3) in both seasons (206.1 & 195.9 g) and (Zn3) (208.5 g) in the first season showed significantly the lowest values. Interaction between the two main factors was significant. The highest magnitude of flesh weight in both of seasons was dedicated to (N2+ B1+Zn1). The obtained results are in line with the finding of (Kumar and Verma 2004) on lichi.

Table 5: Effect of nitrogen soil application time, boron and zinc foliar spraying on flesh weight (g)/tree.

Lupinepublishers-openaccess-Agriculture

Chemical fruit characters

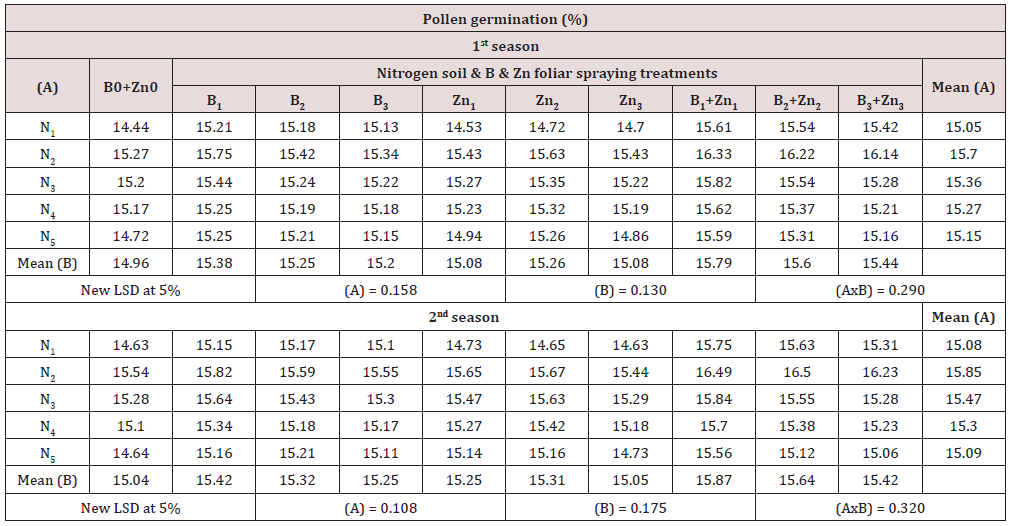
Oil content (%): Oil content as affected by conducted treatments is presented in Table 6. Data showed that on the average (N2) treatment resulted in the highest significant oil content (15.70 & 15.85 %) for both considered seasons respectively. On the contrary showed (N1) induced significantly the lowest content amounting to (15.05 & 15.08 %) for both seasons respectively with insignificant differences from (N5). As for average effect of foliar treatments, (B1+N1) treatment showed the highest significant oil content amounting to (15.79 & 15.87 %) for both seasons respectively. Whereas, unsprayed trees bore fruits with significantly the lowest oil content (14.96 & 15.04 %) for both considered seasons respectively). Differences from (Zn3) treatment were insignificant. Interaction data were significant. Data showed that highest oil content was attributed to (N2+B1+Zn1) and (N2+ B2+Zn2) treatments with insignificant differences between them. While the lowest content was attributed to N1& no spray treatment in both seasons. These results are in no agreement with those of [15] who illustrated that there was no significant different were observed in fat percentage, however this result in the line with agree with [28] and [29].

Table 6: Effect of nitrogen soil application time, boron and zinc foliar spraying on oil content percentage.

Lupinepublishers-openaccess-Agriculture

Vitamin C (mg/100g): It’s obvious from Table 7 that (N2) recorded the highest fruit vitamin C content in both of seasons (10.75 & 10.36 mg/100g). Whereas, (N5) treatment showed the lowest magnitudes. As for the average effects of spraying treatment, as (B1+Zn1) was the most effective treatment in this respect in vitamin C with values (10.88 & 10.69 %) respectively compared with the combination of boron and zinc at 3 g/L treatment. The combination of boron and zinc at 1g/L and nitrogen application time treatment (N2) as (N2+B1+Zn1) increased vitamin C fruit content (mg/100g) in both seasons (11.63 & 11.13), while the treatment (N5) with boron and zinc combination in concentration 3g/L as (N5+B3+Zn3) showed the lower values in both seasons with (9.33 and 8.56) respectively. [30] reported that B and Zn sprays enhanced ascorbic acid content in guava.

Table 7: Effect of nitrogen soil application time, boron and zinc foliar spraying on vitamin C (mg/100g).

Lupinepublishers-openaccess-Agriculture

In Conclusion the Present Study Clearly

Illustrate that nitrogen fertilization regimes clearly affect the cropping and its’ attributes in avocados. also, for foliar application of boron and zinc in combination, it showed clear enhancements in terms of increasing pollen grains germination percentage leading to increasing the crop. Also, their application showed enhancements in crop physical and chemical characteristics [31-33].

As a Recommendation

It is preferable to fertilize avocado trees cv. Feurte with nitrogen at 240g/tree during (January), 600g/tree during (May) and 360 g/ tree during (August) combined with 3 foliar application of boron and zinc at 1g/L at for three times, the first at the beginning of flower bud induction in (October), the second spray at bud burst during (January) and the last and third one was at anthesis in (April).


Read More Lupine Publishers Agriculture Journal Article:

Tuesday, 12 January 2021

Lupine Publishers | Integrated Pest Management for Rodent in Buildings

  Lupine Publishers | Current Investigations in Agriculture and Current Research

Abstract

The objectives of the study are to provide an integrated control program for rodents in buildings and to clarify the most important preventive methods that can be used in the control process and to make some important observations when the application of control methods such as mechanical control, biological and chemical to get the best anti-rodent program inside buildings.

Keywords: Integrated Control Program; Preventive Methods; Control Process; Anti Rodent

Introduction

Rats and mice can be a major pest problem in buildings. They damage food, books, documents, and clothing. Damage to a structure occurs when rats and mice gnaw on structural components, including wiring, wood, and plastics. The gnawing on wire insulation can result in electrical shorts and fires. Rodents have also been implicated in the spread of dangerous human diseases. In short, structural risks, health risks, and a general lowering of environmental quality accompany any rodent infestation. All rodents require food, shelter, and water. The shelter provides protection from predators, inclement weather, and a favorable place to bear and rear their young. Although rodents require water, those water requirements vary greatly by species. Because rodent food and cover (i.e., vegetation) can be influenced by human activities, there has been considerable development of strategies to reduce populations and damage by manipulating vegetation [1].

Follow the tips in the sections below and you will be one step closer to keeping your home permanently free of rats and mice (SRC)

Preventive Methods

The most important steps in controlling rodents are preventive methods because prevention is better than control. The following means:

a) Healthy buildings should be constructed to prevent the entry of mice and rats.

c) Repair / seal any cracks or holes small diameter or inch or larger in the foundation, walls.

d) Repair broken windows and doors - Make sure that the door seals are tight for any inhabited buildings.

e) Place the wire on all building windows.

f) All edible foods (lunch and snacks) will be stored in rodent-resistant containers and not in office drawers.

g) Cracked or unusual food will be cleaned and removed from the intake area at the end of each day.

h) Garbage containers are emptied in the dining areas daily or have narrow blankets.

i) There will be no garbage dumps in the uninhabited buildings.

j) The external garbage areas will remain clean and devoid of organic debris on the ground.

k) Remove rodent attractions such as food or shelter by ensuring that the food is stored safely and that the surrounding environment is clean.

l) Rinse food and beverage containers before disposing or recycling.

l) Rinse food and beverage containers before disposing or recycling.

n) Keep firewood away from the ground and away from structures as much as possible to mitigate shelter opportunities.

o) Fruit trees will be free of fruit that has fallen to the ground during summer and fall.

p) Birds, squirrels and other wildlife will not be fed within 200 feet of any building in the province.

q) Prevent the entry of animals into warehouses and houses.

r) Keep stove tops clean and free of food scraps.

s) Separate your home from paper, fabric, and any similar materials that attract rodents to nest.

4. Methods of Treatment

Mechanical Control

Using Traps

Using traps instead of rodent poisons gives you clear confirmation of a captured rodent and allows you to better gauge the effectiveness of treatment. You are also able to dispose of rodents immediately rather than dealing with the foul odor of rotting carcasses from poisoned rodents inside your walls or otherwise out of reach. Most important, using traps allows you to avoid rodenticides, which pose a greater threat of exposure to children, pets, and non-target wildlife, including natural predators (SRC).

Traps Description

i. Live Animal Trap: This is a catch and release system that avoids killing a rat or mouse. Some states prohibit releasing rodents into the wild. The Center for Disease Control (CDC) warns that captured rats or mice might urinate and increase risk of spreading disease. Muhammad Sarwar (2015)

ii. Snap Trap: This is the oldest type of trap and uses a springloaded bar to kill a rodent on contact. Some modern snap traps prevent risk to children and pets by enclosing the device in a plastic box.

iii. Multiple Catch Live Mouse Trap: This is a catch and release system that allows for capture of multiple mice.

iv. Glue Trap: Glue traps are not recommended because the adhesive plate that is used to capture rodents can also trap birds, baby animals, lizards, and even pets. These traps also cause undue suffering to rodents. The CDC warns that captured rats or mice might urinate and increase the risk of spreading disease. Enclosure boxes are plastic boxes that can fit a single snap trap, sometimes more, to provide an additional layer of protection for kids and pets. These boxes also hide the dead rodent, making for easier disposal of rodent, and can be re-used (SRC)

v. Electronic Trap: This battery-powered trap delivers an electric shock that kills rodents quickly. This is a newer type of trap, and models are available for both rats and mice.

vi. Important Notes:

a) Be sure to place traps in locations where children and pets cannot access them or place traps in safety enclosure boxes.

b) Place the trap sideways next to the walls.

c) Do not place the trap continuously.

d) Wash the trap after the fishing process.

e) Remove rodents by using traps be cautious with live traps as rodents might urinate which increases the risk of spreading disease.

f) Use gloves when disposing of dead rodents, nests, or any nesting material.

g) Spray the dead rodent or nesting material with a disinfectant solution and allow them to soak for 5 minutes before disposing rodent or materials in a secure plastic bag.

g) Spray the dead rodent or nesting material with a disinfectant solution and allow them to soak for 5 minutes before disposing rodent or materials in a secure plastic bag.

i) Place the plastic bag with rodent or nesting material into another plastic bag along with any wipes or rags that were used to sanitize the surrounding area.

i) Place the plastic bag with rodent or nesting material into another plastic bag along with any wipes or rags that were used to sanitize the surrounding area.

Destruction of Burrows

Pruning both for adult trees or foliage with disposal of pruning products so as not to be a cache of mice to form a nest on these wastes.

Biological Control

Using Natural predators such as cats can help to control rodent populations by feeding on rats and mice. (SRC).

Chemical Control

Conditions to be Available Before Rodent Control

a) The control process should be carried out in case of the presence of mice or their effects.

a) The control process should be carried out in case of the presence of mice or their effects.

c) You should use bra-baiting so that avoidance of poison bait does not occur.

d) The control should be performed when the population density is as low as possible [3].

e) The food available should be as low as possible.

f) The control method varies depending on the location and food available.

g) You must use a bait different from the food available in the place.

h) Use attractants if necessary.

Using Rodenticides

Rodenticides consist of different types of poisons used to kill rodents. Rodenticide baits can be lethal for any mammal or bird that ingests them and are not only poisonous for rodents. As a result, all baits pose a high risk of poisoning for non-target animals that might eat the bait or consume a poisoned rat or mouse [4].

a) The use of rodenticides must be used with preventive measures such as gloves.

b) If you choose to use rodenticides, you should be ready to deal with these potential consequences:

c) Rodents are likely to die in locations where they cannot be retrieved

d) The smell of a dead animal will persist for several weeks to several months.

e) Always read and follow the label instructions on the pesticide product. The label is the law and you could be liable for any damage resulting from not following the label instructions.

f) Indoors, only place rodenticide bait stations in locations that are completely inaccessible to children and pets-inside walls, under heavy appliances, or in enclosed crawlspaces [5].

g) It is best to use anticoagulants because they are environmentally safe [6].

h) Passage on the bait’s stations in the early morning or before sunset.

i) The lids of all bait stations must be securely.

j) All bait stations should be numbered, and their location marked on a simple floor plan map.

k) Bait stations should be inspected during every service visit for monitoring purposes and to ensure stations are not providing harborage to non-target pests [7].

l) When dead mice must be disposed of quickly because they have dangerous external parasites.

m) Once all signs of rodents are gone, remove bait stations promptly by placing in a secure plastic bag. (UCDIO) [8].

Read More Lupine Publishers Agriculture Journal Article:

Monday, 11 January 2021

Lupine Publishers | Role of Ephemerals in Sustainability of Grazing Lands in Arid Areas

  Lupine Publishers | Current Investigations in Agriculture and Current Research


Abstract

Ephemeral species germinate with onset of rains and complete their lifecycle by setting seeds as the soil moisture declines within one growing season. Though their life cycle is short, they play a multifaceted role in ecological and economic sustenance of arid regions in general and grazing lands in particular. This role of ephemerals emanating from various studies has been synthesized here in respect of Indian arid zone. Nearly half of the reported 682 species in the Indian arid zone are ephemeral and seasonal, the majority being monsoonal. They constitute bulk of alpha diversity on any landscape. These occur on all land uses i.e., croplands and grazing lands. Species composition of ephemerals which varies on different habitats and in varying annual precipitation has been described in this paper.

Changes is species composition, cover and biomass of ephemerals due to grazing have been discussed. Comparing phenology of selected seasonals in different grazing pressures with those in protected areas revealed that increasing grazing stress caused a typical shift in their phenophases. Production potential of ephemerals estimated in a large variety of situations indicated that they contribute differently to the total biomass of the grazing lands representing different range conditions. Since ephemerals being palatable offer grazable material, their role in prolonging duration of range use by the livestock has been proved from case studies. Besides, ephemerals occur as weeds of cropland, their composition and biomass on different habitats have been described to assess their contribution to liverstock support. The ecological value of self regenerated ephemerals in rehabilitation of disturbed lands such as mine spoils has been discussed. Many of these ephemerals are also medicinally important with proven economic potential for enhancing the livelihood of desert dwellers.

Keywords: Ephemerals; Sustainability; Grazing; Phenophase; Biomass

Introduction

Arid regions experience a spurt in vegetation emergence during monsoon. While perennials regenerate, the annual species germinate to put up a sprawling green cover bringing profound changes in the desert landscape. These include changes in species compositions, phenology, production and utilization of these ephemerals vis-a-vis perennials. While extensive literature exists on these aspects in respect of perennials, little attention seems to have been paid to the desert ephemerals. Secondly, twelve extreme arid districts in western Rajasthan have 67.2% area under culturable waste which is used as grazing ground [1]. This region provides highest quantum of meat, milk, and wool to the country from an area (36%) of which 2/3 area is largely a degraded wasteland. Encroachment of these grazing lands is shrinking their area on one hand while quality of the feed is also declining due to overstocking. How constantly shrinking grazing lands in this region, which are also declining in feed quality with less perennial grasses sustain enhancing livestock pressure has been a paradox. Do ephemerals play any role in sustainability of these grazing lands was a question that needed an independent investigation for arriving at unbiased conclusion. An attempt has therefore been made in present paper to collate and synthesize results of studies on various such aspects to prove that ephemerals do play an important role in sustainability of grazing lands in arid areas with special reference to Indian arid zone

The Environment

Region facing annual water deficit of two - third or more of the potential evapotranspiration (PET) is classified as arid [2]. Semi arid regions experience this deficit ranging from one third to two third of PET. Using this criteria 9.56 lakh km2 (30.50%) can be classified as semi arid and 3.81 lakh km2 (10.16%) area as arid in India. Arid region of India has over 60% area in western Rajasthan and experience extremes of temperature (0 to 4 °C in winter and 45- 48 °C in summer), low annual precipitation ranging from 450mm in the east to 10mm in the west, low humidity, high wind velocity and high evapotranspiration. Soils are sandy, poor in nutrient with low water holding capacity and prone to erosion by wind and water. Natural vegetation in such edapho climatic conditions is sparse and stunted, predominantly spiny belonging mainly to grass cover type Dichanthium- Cenchrus-Lasiurus- type and very small area having Sehima- Dichanthium type [3].

Dichanthium - Cenchrus_ Lasiurus Cover Type

This grass cover occurs in the region receiving 100-750mm rainfall with higher mean temperature during summer (42-48 °C) and winter temperature as low as 1 to 2 °C). These grasses occur mainly on alluvial soils with varying amount of loam having high soluble salts and pale gray and brown colours. The geographical extent of 4.36 × 10⁵sq km area is distributed in northern portion of Gujarat, Rajasthan (excluding Aravallis), western Uttar Pradesh, Delhi State and semi arid Punjab and Haryana [4]. This cover type has 11 perennial grasses, 45 other herbaceous species of which 19 are legumes. The predominant woody perennials here include Acacia senegal, Calotropis procera and Cassia auriculata. These areas look typical as savanna lands.

Floristics of Herbage

Table 1: Herbage species and their families in the Indian arid zone (S=season, W=winter, M=monsoon, A=all yr).

Lupinepublishers-openaccess-Agriculture

Arid part of Rajasthan has 682 species. Of these 331 are ephemerals belonging to 44 families [5] (Table 1). Hydrophytes have been excluded from this analysis. Some 54 species are winter ephemerals; 17 occur in both monsoon and winter. In true sense, some 260 species (38.12% of flora) constitute monsoon herbage. These belong to 188 genera and 44 families. Amongst families, Poaceae has maximum i.e. 53 monsoon species followed by 25 in Fabaceae and 20 each in Cyperaceae and Asteraceae, 15 in Euphoriaceae, 14 in Convolvulaceae and 11 in Acanthaceae, and remaining families having lesser than these species.

Herbage Communties

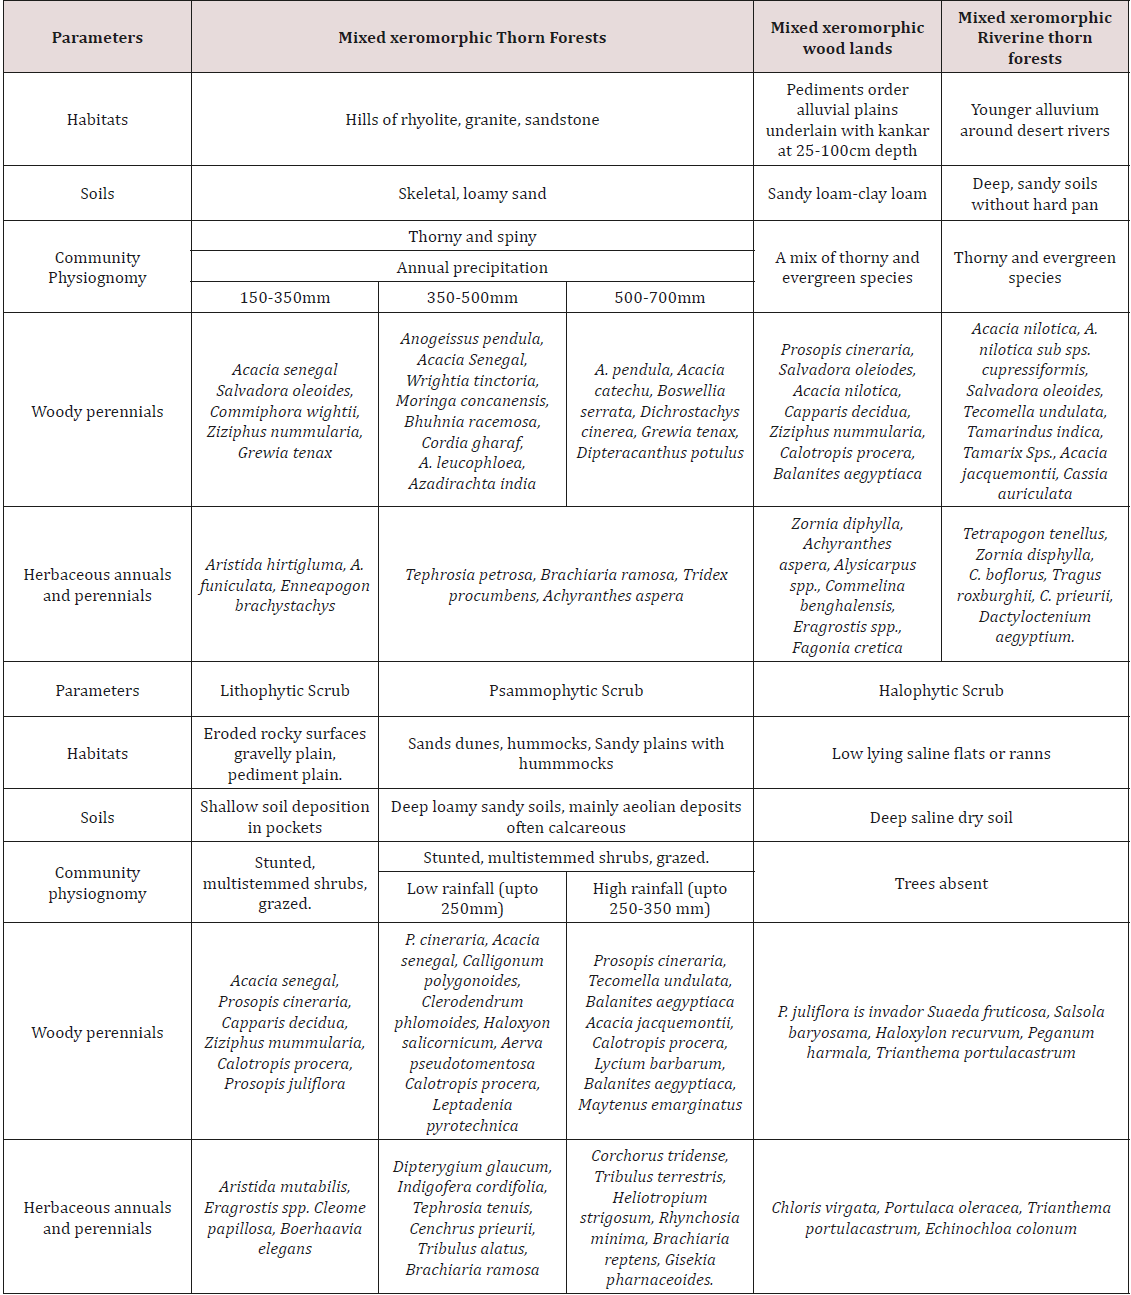
Vegetation is a reflex of climate, land form and its surface deposit. Broadly classified on the basis of physiognomy, six characteristic types are recognized in the Indian arid zone [6]. These are

a) Mixed xeromorphic thorn forest on hill and rock outcrops.

b) Mixed xeromorphic wood lands on piedmonts and alluvial plains.

c) Mixed xeromorphic riverine thorn forest on younger alluvial plain around desertic river and water bodies.

d) Lithophytes scrub on eroded rocky gravelly plains.

e) Psammophytic scrub on sand dunes, hummocks and sandy plains.

f) Halophytic scrub on low lying saline flats or ranns (Table 2).

Table 2: Vegetation types of Indian Arid zone.

Lupinepublishers-openaccess-Agriculture

Each vegetation type has specific trees, shrubs, forbs, grasses and seasonals [7]. Though ephemeral/seasonals are specific to each vegetation type, their common occurrence within two or more vegetation types indicates that their niche requirements are met there. It is important to note that most of the ephemerals often form pure colonies under trees and shrubs. In fact, these are the pioneer species in succession of vegetation on these habitats when their dominance is 80-100% in the beginning of colonization and ecesis and it declines to often 20-30% in the sub-climax to climax formation.

Life Cycle Of Ephemerals

Besides showing spatial specificity, some ephemerals are unique in their temporal presence; being ‘accidental vegetation [8]. Accidental vegetation appears only during high rainfall; say once in the years when rainwater collects in depression where these species come up. Monsoon herbage act as ‘rain-gauges’ i.e. these will germinate only after a particular amount of rain is received in one event. In contrast, there are species which germinate at the very first event of rainfall irrespective of amount. These include large number of species of Indigofera, Aristida and Cenchrus. If there is no successive rain with in a span of 15-20 days these will start flowering and set seeds as early as 20 days to 40-50 days. This has been confirmed by sequential sampling of permanent plots where seasonal variation in monsoonal vegetation has been charted and measured on rocky habitats [9], alluvial plains [10] and semi rocky habitats [11]. Their findings are: Within 21 days of rain, annuals were maximum 33.58% in August and declined to 13.6% by end of September on rocky habitats of Kailana, near Jodhpur. Likewise, maximum dominance of annual grasses was 14% within 18 days of rain and it declined to almost 1/3 i.e., 4.6% by the end of September on alluvial plains in Jodhpur. It has been found that at each germination event, 20-25% seeds of entire seed bank germinate and remaining are dormant. This is an ecological adaptation in annuals to germinate only a fraction of total seed bank so as to preserve the rest for next rain event. This ensures that if seedlings die or disappear without completing life cycle and formation of seeds, the remaining seed bank portion held with in soil is able to regenerate and continue the progeny. If however, there are continuously well distributed spells of rain, they continue to grow vegetatively till they face water stress. Growth up to 50-60 cm height has been observed in these species in case of prolonged wet spell. This indicates the plasticity in annual habit of these plants.

Composition of Herbage in Protected and Degraded Conditions

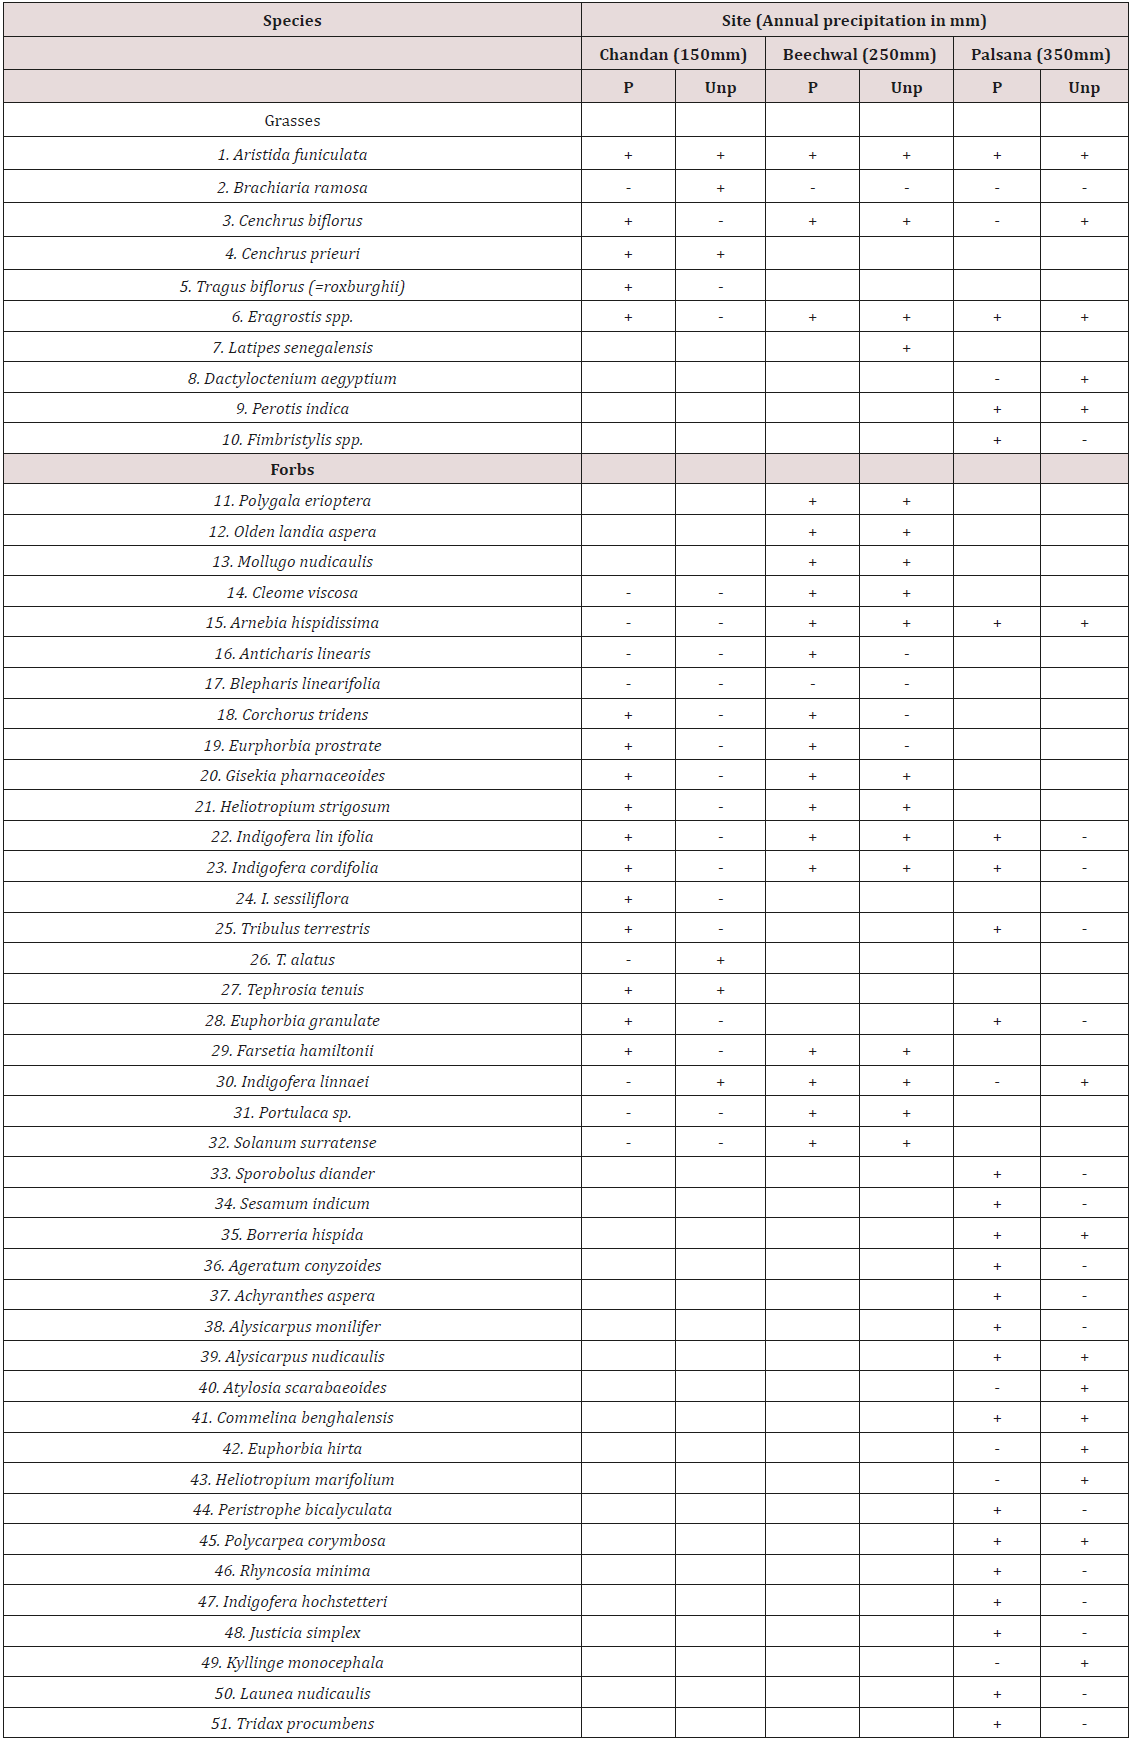
Table 3: Botanical composition of herbage in protected (P) and unprotected (Unp) grazinglands in three rain fall situations in Indian arid zone.

Lupinepublishers-openaccess-Agriculture

The composition of seasonals undergoes a drastic change upon grazing. A comparison of protected and grazed paddocks of grazingland at the end of 3 years and receiving 150mm, 250mm and 400mm rain at Chandan, Beechwal and Palsana respectively revealed that grazed sites had preponderance of unpalatable annual forbs and such grasses which have awns that deter animals (Table 3) from grazing [12]. Analysis of dominance revealed that in low rainfall zones, seasonals have RIV of nearly 10 in protected conditions and this increased three times upon degradation. In 250mm rainfall zone, the RIV of seasonals nearly 12 in protection became double i.e. 24.33 in degraded conditions. In 400mm rainfall, the seasonals dominated by having RIV of 54 under protection and 75 under degradation. Thus dominance of monsoon seasonals increased with increasing annual rainfall and increased grazing stress.

Production Potential

There are a large number of studies on estimation of dry matter yield of rainy season ephemerals at regional, landscape and local level. Shankar and Kumar [13] estimated Aristida – Oropetium cover on 2526sq. km area in Jaisalmer with their yield as low as 5 kg/ha. However, contribution of seasonals varied from 2-27% in total dry matter that was 180 kg to 922 kg/ha on different habitats in Jaisalmer. Potential of fair condition class grazingland was estimated as air dry 14 kg/ha for Aristida- Eragrostis type, 700 kg/ha in Digitaria adscendens type, 3430 kg/ha in Echinochloa colonum type and 4570 kg/ha in Dachtyloctenium aegyptium in Jalore district [14]. At landscape level, production of palatable monsoonals in 3 landscapes in Churu district was 174, 250 and 567kg/ha on forest floor, a planted grazingland and moderately degraded natural grazing land (Table 4). In Sikar, a protected site has 491kg/ha (92.9%) palatable and 40kg (7.1%) unpalatable herbage. The adjoining unprotected site had 230kg/ha palatable (71%) and 95kg/ha unpalatable herbage biomass [12]. Not only the total herbage yield but also yield of palatable species decline upon indiscriminate grazing. This also indicated a potential of regeneration of seasonal palatable herbage to the tune of nearly half a ton per hectare by mere protection.

Table 4: Production potential of grazingland herbage (kg.ha) in Churu District.

Lupinepublishers-openaccess-Agriculture

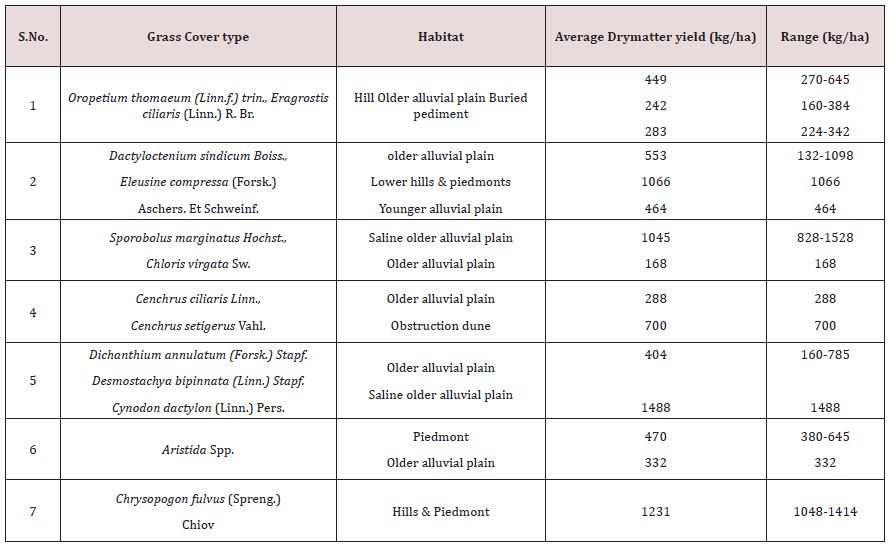
Table 5: Herbage Yield of different grass cover types on different habitats in Guhiya catchment.

Lupinepublishers-openaccess-Agriculture

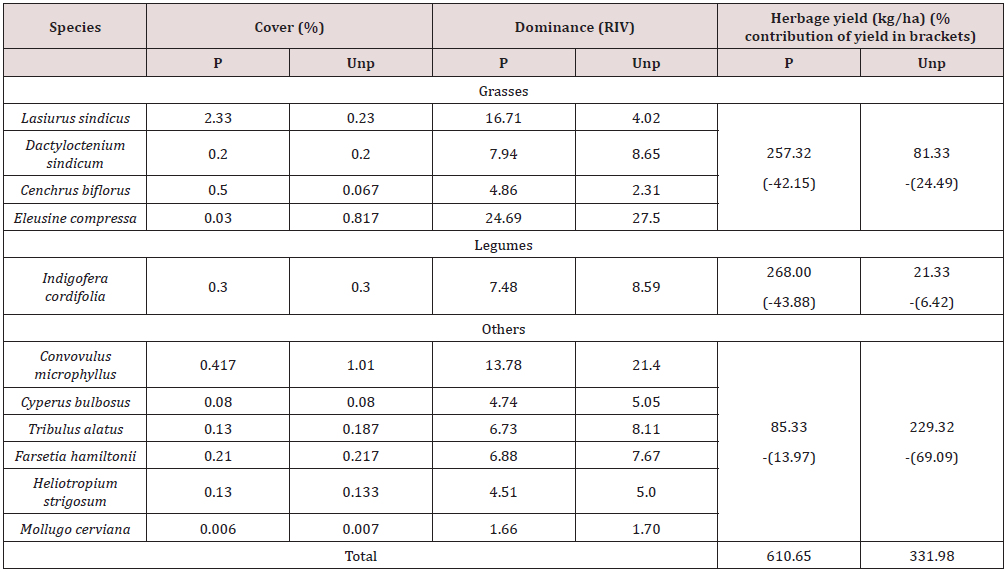
Its dependency on rain amount was proved by [15]. Estimates of grazable biomass in Guhiya catchment covering Pali and southem Jodhpur district (Table 5) revealed that predominantly seasonal grazinglands have approximate 449-470kg/ha dry matter yield, which is comparable to such grazing lands supporting perennials species. A scope of improvement in yield and carrying capacity was also predicted [16]. At village level, estimates in Bikaner district revealed that herbage yield in overgrazed native grazinglands was nearly half (330.98 kg/ha) of the nearby protected area (610.65kg/ ha) which was fenced for two years (Table 6). It is interesting to note that even under protection the bulk of dry matter, i.e. nearly 44% was by a single monsoon legume i.e. Indigofera cordifola (Table 6) though there were other contributors like Cenchrus biflorous, Tribulus alatus, Farestia hamiltonii and Mollugo cerviana, their exact contribution was not reported by [17]. But this estimate amply proves that monsoon seasonals not only make up 34% of floristic composition, they also make up over 50% of biomass of grazing lands which is palatable too, in both protection and degraded conditions.

Table 6: Cover, dominance and herbage yield in a protected (P) and unprotected (Unp) village grazinglands in six villages in Bikaner.

Lupinepublishers-openaccess-Agriculture

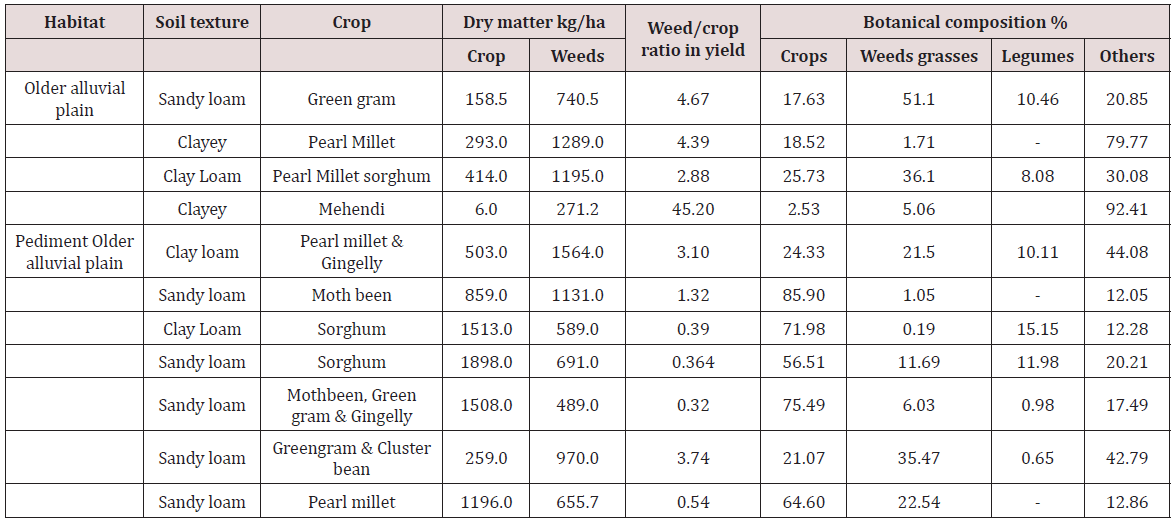
Similar conclusion was reached by [18] in seven-year monitoring of rangelands of Lawan in Jaisalmer stating that “--- major contribution in all grazing plots was from Indigofera cordifolia (1.26-1.98%) and less than one percent form perennial grasses”. In extremely degraded conditions however, all palatable are removed and unpalatable biomass also remain ½ and 1/3 of that in protected situations. The important implication of this finding is that nearly 70% of grazingland in Indian arid zone are degraded while 14% are in fair, 13% in good and 2-3% have excellent condition class [19]. It is these 70% areas which have poor perennial plant cover but a preponderance of monsoon seasonals and these ephemerals constitute available grazable material @ 500Kg/ha to sustain liverstock.

Ephemeral’s Response to Grazing

Impact of different levels of grazing on cover of selected annual forbs and annual grasses in permanent quadrats and transects in arid and semi arid regions was investigated in one monsoon season at two sites in India: low rainfall arid site (240mm/year) at Chandan experimental site of CAZRI in Jaisalmer district in western India and a high rainfall semi arid site (400mm/year) at Pali experimental site of CAZRI in Pali district [20]. Treatments were: No grazing (control), 50% or half of carrying capacity (3 sheeps/ha), 100% of carrying capacity (6 sheeps /ha) and 50% more than carrying capacity(8 sheeps/ha). Mild grazing of 3 sheep/ ha and sometimes even 6 sheep/ha at arid Chandan site enhanced the cover of three annual grasses, Aristida mutabilis, C. biflorus, Latipes senegalensis from July to October. Such an increase was more than that in control or 8 sheep/ha treatment, confirming the fact that mild grazing promotes the growth. In contrast, annual forbs (Indigofera cordifolia, I. linifolia, I. hochstetteri and Gisekia pharnaceoides) cover declined with increasing grazing pressure. Response to increasing grazing pressure was different at semiarid Pali site: though Aristida mutabilis increased with increasing grazing pressure, the other forbs species also increased up to September and declined later, with increasing grazing pressure.

This was also confirmed by positive significant correlation between cover and grazing intensity i.e., increases in cover with increasing grazing pressure in Aristida mutabilis. Importantly, correlation coefficient between grazing pressure and cover of Indigofera hochstetteri, I. cordifolia, I. linifolia at arid site and C. pumila at semi arid site was strongly negative. Thus same species behaves differently in two different rainfall situations. It emerged from above that annual species after being nibbled or partly grazed by sheep re-sprout and assume growth in semi arid situation, behaving much as multi cut fodder corp. These findings were in conformity with results of an earlier grazing experiment of three years at Kailana, Jodhpur where per cent plant cover increased from 4.8 to 7.42% and forage yield, 28.3 to 29.8kg/ha after grazing [21].

In the same experimental paddocks at Chandan in Jaisalmer district of western India, phenological changes at monthly intervals were also recorded under different grazing pressures. Concurrently, palatability of species as and when the sheep bites was also noted for one hour each during morning (8-10AM), noon (12-2PM) and evening (4-8PM). Results revealed that vegetative phase was shortened and flowering, fruiting and seed set occurred earlier in perennial like Lasiurus sindicus as the grazing pressure increased [22]. Thus compressing the vegetative phase emerged as a mechanism of evading grazing pressure in this perennial grass. Reverse was noted in all the ephemeral species. Vegetative phase was prolonged with increasing intensity of grazing and thus seed setting was delayed in ephemeral species Aristida funiculata, Indigofera cordifolia, Indigofera linifolia and Corchorus tridense. This shift in phenophase could be related to their relative palatability. Since annual species germinate and grow with their fresh foliage during the monsoon rains, annuals (due to fresh foliage) were eaten in preference over the perennials. This preferred removal of annuals due to their palatability, if continued unabated, would finally remove them completely due to overgrazing. In fact, such a shift in phenophases, induced by increase in grazing intensity, can effectively be used as indicator of beginning of deterioration of rangeland health. And this becomes the start point of desertification in grazing lands in deserts. Moderate grazing is therefore, desirable for maintaining range health for sustainable grazing. On the other hand, it is also important to realize this potential of monsoon ephemerals as grazing material as by way of corollary these can be sown and then cut, not grazed, and fed to animals.

In order to further understand the role of herbaceous annual and seasonal vegetation, another grazing study was undertaken for two consecutive years in Lasiurus sindicus dominated protected grazingland at experimental area at Chandan in Jaisalmer district Kumar et al. [23]. There were five grazing treatments:T-1: Control (No grazing); T-2: Optimum carrying capacity with supplemental feed (6 sheep grazing); T-3: Optimum carrying capacity without supplemental feed (6 sheep grazing); T-4: Double the carrying capacity with supplemental feed (12 sheep grazing) and T-5: Double the carrying capacity without supplemental feed (12 sheep grazing). Results revealed that irrespective of supplemental feed, 70-80% of L. sindicus cover declined in paddock with double the carrying capacity (T-4 and T-5). This study again proved findings in previous para i.e., preferential consumption of seasonal and low perennials such as Ochthochloa compressa and annual Cenchrus biflorus in monsoon and post-monsoon. Grazing animals did not eat perennial species as if these have been left by them for future consumption when these ephemerals dry, die and no more available say, after December. This postponement in consumption of perennials effectively prolonged the duration of range-use. On the other hand, as the grazing pressure increased, biomass declined by 80% in two years i.e., from 461.5 (T-2), 306.6 (T-3), 450.5 (T-4) and 341,1 (T-5) kgha-1 to 70.3 (T-2), 29.6 (T-3), 28.7 (T-4) and 15.4 (T-5) kgha-1. In rain driven ecosystem of arid lands, even a small variation in the quantum, spread and timing of rainfall causes major effect on vegetation composition [24]. These have cascading effects making the whole system vulnerable to drought and adversely affecting sustainable productivity of the rangeland ecosystem [25]. This study thus, concluded that rainy season ephemerals by way of their preferential consumption give temporary or seasonal rest to perennials like L. sindicus enabling it to grow and recover. Vetter et al. [26] while discussing such differences in composition, structure, diversity and forage production potential of vegetation under different grazing intensities reasoned that these ephemerals can draw water from whole soil profile throughout the growing seasons where as climax grasses withdraw water from deeper layers of 2-5m during droughts [24].

Thus, resource utilization is partitioned to be optimally used among ephemerals and perennials resulting in better growth of both these components. Consequently, grazable material becomes available from the same grazing land for a longer duration and that imparts resilience to the grazing land system. Fynn [27] also reported that short, nutritious grasses in functional wet seasons habitats facilitate optimum intake of nutrients and energy for lactating females, for optimal calf growth and building body stores. Heterogeneity in vegetation composition due to ephemerals was also emphasized for achieving optimum grazing use by [28]. Evidently, Kumar et al. [23] in their study also related the spatial patterns created by patches of seasonal vegetation in the landscape and temporal patterns of biomass (= productivity) availability of seasonals in post monsoon and perennials in winter and summer with long term sustainability. Fynn [27] also concluded that grazing based on spatial and temporal variability in forage quality and quantity would be more sustainable. Nutritionally also, seasonal vegetation having higher crude protein than perennial grasses [29] meets the nutritional needs of the livestock. Utilizing above mentioned spatial and temporal patterns was also recommended as best range utilization strategy by [27]. But Kumar et al. [23] found that free range animals in monsoonal rangelands themselves do selective grazing based on seasonal availability of biomass i.e., they graze annuals first (August to November) and then perennials (December to April) and both litter and perennials in summer. A mix of cattle, goat and sheep would further optimize to increase range utilization.

Ephemerals/seasonals, therefore, not only provide heterogeneity and complexity to the grazing landscape, they also complement the nutritional needs as well as prolong the period of range use thereby delaying the onset of degradation. This spatial heterogeneity imparted by seasonal vegetation in an overall matrix of perennial tall grasses and woody perennials need to be managed optimally by grazing management of both seasonals and perennials. It was therefore, concluded “…. that

a) arid rangelands have intrinsic heterogeneity in species composition,

b) this mix of seasonal and perennials (= heterogeneity) is ably supported by the landscape by way of partitioning of resources,

c) lifecycle patterns of seasonal fits well to meet the nutritional needs of livestock and

d) grazing of such seasonal vegetation thus helps sustain perennial tussocky rangelands for longer range-use …”.

Such a functional role of ephemerals as revealed in the aforementioned studies in respect of grazing animals has also been found in an entirely different context by Bhardwaj et al. [30] who reported the importance of ephemerals in enhancing the population of critically endangered bird, the Great Indian Bustard Ardeotis nigriceps with a remaining population of ~200 birds (IUCN 2011). Biased habitat preference by Great Indian Bustard for new closures which were ploughed instead of old ones prompted a detailed vegetation analysis by [30] amongst different landscape units. The newly ploughed sited had regeneration of lot of ephemerals in the ensuing rains compared to the parched sites in the old ones. This led to devise a very simple management strategy of ploughing the open areas in mosaic pattern for breaking the crust laden hard surface without disturbing the Lasiurus sindicus and other perennial grasses, shrubs and trees of old closures annually just before onset of rains. Selective ploughing brought out the stored seed bank of annuals on to the surface enabling them to use moisture of the very first rain and germinate to grow further in subsequent rains. In fact, such slight amount of disturbance is known to increase diversity in all dry land ecosystems and is a desirable management intervention for the conservation of critically endangered Great Indian Bustard.

Ephemerals as Crop Area Weeds

Table 7: Dry matter yield of different crops and their weeds in Guhiya catahment. (Source: Shankar and Kumar, 1984).

Lupinepublishers-openaccess-Agriculture

Ephemerals appear to be out of place in crop lands and hence called weeds. Desert farmers know the utility of these seasonals as valuable forage. Quite often, especially the monsoon ephemerals are collected, air dried and stored in livestock yard for future used. Heaps of such air dried palatable ephemerals are stacked species wise as an effective strategy of escaping drought by way of providing feed to livestock during ensuing drought when crops fail. It becomes therefore, imperative to assess the quantity of such ephemeral forage in crop fields. A study to assess their biomass revealed that weed biomass often far exceeded their companion crop [31] i.e., their biomass was 2 to 4 times more than crop (Table 7). These are mostly palatable weeds giving 655 to 1564kg/ ha of dry matter depending upon preponderance of weeds. Thus seasonal ephemerals as weed contribute immensely to livestock feed but estimates are not available to assess their contribution at landscape level.

Role of Ephemerals in Rehabilitation of Mine Spoils

Though perennials are preferred for rehabilitation of degraded lands like mine spoils, but once the seeds bank is added to soil, annuals by virtue of their repid turn over, play a key role in accelerating process of rehabilitation. Kumar et al. [32] reported as many as 14 self regenerated annuals, equivalent to that of perennials in freshly rehabilitated plots of gypsum mine spoil in Barmer, an extreme arid district in western Rajasthan. These provided organic matter to soil facilitating growth of shrubs and trees. These can be therefore, easily employed to grow and prepare niche for future generations of plants. In another rehabilitation programme for backfilled areas after lignite mining in Barmer (1999-2004), surface layering of local soil and murram was carried out and then planted with eight different tree species, seven shrub species and one perennial grass [33]. Monitoring the self- regenerated natural vegetation in these treatment blocks revealed that irrespective of treatments, all blocks had immense regeneration of ephemerals that constituted 46-48% of total self regenerated species that varied from 39 to 75 species in five rehabilitated blocks. Appearance and growth of nearly half of regenerated vegetation being ephemeral proved their crucial role in accelerating the process of rehabilitation by way of organic matter build up and its rapid turn over that later on supports growth of other companion planted species. Evidently, understanding the role of ephemerals as organic matter builder, succession facilitator and ecological moderator deserve deeper studies so as to optimize cost of such programmes and achieve faster system recovery in reclamation of degraded and drastically disturbed lands, especially in arid regions.

Ephemerals as Medicinal Plants

A survey of ethno medicinal plants in 128 villages in four arid districts in western India namely Jaisalmer, Barmer, Bikaner and Jodhpur from year 2001 to 2005 revealed 131 taxa of medicinal importance (Kumar and Parveen, 2004). Of these, herbs were maximum i.e. 52 (39.69%) followed by 29 shrubs (22.13%), 25 trees (19.84%), 11 climbers (8.39%), 9 grasses (6.87%), 3 sedges (2.29%) and 1 fungus (0.67%). Of the total species, 70 were perennials (53.43%) and 61, ephemeral or annuals including crops (46.57%). These values broadly match the Raunkiarian’s life forms in this desert in which nearly 49% are therophytes or annuals and 51% are other life forms which are perennials Mertia and Bhandari [35]. The 29 ephemeral medicinal species reported from wild grazing lands in this study are :Abutilon indicum, Achyranthus aspera, Amaranthus viridis, Argemone mexicana, Blepharis sindica, Cenchrus biflorus ,Cleome viscosa , Corchorus depressus, Corchorus tridens, Cucumis callosus, Dicoma tomentosa, Digera muricata, Eclipta alba, Eragrostis minor, Euphorbia granulatae, Fagonia indica, Heliotropium marifolium, Indigofera cordifolia, Mollugo cerviana, Mukia maderaspatana, Neurada procumbens, Pedalium murex, Phyllanthus fraternus, Polygonum plebieum, Portulaca oleracea, Pulicaria crispa, Sisymbrium irio, Solanum surattense and Tribulus terrestris. Almost all of these species come up naturally during monsoonal rains and hence are collected from wild and marketed. Many of these are immensely useful and are species of trade both nationally and internationally i.e., Tribulus terrestris, Pedalium murex, Solanum surratense, Fagonia indica, Blepharis linearifolia, Phyllanthus fraternus, and Eclipta alba. Thus these nature’s herbals enhance the cash flow in the hand of farmers. But in view of their increasing demand, a need is felt to domesticate and bring them into cultivation so as to save their native gene pools in the wild from being lost. This will also diversify the cropping system and add to the sustainable livelihood of desert dwellers.

Epilogue

Ephemeral/seasonal species are important herbage component of natural grazing lands, pasture and croplands. They are the only plants available even after the perennials are removed. Persistence to withstand pressures and re-appear once the favorable situations occur, make them highly resilient component of desert vegetation. Their life cycle strategy is also more suited to adverse temporal sequential stresses caused by climatic aberrations. Plasticity in phenological stages exhibited by ephemerals during variable grazing treatments not only provides adaptive edge to survive in harsh desertic conditions but also imparts sustenance to the whole grazing land ecosystem. By way of providing heterogeneity in species composition, ephemerals prolong the duration of grazing land use and also complements the nutritional needs of livestock. This aspect has helped to design conservation strategy of critically endangered Great Indian Bustard in its native landscape by way of provisioning of foraging material by just enabling buried ephemerals seeds to come up on surface through ploughing and then germinating during rains.

They contribute up to 500-600kg/ha dry matter without any management in natural conditions. Grown properly under managed conditions, their yield can be enhanced many folds. This can be achieved by providing moisture just before flowering so that vegetative phase is prolonged, thus capitalizing its ecological properties to further increase its yield to double or treble. Experiments are however needed to confirm whether these could be used as multicut fodder crop in sole or as intercrop. In view of rich ephemeral flora in the Indian desert, we are advantageously placed to select a few chosen species for testing their potential as future livestock feed either raw or as feed cake. Not merely a source of livestock feed, these grazing lands are also cradle of as many as 61 herbal ephemerals which are being used by people as traditional medicine; many of them having immense trade potential that can add to the kitty of local farmers. In the ecological management of mine spoiled lands, ephemerals as an adjunct to perennial species have proved their potential as a cheaper and faster rehabilitation material.


Read More Lupine Publishers Agriculture Journal Article: