Showing posts with label open access soil science journal. Show all posts

Tuesday, 7 January 2020

Lupine Publishers | Chemical Contaminants in Food Grains: The Burning Health Issues in Asian Countries


Lupine Publishers- Environmental and Soil Science Journal

Abstract


Food security is a high-priority issue for sustainable global development both quantitatively and qualitatively. Once pesticides are applied, residues may be found in soil, on plant, on harvested product, on application equipment, in water and irrigation canals, in pesticide storage area, on cloth of applicant. Short term poisoning effects like nausea, vomiting, headache, chest pain, eye, skin and throat irritation etc. and potential long-term health effect like allergies, cancer, nervous system damage, birth defects, reproductive problem have been reported in recent decades, adverse effects of unexpected contaminants on crop quality have threatened both food security and human health. Heavy metals, metalloids (e.g., Hg, As, Pb, Cd, and Cr) from pesticides and fertilizers can jeopardize human metabolomics, contributing to morbidity and even mortality. Those during crop production include soil nutrient depletion, water depletion, soil and water contamination, and pest resistance/outbreaks and the emergence of new pests and diseases.

Discussion

Growth in global population means that farmers must produce food for an estimated 9.1 billion people expected to inhabit the earth by 2050 [1]. Humans cultivate only about 150 of an estimated 50,000 edible plant species worldwide, with only 30 plant species comprising the vast majority of our diets. Just three of these (rice, maize and wheat) provide about 60% of the world’s food energy intake [2,3]. These plants are susceptible to 80,000 to 100,000 diseases caused by everything from viruses to bacteria, fungi, algae, and even other higher plants [4]. Again, Food plants have to compete with some 30,000 different species of weeds worldwide, of which at least 1800 species are capable of causing serious economic losses [5]. Globally, around 20-30% of agricultural produce is lost annually due to insect pests, diseases, weeds and rodents, viz, growth, harvest, and storage [1,6]. According to World Bank, South Asian countries are home to home to 33% of the world’s poor and economies have among the highest levels of public debt in the world [7]. Mean consumption of whole grains 38.4 g/day in between 1990 to 2010. Southeast Asian nations along with 2/3 Sub- Saharan African regions had the highest intakes. Overall, 23 of 187 countries had mean whole grain intake ≥2.5 (50g) servings/day, representing 335 million adults and 7.6% of the world adult population [8]. Southeast Asia is a region that produces high amounts of key food commodities and includes areas of divergent socio-economic status. The major grain crops produced in the region are rice and maize [9]. The potential sources for the contamination of grains are mostly environmentally based and include air, dust, soil, water, insects, rodents, birds, animals, microbes, humans, storage and shipping containers, handling and processing equipment [10]. The rates of destruction often are higher in less developed nations and they are now accounting for a quarter of the world’s pesticide use [5,11]. Therefore, judicious use of pesticides plays a major role in plant protection. Today’s more than 10,400 pesticides are approved worldwide. It has been reported that the consumption of pesticides accounts two million tons every year worldwide [12]. Interestingly, many pesticides still widely used in the USA, at the level of tens to hundreds of millions of pounds annually, have been banned or are being phased out in the EU, China and Brazil [13]. Pesticide residues reported in fruits, vegetables and grains of India [14], Nepal [15], Bangladesh [16], China [17] and Indonesia [18]. Farmers habitually apply fertilizers and hazardous insecticides in high quantities without assessing the actual field requirements due to inadequate knowledge [1,19]. Since pesticides are directly applied on crops, fruits, and vegetables in most agricultural applications, infants, children, and adults can be exposed to pesticides by the ingestion of those pesticide-contaminated foods [20-23]. Pesticides can exist in residential air by the evaporation of volatile and semivolatile pesticides, such as organochlorine pesticides, from crops and residential surface soil [24-27]. Soil is an important source for heavy metals (like mercury/cadmium) in crops and vegetables since the plants’ roots can absorb these pollutants from soil, and transfer them to seeds [28,29]. According Retamal-Salgado et al. 2017 cadmium (Cd) distribution in the different plant organs, more than 40% of Cd is absorbed and translocated to the aerial part of the plant (grain and straw), and it could be directly (grains) or indirectly (animals) ingested and negatively affect humans [30]. It accumulates in the liver and kidneys for more than 30 years and causes health problems. Toxicity of this metal involves kidney and skeletal organs and is largely the result of interactions between Cd and essential metals, such as calcium [31-35]. China feeds 22% of the world population with 7% of the worlds arable land. Sodango et al. 2018 reported that 20 million hectares (approximately 16.1%) of the total arable land in China is highly polluted with heavy metals, according to Ministry of Environmental Protection (MEP), China [36]. It is estimated that between 900,000 and 1,360,000 kg arsenic per year was introduced into Bangladesh soil through contaminated groundwater used for irrigation [37]. The use of sewage sludge for agricultural purposes can be limited by the potential content of heavy metals and toxic organic compounds that pose a threat to the environment [38]. Pajewska-Szmyt et al. 2019 reported that maternal exposure to heavy metals as Pb or Hg and persistent organic pollutants were associated with children neurodevelopment delay and also indirectly affects reproductive, respiratory, and endocrine system [39]. The use of pesticides has helped to increase rice yields but has also led to an increased pollution that presents a potential toxicity threat to the environment and public health [40]. Combined with outdated waste management technologies, there are potential health risks to farmers through occupational waste management practices, along with consumers through consumption of waste-contaminated products [41]. The WHO has estimated that more than three million farmers in developing countries are poisoned by agrochemicals each year [42]. In another study, WHO) and UN Environmental Program estimated that one to five million cases of pesticide poisoning occur among agricultural workers each year with about 20000 fatalities [43]. Skin injury, eye injury, headache, stomachache, and fever reported in cotton workers in southern Pakistan due to pesticide exposure [44]. Pesticide induced occupational hazards has been reported to many other similar studies in Nepal [45], China [46-48], India [49-51], Bangladesh [52], Sri Lanka [53], Myanmar [54] and Philippines [55]. The US Centre for Disease Control and Prevention confirmed more than 11,000 foodborne infections in the year 2013, with several agents like viruses, bacteria, toxins, parasites, metals, and other chemicals causing food contamination [56]. Widespread agricultural use of pesticides and home storage make them easily available for acts of self-harm in many rural households. Stability of organophosphorus pesticides are also important issue [57]. It was found that malathion was more unstable than dichlorvos and diazinon, there was an over 70% loss in 90 days even at -20 °C in coarsely chopped form [58]. It could be another reason for haphazard use of pesticides in the field and stored food commodities [59]. Around 600 million food borne illnesses and 420,000 deaths occur each year due to poor food handling practice. Such contaminants get access to contaminate food mainly due to food handler’s poor knowledge and negligence during handling activities [60,61]. Hassan et al. says increased prevalence of diabetes in South Asia may be related to the consumption of arsenic contaminated rice depending on its content in the rice and daily amount consumed [62]. Sabir et al. demonstarted that arsenite can bind covalently with sulfhydryl groups in insulin molecules and receptors, enzymes such as pyruvate dehydrogenase and alpha ketoglutarate dehydrogenase, and glucose transporters (GLU-T), which may result in insulin resistance [63]. According to Kumar et al. 50%-60% cereal grains can be lost during the storage stage due only to the lack of technical inefficiency. Use of scientific storage methods can reduce these losses to as low as 1%-2% [64]. Factors like increasing climatic variability, extreme weather events, and rising temperatures pose new challenges for ensuring food and nutrition security in Asian region. The South Asian region is one of the least integrated regions according to Washington based-IFPRI [65]. Agriculturally beneficial microorganisms may also contribute directly (i.e., biological N2 fixation, P solubilization, and phytohormone production, etc.) or indirectly (i.e., antimicrobial compounds biosynthesis and elicitation of induced systemic resistance, etc.) to crop improvement and fertilizers efficiency [66]. Overuse of chemical fertilizers and pesticides have effects on the soil organisms that are similar to human overuse of antibiotics. Indiscriminate use of chemicals might work for a few years, but after a while, there aren’t enough beneficial soil organisms to hold onto the nutrients [67]. Also, resistance to certain pesticides against brown planthopper (BPH), Nilaparvata lugens, and the white-backed planthoppers (WBPH), Sogatella furcifera reported in Asian countries has been reported [68-72]. Also, the higher exposure of crop plants to heavy metal stress reduces growth and yield and affect the sustainability of agricultural production [73]. Cadmium (Cd) is a well-known metal imposing threats to human health, and it can be accumulated in polished rice over the permitted range of 0.2mg kg1 [74]. It leads to reduction in the plant productivities as well by inhibiting their growth, photosynthesis, pigments, nutrient uptake, germination, electron transport chain [75]. Applications of phosphorusbased fertilizers improve the soil fertility and agriculture yield but at the same time concerns over a number of factors that lead to environmental damage need to be addressed properly [76]. Easy availability of pesticides has another interesting but pathetic outcome. approximately 110,000 pesticide self-poisoning deaths each year from 2010 to 2014, comprising some 14% of all global suicides [77]. According to Serrano-Medina et al. higher rates of suicide committed in areas with intensive use of pesticides compared to areas with less use of pesticides [78]. In Bangladesh, selfpoisoning by pesticide is responsible for about 40% of poisoning cases admitted to hospital and 8-10% of overall mortality in medical wards [79]. At the Philippine General Hospital in Metro Manila, Philippines (2000- 2001), recorded pesticide poisoning cases showed that more than 80% were intentional in nature [80]. Public concern about the adverse environmental and human health impacts of organochlorine contaminants led to strict regulations on their use in developed nations since 1940 [81]. Nevertheless, DDT and several other organochlorine insecticides are still being used for agriculture and public health programs in developing countries in Asia and the South Pacific [82-86]. As a consequence, humans in this region are exposed to greater dietary levels of organochlorines (Figure 1).
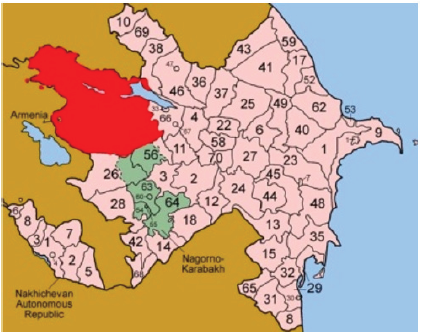
Figure 1: Asian Continent with subregions (Source: Wikipedia)
lupinepublishers-openaccess-environmental-soil-science-journal

Recommendations

Around 600 million food borne illnesses and 420,000 deaths occur each year due to poor food handling practice. Such contaminants get access to contaminate food mainly due to food handler’s poor knowledge and negligence during handling activities [87,88]. Accordingly, alternative methods for exposure and risk assessment have to be developed, which vary from the use of expert opinion and pre-marketing models to the use of combination of data from the literature, measurements, and expert opinion [89]. Many studies are there to overcome fertilizer/pesticide induced health effects. Rastogi et al. reported use of silicone nanoparticles can provide green and eco-friendly alternatives to various chemical fertilizers without harming nature [90]. It has been reported that selenium (Se) application decreases Cd uptake [75]. In similar studies, selenium, copper, zinc oxide and many other metallic nanoparticles [91-97] have been studied in food processing, packaging and preservation against phytopathogens and rodents. The washing with water or soaking in solutions of salt and some chemicals e.g. chlorine, chlorine dioxide, hydrogen peroxide, ozone, acetic acid, hydroxy peracetic acid, iprodione and detergents are reported to be highly effective in reducing the level of pesticides [98]. Various foodprocessing operations include sorting, trimming, cleaning, cooking, baking, frying, roasting, flaking, and extrusion that have variable effects on mycotoxins [99]. Cooking rice in excess water efficiently reduces the amount of arsenic (As) in the cooked grain [100].

For more Lupine Publishers Open Access Journals Please visit our website:
For more Open Access Environment Journal articles Please Click Here:
To Know More About Open Access Publishers Please Click on Lupine Publishers

Follow on Twitter   :  https://twitter.com/lupine_online

Tuesday, 26 November 2019

Lupine Publishers | Selected Methods of Spatial Analysis of Soils of Azerbaijan

Lupine Publishers- Environmental and Soil Science Journal

Spatial analysis in GIS Wednesday is based on complex techniques, the results of which depend on the raw data. One of the fundamentals of spatial analysis techniques based on digital hypsometric model is the development of maps of the angles. She gained widespread use, from morphogenetic and geologicalengineering perspective to the agrarian and territorial planning.

Progress of Research and Discussion of Materials

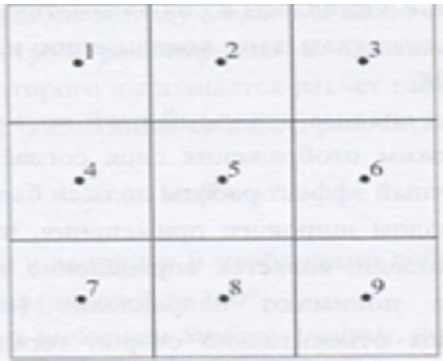
Program Arc Map provides the ability to quickly prepare this type of cards based on raster model hypsometric territory. To calculate the slope of a surface that is specific to a particular screen, used values of absolute height, raised eight surrounding screens (Figure 1). The calculated values of the two parameters (ɑ and (b)), proportional average slant of slope (respectively on the x and y axis) according to the following formulae:
Figure 1.
lupinepublishers-openaccess-journal-environmental-soil-sciences
ɑ = (h3+2h6+h9-h1-2h4 - (h)7 )/8L (1)

(b)=(h1+2h2+h3-h7-2h8 - (h)9 )/8L
Where is:
(h)1 = the absolute height of the surface of the territory in (i) -OM image according to (Figure 1).
L = raster measurement.
The angle of the slope, plant in the central point is cal
tan ɑ= √a2 + b2 (2).
a) In the menu Spatial Analyst pick Surfase Analysis, then Slopethat will lead to opening the window method.
b) With list boxes Input surface Choose created a digital model of the hypsometric of Azerbaijan.
c) The main unit can be marked graphs slope measurement slope on the resultant map-in variant degrees ( Degree) or as a percentage (option) Percent
d) Graphs Z Factor and Output cell size perform the same role as in the Hillshade. Leave them automatic size.
e) In the graph Output raster point localization and name of the source file, then- OK.
f) After completion of the analysis of the source layer appears in the map image.
g) Change the layer display mode according to the technique described previously.
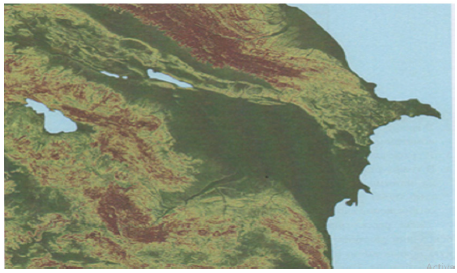
h) The final effect should be similar to (Figure 2).
i) The following method of broad application that is based on digital hypsometric model is the definition of exposure [1].
Under slope Exposition, understand the direction (azimuth) slope steepness of most to the sides of the horizon.
Figure 2.Indexation Scheme of high-altitude points to calculate slope angles.
lupinepublishers-openaccess-journal-environmental-soil-sciences
This option is very important for those kinds of analysis that takes into account the difference of thermal balance of the northern and southern slopes.
This is the initial value for aspects such as the time of occurrence of snow cover duration of vegetation period etc. The method of calculation is similar to the method Slope . It also used high-altitude data from screens placed in the immediate vicinity of the Central screen, for which the calculation of parameters (a) and (b) (in accordance with identical formulas) [2].
Exposition of slopeis calculated as:
tan ß=a/b (3)
If (b) positively, the largest Add 180°, that allows to take into account the magnitude of the azimuth from 0 to 360°.
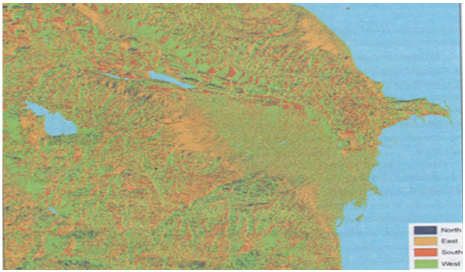
a) In menu Spatial Analyst choose a Surface Analysis, then Aspect-method dialog box appears (Figure 3)
Figure 3: Angular slopes map developed in accordance with method S lope based on a digital model of Azerbaijan hypsometric.
lupinepublishers-openaccess-journal-environmental-soil-sciences
b) In box Input surface traditionally make the filename digitally hypsometric model.
c) In box Output cell size leave unattended.
In box Output raster denote localization and name of the source file, click OK to start following their completion, payments to the image will be added effective map. After you change the display card is similar to (Figure 3). Next, consider the way to an integrated spatial analysis based on raster maps. For example, suppose you want to select a specific localization hypothetical potential investments on the territory of Azerbaijan. Investor demands that the investing territory meets certain conditions. First, the angle of the slopes in the territory’s investment should not exceed 10°. Secondly, the investment should be within the absolute height of surface from 100 to 500 mnm. Using GIS and digital hypsometric model of Azerbaijan (with derived layers), the definition of localizations of this investment takes a few minutes. In menu Spatial Analyst toolbar Select position Raster Calculator. A dialog box appears, represented in the left part of the window, in the Layers highlighted all raster layers project. With right sides are mathematical logical operators that can be used for entering formulas. The formulas are based on arithmetic operators, and the results have a numeric expression. For example, if you want to double increase digital hypsometric model, it is possible to formulate a simple expression: [CGM]. where instead of CGM, you must enter the name of the selected raster layer surface model. As a result of this operation received a raster map, where each point in discrete space is assigned a numerical value, which corresponds to doubling the height of the territory. Such arithmetic operations can be applied to other sectors. For example, having a layer of embossed field precipitation, as well as layer with spatial distribution of filtration coefficient, obtained by multiplying the two layers you can obtain the spatial distribution of effective infiltration of precipitation. Often also used the differencing method. In this way, create a differential maps that document the temporarily-spatial variability of the investigated phenomenon. For example, as a result of the seizure of average precipitation from the actual over the past two years, it is possible to define the territory increases and regression of this phenomenon [4-6].
Use this type of expression to identify the territory within Azerbaijan, which satisfies the conditions of investra. First define the territory where the inclination does not exceed slopes 100.
This requires the formulation of the next task
[Slope] < = 10. (4)
Where on the graph Slope you must submit the name of a bitmap layer with angles of inclination of slopes.
Formulation of issues using Windows Raster Calculator is simple enough:
i. In the graph Layers Select the name of the layer with the angles of inclination of slopes. Note that added layer automatically enclosed in quotation marks.
ii. Of the symbols of the operators choose < =. This results in adding this element to the expression.
Citation: RAE Aliyev ZH. Selected Methods of Spatial Analysis of Soils of Azerbaijan. Open Acc J Envi Soi Sci 1(1)- 2018. OAJESS.MS.ID.000103. 18 iii. Using digital signs in a window or on the keyboard, type 10 in the end of the expression.
iv. The formula is ready, you can go to to do so. Evaluate.
Upon completion of the calculations in the working area of the project will add a new layer using the program Calculation . Layer is only with greatness and 0 1.
Screens marked digital 1, satisfy the conditions of maximum slope slopes up to 10 largest° . Now you must select the area that meets the requirements of investra for its absolute height. To do this, construct the following expression (5) [7-10]:
[CGM] > = 100 and [CGM] < = 500 (5)
On site CGM enter the name of a raster layer with digital hypsometric model territory. For formulating expressions use window Raster Calculator .
a) In Windows Raster Calculator Select layer with digital hypsometric model of Azerbaijani territory in the graph Layers.
b) press the key with the operator > =
c) Enter the value 100
d) Push And
e) Again click on the layer name in the CGM graph Layers.
f) Push the button with the < = operator
g) Enter the value 500
h) Check the correctness of the formula and select Evaluate.
The result of the calculations is a raster layer named program Calculation . 2. similar to the previous layer here showing screens marked cifroj1 that identify the territory, where high-rise relevant criteria. now you must connect both layers to define the territory corresponding to two requirements-surface height and tilt. Use the method the Raster Calculator [11-12].
a) press twice on the layer Calculation in the graph Layers.
b) Select the = operator
c) Enter the value 1.
d) Choose the logical operator And
e) twice click on layer Calculation2.
f) Select the = operator
g) Enter the value 1.
h) The final expression must be of the form:
[Calculation] = 1 & [Calculation2] = 1
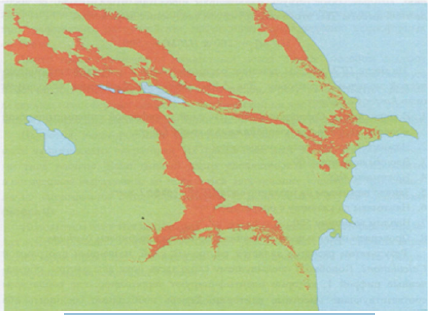
i) Click on Evaluate. In the working area will be added a new layer with the designated (red) territory, which satisfies the requirements of the investor (Figure 4) [13-15].
Figure 4: Map of exposures of the slopes, developed based on digital hypsometric put Azerbaijan.
lupinepublishers-openaccess-journal-environmental-soil-sciences
The resulting image points to a very extensive array, located in the foothill zone of Azerbaijan. It is clear that in such a large territory does not satisfy any investor to potential localization object. In this regard, you can narrow the boundary parameters of each criterion. For example, the choice of the territory where the inclination does not exceed 1 degree. In the analysis process can also take into account additional criteria, such as location, investment plot at a distance of not less than 500 m from the nearest coastline and 1000 m from the urban areas (Figure 5). The possibilities are endless and depend solely on the needs of the user of GIS and spatial information availability [15-18].
Figure 5: Result of the spatial analysis to define the territory of Azerbaijan, the relevant requirements of the investor.
lupinepublishers-openaccess-journal-environmental-soil-sciences


For more Lupine Publishers Open Access Journals Please visit our website:
For more Open Access Environment Journal articles Please Click Here:
To Know More About Open Access Publishers Please Click on Lupine Publishers

Monday, 25 November 2019

Lupine Publishers | The Role of Technology Transfer in Supporting Climate Change Adaptation the Avenue to Disaster Risk Reduction in the Arid and Semiarid Zones

Abstract

No doubt that climatic development and related changes are not new, bur a worldwide phenomenon that never respected national boundaries. Their severe consequences and negative impacts have touched most world countries; melting glaciers, deadly typhoons, catastrophic hurricanes, brutal tornadoes, torrential rains, harsh drought, continuous heat waves heavier precipitation, frost, fluctuation of annual average temperatures, changing duration, shifting seasons and disastrous floods are just a few of the many forms of climate change consequences. There is no single world country that was not seriously devastated by economic, health, social and or environmental complications. All these shattering consequences have urged most countries around the globe to find mitigation measures, adaptation techniques and methods and put this goal as a top priority of international conferences and symposiums at the local, regional and international levels. The notion “Act locally and think globally” has become the main slogan for a collective action to ease the consequences of the climate change. Needless to say, that huge efforts in awareness raising, education, training, technology transfer and information use can make a big difference, which have immense potentials to mitigate the implications of climate change. It is in fact the only hope to face the negative impacts of climate change.

Introduction

Climate change, as mentioned earlier, is an intricate global environmental dilemma, which is unpredictable, controversial and a never-ending predicament. It affects every single person on earth and creature living on our planet. The fact that cannot be denied is that the intricacy of the climate change dilemma lies in the absent of appropriate understanding and/or justification of the reasons behind its complications and developments. Hence, its worldwide excessive impact, unpredictability, accelerating trends, tremendous extreme influence, continuity and increasing complexity make the situation even worse.

For decades, climate change implications have been affecting not only agriculture, but also the economy, tourism, health, as well as social and environmental aspects. Definitely, climate change implications and their accelerating pace, combined with increased global population and income growth will affect the overall food situation [1]. Among the negative influence of climate change on agriculture is the low yield and the bad quality of agricultural products, which is obvious on all crops. Nobody doubt the fact that the agricultural sector is the most affected by climate change implications among all other sectors. Indeed, the sector is facing enormous challenges, where extreme weather conditions and events threaten the existence of humanity. The existence of new insects, diseases and weeds, combined with shifting seasons and shortening the growing seasons are among the most serious upshots that we are witnessing daily. Within this context, it is obvious that technology transfer is one of the best solutions to the problem, where a growing recognition of its potential role as a major response is increasing. With this fact agrees [2], where indicated that mitigating climate change requires information, education, and technology transfer. It is urgently needed by resource scarce smallholders, who are the most affected by climate change, yet, they contribute very little to the problem.
It is recognized worldwide that adaptation and mitigation are the main two major areas needed by farmers to mitigate the impact. For sure, diminishing the global climate change impacts necessitate vast scientific knowledge, massive financial resources, enormous physical capacities, huge logistical infrastructure, as well as big technical and human resources. Today, more than ever before, immense efforts and substantial awareness and attitude change are needed urgently not only for Developing Countries but Developed Countries as well. Hence, serious collective efforts are needed by policy and decision makers, scientists of all fields, academia, farm owners and farmers as well as all ordinary citizens. Although huge efforts were made by scientists, but many still believe that there is no quick and instant solution to the problem and no universal remedy or a silver bullet that can stop, freeze, limit or at least decrease the climate change impacts. What can ease the problem is simply enforcing rules and regulations, policies and recommendations parallel with reliance on technology transfer. Definitely, determination and dedication are also of paramount importance when financial and technical resources are available. Certainly, reliance on generous regional and international support and technical assistance are of great importance.

Worldwide Shocking Information

According to the World Bank [3], Asia is the most vulnerable continent on earth. The report indicated that in 2009, over 60% of Asian countries were affected by property damage from severe natural disasters. The report also pointed out that since 1997, over 82% of all lives lost in disasters were in Asian countries. These countries sustained the heaviest mortality rate from catastrophic events related to climate change. In Asia, also six out of ten of the most vulnerable cities in terms of exposed population. No doubt that the magnitude of the problem, specifically in Asian countries, is immeasurable. For an example, if no measures are considered in Bangladesh, the expected damage from a single severe cyclone increase fivefold to reach $9 billion by 2050. The same applies for Vietnam’s Mekong River Delta, where the sea level will rise 30 cm by 2050. For an example, a reduction of rice production by 13 percent will occur when an increased deluge and salinity happen, when over 300 thousand ha will be out of business. China, Vietnam, Laos, The Philippines, Bangladesh, and many other countries are no exception. About 130 million people are living along the coast in low lying islands in China and facing unpredictable destiny due to the enormous threat of cyclones and typhoons. 40 million in Vietnam are expected to face the same danger. Generally speaking, the poorest households are the most affected by the climate change disasters [3]. According to the same source, 12 billion dollars were the cost of the damaged lands, cities, river banks, etc. in the last three decades alone, in the Middle East, and specifically in the Arab world, temperatures are projected to rise 3-4 degrees Celsius by the end on this century. The warmest year since 1800’s was 2010-11, when heat wave records began [4] Indicated that heat waves with maximum temperatures are very likely to become more frequent. Drier and hotter conditions will cause fires to increase in scrub and forest in Maghreb and eastern Mediterranean areas 19 countries in the Middle east, including five Arab countries, set a new high record. for an example, the temperature reached 53.5 degrees in Kuwait, but expected to increase to 75 percent by 2050. This shows that three out of four people might be affected in a way or another in the Arab world [5] other forms of climate change will include, but not limited to, an increase in severe weather events, such as droughts and floods and greater seasonal temperature variability.

The report, which was produced in partnership with the League of Arab States (LAS), warns that climate change implications pose a big threat and a big challenge to the development goals of the millennium. Jordan, for an example, the second poor country in the world in terms of water resources will face food insecurity and water insecurity due to sharp rainfall decrease with temperature increase compounded with a growing population. According to Dorte Verner, the Climate Change Coordinator for the Middle East and North Africa at the World Bank, who gave an alarming signal to the situation that the whole region will face an increased demands for fresh water by 16-50% by 2050 and a 10% decrease in rainfalls and the indicated that between 1980 and 2008 over 37 million Arab people were affected and more than 20 billion dollars were lost due to natural disasters [4]. Overt 55 million people are affected annually by climate related disasters and the estimated damage was $789 billion dollars. In Asia, about the same number of people are affected annually by floods (57 million people), where around 86% of the reported damages are climate‐related disasters. At the global level, 142 million people are affected annually by natural disasters, of which 139 million people were affected by climate related disasters. It is obvious from the facts mentioned above that Asia and the Pacific, are the most affected by climate related disasters. 70% of these countries are vulnerable to climate change and disasters according to the UNU. Countries such as Vanuatu, Tonga, Philippines, Solomon Islands, Bangladesh, Timor-Leste, and Cambodia are the most vulnerable countries in Asia and the Pacific. The fact that cannot be denied is that agriculture, fisheries and forestry are the main sectors affected by climate related disasters, where 60% of the people depend largely on these sectors for find living. The real cost of the damage has sky-rocketing numbers. Between 600 billion to 1.5 trillion USD annually are needed to help these countries. By 2025, The bank estimated that floods in these countries will be threatening between 300 and 410 million people< In some Pacific Islands, it is even much higher, 245-341 million people.

The Scary Status

According to a report published by Karas J [6], it was pointed out that the Mediterranean basin is not immune to the climate change implications. Most North African and Eastern Mediterranean countries are the most to suffer from serious impacts of the climate change combined with the desertification problems. At the same time, the annual precipitation is projected to decline by 10-40%. Temperatures could rise by over 4°C by the beginning of the next century. On the other hand, the report also indicated that the Mediterranean Sea levels could rise by 1 m by 2100 due to melting glaciers and oceans’ expansion. As a result, rivers would become saltier. Egypt, Italy and Greece could have the worst consequences, specifically the Nile Delta, Venice and Thessaloniki respectively, Sand storms and reduction in vegetation cover in northern Sahara and Peri desert region will be increasing soil erosion, hence most Arab countries will have to deal with not traditional environmental threats, but severe, complicated, continuous and spreading complications. Water scarcity will be so severe to the extent that countries will fight each other over water. Some other problems, such as biodiversity loss, desertification, pollution of marine and coastal areas, air pollution and many others will be very common.

The Persian Gulf region is no exception. All six countries of the council (GCC); Saudi Arabia, United Arab Emirates (UAE), Bahrain, Kuwait, Oman and Qatar are subject to suffer significant ramifications from global warming. Bahrain and Qatar, where most population live less than 5 meters above sea level are especially susceptible to inland flooding due to the small land mass that is in danger of being inundated as sea levels rise, Saudi Arabia, Oman and the UAE are also rated “highly” vulnerable. Other countries of the Middle East like Yemen, Jordan, Lebanon, Libya and Tunisia are ranked among “extremely” vulnerable countries and score “high” on the CCI index [7].

Water Crisis, Rising Temperatures, etc.

Most of the Arid and Semiarid Zones are suffering from a chronic and even disastrous water problem. In Jordan, for an example, the average per capita use is lower than any other country in the world. It reaches 145 cubic meters per capita per year, a very low number by all standards, if we take into consideration that the United Nations classified countries with less than 500 cubic meters per person per year as having an “absolute scarcity” of water [8]. Karas J [6] regarding the increase of water shortages and decline in water quality, pointed out that the first climate change impacts will be felt first in the Mediterranean water resource system, where reductions in water availability would hit southern Mediterranean countries the hardest. Countries like Morocco, Algeria, Tunisia, Libya, Egypt, Syria, Malta and the Lebanon will be the most affected by the shortages and some water supplies could become unusable due to salt penetration into rivers and coastal aquifers as sea level rises combined with water pollution which become more concentrated with reductions in river flow, hence causing major health hazard in the region. Karas J [6] also stated that across the Mediterranean region, yields of cereals and other crops could decrease substantially due to the increased frequency of drought, land losses through desertification, increased competition for water and prevalence of pests and diseases. On the other hand, by 2050 or earlier, North Africa and the Near East could witness the disappearance of most of the steppe rangeland and its transformation to desert. Food security could be also threatened by the sharp fall in production, world prices for many commodities such as maize, wheat, soybean and poultry could rise significantly as a result of global climate changes. Livestock production would suffer due to deterioration in the quality of rangeland. The magnitude is so immense in most countries to the extent that Egypt, for example, might lose agricultural production over an area extending 20 km inland. In Tunisia, rising temperatures could lead to the disappearance of nationally important fisheries, the loss of all food plants and breeding waterfowl. The reductions in food and fiber will cause malnutrition and hunger for millions of people. Water shortages as well as damaged infrastructures would increase the risk of cholera, malaria and dysentery, while the combination of heat and pollution would increase the risk of respiratory illnesses, extent of infectious diseases, dengue fever, while extreme weather events could increase death and injury rates. Several valuable ecosystems could be lost, wetland area will face the threat of drying out. Other countries are not immune, where a 3 to 4°C rise in temperatures will cause up to 85% of wetland sites in southern Europe to disappear.

Not only Mediterranean countries loose substantially in economic terms, the human and economic costs of desertification increase would be tremendous. The annual costs of desertification for Tunisia and Spain alone are $100 and $200 million respectively. The magnitude of the climate change from the economic point of view is so immense to the extent that another World Bank study predicted that $75-100 billion a year, is the amount needed to adapt to an approximately 2°C warmer world by 2050. Definitely, Asian and Pacific countries will bear most of the cost. No doubt that those poorer developing countries are affected excessively, and more vulnerable than other countries to climate change implications, and they are greatly devastated from the impacts of natural disasters. This is due to a number of reasons. Probably their reliance on climate sensitive sectors, particularly agriculture, their poor infrastructure, geographic exposure to disasters, low incomes and most importantly, their inability to stand firmly against disasters because of lack of expertise, are the most serious factors.
Another frightening number was reported by IFRC and CRED [9]. It indicated that, between 1990 -1999, around 200 climate related disasters strike per year. Ten years later, around 350 climate related disasters on average per year happened. This is an increase of about 75 percent from previous decade. During these years, and according to the Asian Development Bank [10] the climate related disasters affected more than 200 million people in Asian and the Pacific countries, which compose about 90 percent of world population affected by disasters. Within two years, and specifically during 2010-2011, around 42 million people were displaced from extreme weather events. According to Nelson G et al. [1], agriculture is the most vulnerable sector to climate change. According to the same source, in 2005, over 50 percent of the economically active population in developing countries, which is close to 2.5 billion people, relied on agriculture as the main source for their livelihoods. Today, this number has increased dramatically, where three out of four people of the world’s poor live in rural areas. The magnitude is so immense to the extent that at least $7 billion in additional funds annually are needed to finance investments in research, rural infrastructure and irrigation, to offset the negative effects of climate change on human wellbeing. More bad news of the climate change implications. Madhava S and Durwood Z [11], for an example, believe that Developing Countries will need about $200 billion annually by 2030 to bring about a 25 percent reduction in global greenhouse gas emissions. No doubts that the lives of the poorest and most venerable people are the most to be affected by the climate change implications.

Severe Consequences

Since climate change is a worldwide phenomenon, it is believed that most world countries will suffer in a way or another. At the global level, the magnitude of the effect is various and immense to the extent that an increase of just 2°C in the average temperature will reduce world GDP by about 1 % as Stern [12] predicted. This is a huge impact if we take into considerations the trillions of dollars around the world that are circulating every year. Another prediction of how immense the climate change is [13] stated, agreed and supported the notion that the impact of the climate change is substantial. For an example, India and Africa will face reductions of agricultural output by 30 percent or more. As Nelson G et al. [1] pointed out, agriculture, is extremely vulnerable to climate change [1]. They stated that in 2005, over half of the population in Developing Countries, which was estimated at 2.5 billion, relied on agriculture for their livelihoods. Nowadays, according to the World Bank [14], around 75 percent of world’s poor live in rural areas and they are the most affected. According to a Food Policy Report, agriculture and human wellbeing will be severely affected by one or more of the following climate change implications; yield reduction, price increase, decline of meat consumption, imbalance of supply and demand, declining calorie availability, higher feed prices for livestock, increase malnutrition and lower investments. As a result, increase in death rates, unemployment will soar, and social instability will be in jeopardy. The agricultural sector in particular will be subject to some or all of the following implications due to the climate change; appearance of new diseases, insects or weeds not known before in the area, shortening growing seasons, not completely ripen veggies or fruits with less vitamins, minerals or other crucial ingredients.

Developing countries, as most researchers and analysts predict, are the most to be affected, and specifically, South Asia, which will be particularly hard hit by climate change implications. The fact that cannot be denied is that the yield for the most important crops will decline sharply due to the shifting seasons, rainfall variations, shortening of seasons, higher temperatures, frequent frost and weed and pest proliferation. In light of all these complex developments that the world is facing, especially, Developing Countries, scientists have no doubts that Developing Countries are more vulnerable to climate change, and they will have less suitable climates for agricultural practices. Most of these countries depend largely on agriculture, they lack proper and adequate financial resources, have weak infrastructure to respond properly to increased variability and most importantly, they are facing all the implications of the climate change alone. Definitely, rainfed areas as well as irrigated regions will have varying effects on yields, specifically irrigated crops in South Asia, which will experience large declines. It is well known that when yields of the most important agricultural crops (rice, wheat soybeans, maize, etc.) are affected, prices increase. As a result, higher feed prices will result in higher meat prices, hence causing the reduction of the growth in meat consumption. Among the consequences that the sector is facing is the higher temperatures, which eventually reduce yields of most crops while encouraging pest and weed proliferation. The fact that the changes in precipitation patterns, despite few gains in some crops in some regions of the world, will show an increase of the likelihood of short run crop failures and long-run production will decline. Most researchers, analysts and environmentalists believe that the overall impact of climate change on agriculture is expected to be negative, and as a result, global food security is threatened.
The overall impact of climate change is unpredictable; however, malnutrition will be a case that most developing countries will have to face. According to Nelson G et al. [1] the 2050 will witness lower calorie availability than in the no climate change scenario. The decline will be even lower to 2000 levels throughout the developing world. By the same year, the decline in calorie availability will increase child malnutrition by at least 20 percent comparing to a world with no climate change impact. Based on the mentioned facts, the climate change will eliminate a great deal of the improvement in child malnourishment levels that would occur with no climate change. Thus, huge amounts of financial resources are needed to cope with the various negative impact of the climate change. For an example, the large agricultural productivity investments of about USD 7.1-7.3 billion are urgently needed more than ever before to raise calorie consumption enough to offset the negative impacts of climate change on the health and well-being of children [1].

The Solution Technology Transfer Can Make the Difference

Certainly, technology transfer will never be able to solve the whole problem of the climate change implications, but definitely it can make a big difference. There are a number of recommendations that were suggested by the Food Policy Report, presented by IFRPI [1] which give a high concern for a number of measures to combat the negative impact of the climate change. Technology transfer was among the main parts of the recommendations. The group of scientists and scholars gave technology transfer a crucial role in the adaptation process. They include reviving national research and extension programs in each country. The recommendations call for heavy investments in laboratory scientists and infrastructure as well as partnerships with other national and international centers. The important aspect in the recommendations urge for a strong collaboration with local farmers, traders, input suppliers, consumer groups and other stakeholders as an essential and effective measures for the development and dissemination of appropriate, cost-effective techniques that will help strengthen communication among all involved groups (scientists, extension agents, farmers, etc. to meet the challenges of climate change.

Another vital recommendation of the report calls for agricultural adaptation as a key agenda point in international climate meetings, conferences and symposiums. This should allow governments and other organizations to advance proposals for practical actions on adaptation in agriculture. The report also advocates for the recognition of enhanced food security as a major partner of climate change adaptation. Needless to say, that climate change will pose huge challenges to food security efforts and any activity in the direction of supporting agricultural adaptation will definitely enhance food security. The increased food security measures will assist the rural poor with the needed resources that will help them adapt to climate change. Supporting communitybased adaptation strategies are also of great importance. The need is urgent for national and international development agencies to ensure that all financial, technical as well as capacity-building measures target local communities. Community participation in the national adaptation planning processes is a must. Community-based adaptation strategies can make all the difference in assisting rural communities strengthen their capacities to cope with disasters. Such groups are encouraged to diversify their livelihoods, improve land-management skills, coordinate with all involved partners and fully adapt national policies and strategies.

Another crucial factor that must be considered is the increase of funding for adaptation programs. It is estimated, according to the same report, that at least seven billion dollars are needed per year. Another seven billion dollars per year are also required to finance rural infrastructure, research and irrigation systems to offset the negative implications of climate change on human wellbeing. Extension programs can play a strategic role in information sharing through the transfer of new technologies and techniques, capacity building, teaching improved management systems; facilitate cooperation and interaction and encouraging the establishment of farmers’ networks. Specific services to mitigate climate change should include, but not limited to, disseminating local cultivars of drought-resistant crop varieties, improve global data collection, dissemination, and their analysis. Any global efforts to collect and disseminate data among all involved parties must be strengthened. The fact that cannot be denied is that successful development and the effective diffusion of the latest technologies in agriculture will shape the way farmers mitigate and adapt to climate change. Certainly, regular and continuous observations of unusual events are of paramount importance. They must be recorded, analyzed, disseminated and considered. If technology transfer is to be successful, then it must meet local needs and priorities. Willingness of the people to understand the new developments, act, make the desired change needed and create a difference are important to consider. Without doubt, when priorities are set, economic and physical capabilities are convened, and social and psychological conditions are regarded, then the impact of technology transfer can be doubled.
In reality, and in order to speed TT, the six factors (categories); economic social, environmental, political, perception and attitudes, and regulatory factors are all of immense importance. None of the above factors are less or more important than the others and neither can be ignored nor eliminated. Funds are needed to support education, Research and Development (R&D), extension and purchase of technologies. On the other hand, social factors are prerequisite for a successful technology transfer process. This can speed, slow and even stop the process the more a nation is open to the world, the faster the technology transfer can be disseminated, especially if they don’t stand against the culture, norms and traditions. Political aspects are seen and noticed in faster TT. Completely unwanted results might be seen if they are ignored [15]. Meeting the needs and priorities of the local people must have high level of acceptance, active participation as well as strong willingness to adopt, otherwise all the efforts are in jeopardy.

Concluding remarks

a. Huge financial support, social participation and interaction, political interference, environmental awareness, strong involvement by policy responses as well as a new set of policy instruments for decision making are needed more than ever before. All these and many others are needed to improve our disaster risk reduction capacity
b. Effective partnership between research centers and technology seekers is a must. The three pillars; farmers, extension agents and researchers must closely work to test and promote new crop varieties, as well as to teach management measures [2].
c. A major strategic element in supporting agriculture’s role is information. The three pillars of mitigation are information, education, and technology transfer.
d. Agricultural extension in its forms; public and private, as well as advisory services can play a significant role in providing farmers with the needed information, education and technologies, on how to cope with climate change through adaptation and mitigation measures.
e. Extension systems can help farmers deal with climate change through adaptation and contingency measures that deal with what cannot be prevented.
f. Extension systems can assist farmers and preparing them for greater climate variability and uncertainty, especially in providing advice on how to deal with new insects, weeds and diseases, dealing with droughts and avoiding floods.
g. Extension staff can help farmers with knowledge, proper practices and management systems that are resilient to climate change implications such as no till (Zero Tillage), sequential cropping, intercropping, etc.


For more Lupine Publishers Open Access Journals Please visit our website:
For more Open Access Environment Journal articles Please Click Here:
To Know More About Open Access Publishers Please Click on Lupine Publishers

Follow on Twitter   :  https://twitter.com/lupine_online

Monday, 21 October 2019

The Most Perfect Ecosystem: The Qanat Karez Salt Leaching Oasis of The Ancient Silk Road, As the Model of Aquaculture and Chemical Engineering to Transform Our Present-Day Agriculture and Climate Temperature


Lupine Publishers- Environmental and Soil Science Journal


Abstract

More than 150,000 Gallerias, Qanat Karez sweet water systems, including more than 200,000 kilo meters of tunnels still exist in the Middle East, Central Asia and Mediterranean basins. Since the Islamic agricultural revolution which took control of these water sources, they are operated inefficiently losing uncontrolled quantities of water. The original ancient design was to direct water to arid zone of sabkha basins in order to leach salt deposits by leaching, (you have used leaching twice) recrystallizing and precipitating the salts as pure thick strata S of salt crust. The tunnels are used today only for domestic and local agricultural water supply. The engineering and construction of these systems involved extremely heavy investment, in difficult desert conditions. The human cost of building the tunnels and boreholes could only have been justified by the value of the salt production resulting from the irrigation and flooding mechanisms. This forgotten technology is no longer in use and the misunderstanding has caused misuse and inefficiency Many communities still rely on the ancient Qanat.

Introduction

Modern no-tilling arable field cultivation has many advantages. IT IS efficient, saves water, and energy, and results in a better use of nutrient fertilizers. Ploughing and furrowing topsoil today, is considered to be soil destructive. Opening the soil to bacteria and fungus requires insect acids and fertilizers which is also problematic. Most of the available water, for agriculture fields estimated to be at 90% of spate irrigation, is lost to evaporation. So how and why was it ever Invented?. The answer perhaps, is that this familiar global tilling, ploughing, technology used today by farmers, invented by Islam, was actually developed in ancient Persia for a completely different purpose: the leaching of pure salt crust from saline Sabkha wetland alluvial soil, produced the basic commodity, common salt. The salt leaching fields of the ancient Qanats, were inadvertently adopted in the 9th century AD to serve a growing population which Islam’s Jafari people reorganized. The thriving Silk Road salt supply route began experiencing competition from the renaissance of the cheaper natural coastal Sabkha lagoons. Meers and fens which were slowly exposed by lower eustatic sea levels and the Qanat Karez salt leaching lost their importance. The Islamic agricultural revolution has been considered by historians to be one of the critical periods of technological advance particularly in irrigation and crop planting, including farming of new vegetable types. The agronomic literature of the time, with major books by Ibn Bassal and Abu l-Khayr al-Ishbili, demonstrate the extensive diffusion of useful plants to Medieval Spain (al Andalus). The growth in Islamic scientific knowledge of agriculture and horticulture. New Islamic crop farming needed less sophisticated equipment and water lifting devices, less investment, and less experience and knowledge. It simply needed much more water and flat arable land. Both these last two items were close at hand since the surrounding desert community field irrigation systems previously used for “farming” leached salt were now standing idle. Due to a renaissance of the solar salt industries along the China grand canal wetlands and Mediterranean and North Sea coasts, the once critical supplies of the Silk Road could no longer compete with the old Sabkha coastal lagoons and inundated wetlands which had come back into use with lower eustatic sea levels.

Unfortunately, the leaching, tilling, ploughing, technology previously used very effectively to produce slabs of salt, was inherited by the new Islamic crop agriculture revolution. The tens of thousands of ancient Persian Qanat Karez lines of tunnels and boreholes were originally designed to surge irrigate the saline fields by shallow flooding, dissolving the salt by capillary action, followed by recrystallizing and precipitation as a pure crust of assorted salts. Irrigation with sweet water from the Qanats concentrated the salts by a capillary action to the topsoil. enabling the formation of a solid crust. This was levered up and shaped into blocks and slabs of salt ready for the camel caravans to transport it to China in the east, and what was to become the new Ottoman Empire in the West. The Islamic movement controlled these salt supplies, mainly sodium chloride, well into the Middle Ages. One of the salts precipitated in this way WAS potassium chloride the main component of saltpeter. (American spelling saltpeter) The salt crust also included thin layers of organic sediments or microbial remains. This desert Qanat salt leaching was gradually discarded in favor of new industrial processes. The salt fields were converted to crop tilling and ploughing in spite of the high salinity, AS long as the Qanat water was available. Both the salt leaching agriculture and the original hydroponic “hanging garden” horticulture and crop growing technologies mostly invented by the Persians in the previous millennium, had been totally forgotten. The almost perfect micro eco-system of such a typical oasis had consisted of mountain shed water, Qanat fish, (specifically Alburnoides bi punctatus, grown and caught in the Qanat of uzineh (Bloch 1782) and recycled water with fish wastes to fertilize a very sophisticated hydroponic horticulture and cascade aquaculture. By the time Marco Polo came looking for this technology, it had been almost totally discarded, together with the anecdotal Arabian One-thousand-and-one nights.

A closer examination of the present universally accepted tilling and ploughing has raised many questions regarding its inefficiency, soil destruction, and wasteful water consumption. The question of fresh water supply has become possibly the most critical. The “ancient” hanging garden technology of hydroponic horticulture, has only recently gained ground as a new “start-up” operation, still requiring high investment, but prominent among many advantages, IT saves an estimated critical 90% of irrigation water consumption. Many ancient pyramids and inverted step temple systems seem to have been built over water sources and could well have been sophisticated terrace and cascading aquaculture, only possible in arid zones. In the Middle East today, water availability has become a “Cassus belli” almost eliminating the calculated cost of new desalination methods. Many centuries ago under almost identical circumstances, common salt: sodium chloride, was in similar critical supply. the translation OF war, ; in Hebrew, (“ado about” I don’t understand this), and Salt could well serve to remind us of the extreme behavior of even highly developed civilizations in crises of famine through forced lack of the most basic supplies. Almost every community or town in Central Asia, (particularly those in Iran) is built upon the foundations of a Qanat [Kariz] [Falaj] tunnel water supply. Without this purposebuilt ancient perquisite, a sophisticated, engineered water system, none of these communities could have come into being. The typical terrestrial locations of such communities are highly saline Endorheic basins, in markedly arid zones. To motivate such high human endeavor, an equivalent human need was necessary. With regard to this “ raison deter” or the rationale to exist in such desolate locations and to build such an infrastructure, one can only wonder at the resulting richness of the cultures that have since become icons of history. No less an historical explanation must be offered to understand the wherewithal, from which it was subsidized.

These almost perfect oasis ecosystems seem to have existed in almost perfect isolation. With the exception of the salt that we know in hindsight supplied a temporary global famine, these oases were an exclusive cultural heritage. From the Mediterranean civilizations to the Dynasties of the Chinese coast, salt supplies came from the Taklamakan and Persian deserts, in spite of treaty ports and a seemingly more efficient seagoing route. The Silk Road which historically has claimed to connect East with West, was so named only recently by a German archaeologist since it was recognized that the silk from China was a crucial element of that trade. Yet we now know that the Silk was mostly a means of exchange along the trading road, and a stable currency (particularly amongst the Chinese) and only a minimal luxury item, rather than a commodity. The Tuntian [屯 田 制] of the Han dynasty’s military agro-communities were initially, exclusively directed to protect and maintain the Eastern Silk Road route which supplied China. The Great Wall was developed to protect the Qanat industry and has often been compared to the Qanat engineering as a comparable human achievement. In parallel, as global eustatic sea levels rose to a peak the Sabkha pans were inundated and this caused a salt famine. The protection of the western trade route and the Qanat source systems, became the responsibility of the Jafari Islam. The competition with Byzantium and the Crusaders consequently resulted creation of the Ottoman Empire. The competition to the Tuntian military agro-community was the Mongolians, and those north of the Great Wall.


Conclusion

The traded, ultimate spice commodity produced mainly along the Silk Road during an extended period of famine, and monopolized by two main parties, each to its own direction, was slabs of “common salt” in China, and the Mediterranean basin civilization. The means of exchange were primarily silk from China and gold coins, Ducats from Rome and Venice. Today’s new start up aqua-cultures including hydroponics, are in fact very ancient technologies, directly linked to the original Qanat Karez design and highly efficient in their use of water which today, could prevent much of our present political conflict. The oasis micro eco-systems based upon the Qanats are a model ideally suited to modern sprawling populations, each seeking local individuality and independent identities.

For more Lupine Publishers Open Access Journals Please visit our website:
For more Open Access Environment Journal articles Please Click Here:
To Know More About Open Access Publishers Please Click on Lupine Publishers


Follow on Twitter   :  https://twitter.com/lupine_online


Wednesday, 16 October 2019

A Mechanics-Based Procedure for Predicting Groundwater-Rise-Induced Slope Displacements


Lupine Publishers- Environmental and Soil Science Journal


Abstract

A procedure for predicting cumulative slope displacements induced by groundwater table changes is proposed. The proposed procedure incorporates a back-calculation technique for the soil strength parameter based on the records of slope displacement and ground water table changes. The analytical tool for the back-calculation is a limit-equilibrium-based finite displacement method (FFDM) requiring force and moment equilibrium, displacement compatibility, and a hyperbolic shear stress-displacement constitutive law. The analyzed potential sliding mass is a statically determinate system, providing a closed-form solution for the displacement of the slope. Two well documented case histories of periodic rainfall-induced slope displacements are used to validate the proposed analytical procedures. The hyperbolic soil strength parameters back-calculated from the first event of slope displacement can be used as operational soil strength parameters for predicting subsequent slope displacements caused by rainfall-induced groundwater table elevation changes. The proposed method alleviates possible difficulties associated with the evaluation of soil strength using undisturbed soil sampling of colluviums in foothill areas. The proposed method requires little computer time in deriving useful information of slope displacement which cannot be achieved using conventional limit equilibrium methods or advanced numerical analyses. The proposed analytical procedure is valid only for simulating instantaneous sliding where time-dependent viscous (or creep) deformation is not dominant.


Introduction

A substantial part of the infrastructure damage and remediation budget is used to fix damage caused by slope failures [1,2]. Therefore, analyses for slope failure potential in response to environmental changes, such as intensive rainfall, seismic activities [3] or groundwater level changes [4] is necessary for facilitating maintenance and disaster mitigation programs. Various analytical methods have been developed for slope stability evaluations. In the study of important and large-scale infrastructure such as dams or metropolitan shield tunnels where failures are lifethreatening, sophisticated numerical methods, such as the finite element method (FEM) and the finite difference method (FDM), are desirable [5]. In such cases, sufficient budgets for intensive ground explorations, computer analysis, and skillful computational engineers are needed. In reality, studies on slope stability are frequently time- and budget-limited, and a numerically accurate (or sophisticated) computer analysis often makes numerous assumptions regarding the underground geological or geo environmental conditions. A complete numerical analysis with totally known material properties and underground environmental conditions is rare. This may explain why limit equilibrium methods, in which the displacement (or strain) is not an analytical outcome, are still popular among geotechnical engineers in studying slope engineering problems. Most conventional limit equilibrium slope stability methods are based on the principle of limit equilibrium (or force equilibrium), providing a single value of safety factor (Fs) for the analyzed slope without considering displacement-related information for the potential sliding soil mass. A time-efficient tool capable of calculating slope displacements is necessary. A forceequilibrium- based finite displacement method (FFDM) proposed by Huang [4] is used here.


Methodology

Object of Study

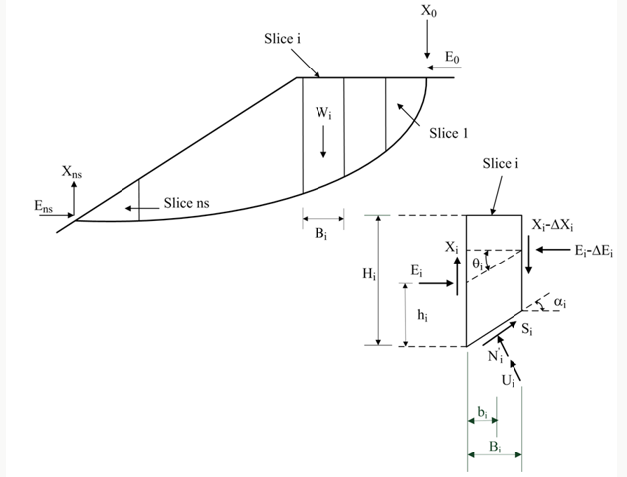
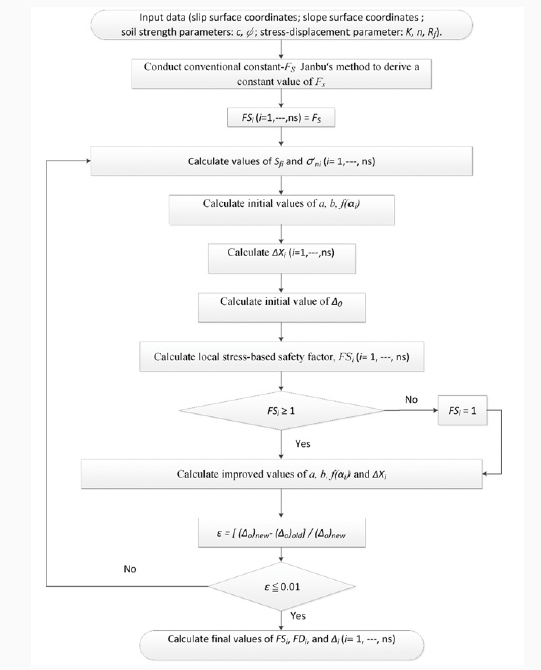
The method of FFDM proposed by Huang [4] and extended by Huang [6], Huang and Yeh [7] and Huang [8] constitutes the core of back-calculations and predictions discussed in the following. It has been previously shown that for a sliced potential failure mass confined by a slip surface with an arbitrary shape, as shown in Figure 1, the system is a statically determinate one. A constitutive law for the shear stress vs. shear displacement relationships based on the hyperbolic soil model (parameters: K, n, and Rf) for the soil constituting the slip surface is incorporated. In addition, the Mohr- Coulomb failure criterion (parameters: cohesion, c and internal friction angle, Ф), and local safety factor, F Si, the displacement compatibility between adjacent slices is considered by using displacement diagrams (displacement compatibility function f(αi)). The vertical displacement at the top of the potential sliding mass (D0) and shear displacement along the sliding surface (D1- Dns; ns: total number of slices). Figure 2 shows the flow chart of the computer program SLICE-DISP for the proposed FFDM.

Figure 1: Force system for a sliced potential failure mass with an arbitrary shape.
lupinepublishers-openaccess-journal-environmental-soil-sciences
Figure 2: Flow chart for FFDM computer program SLICE-DISP.
lupinepublishers-openaccess-journal-environmental-soil-sciences

Case History: Woo-Wan-Chai Slope

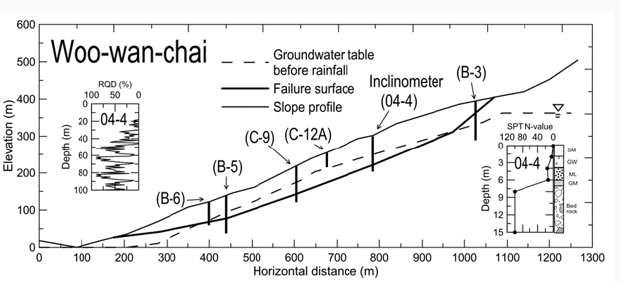
Figure 3: Slope profile for case history #1 (Woo-Wan-Chai).
lupinepublishers-openaccess-journal-environmental-soil-sciences
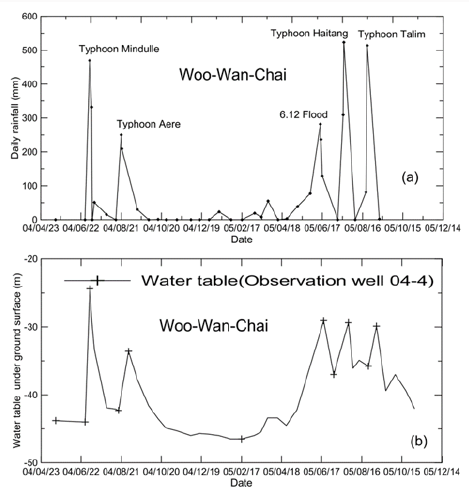
Figure 4: Records of long-term monitoring for case history #2: (a) Daily rainfall; (b) Groundwater table heights
lupinepublishers-openaccess-journal-environmental-soil-sciences
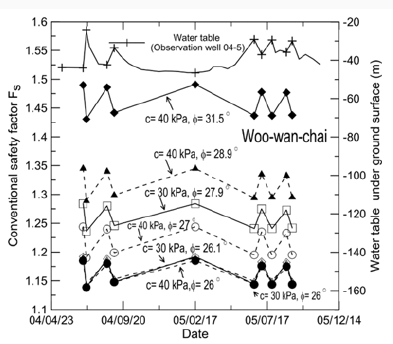
Figure 5: Conventional safety factors in response to the groundwater table fluctuations for case history #1 (Woo-Wan-Chai).
lupinepublishers-openaccess-journal-environmental-soil-sciences
Figure 3 shows a cross section of the Woo-Wan-Chai slope [9,10] consisting of alluviums. The slope is a part of a highway winding through the western foothills of Taiwan. The slope is subjected to rainfall-induced periodic displacements, requiring repeated remedial measures. Figures 4a & 4b show records of daily rainfall and groundwater table heights, respectively, during the period of May 2004 to October 2005. The majority of high daily rainfall is caused by typhoons. A close relationship between intensive rainfalls and rises of the groundwater table can be seen. The slip surface presented in Figure 3 is formed by connecting points of abrupt deflection detected by the inclinometers available in-situ. The slip surface reaches a maximum depth of about 90 m below slope surface. According to the values of Rock Quality Designation (RQD) as shown in Figure 3, the weather rock strata have scattered RQD values, occasionally showing a low RQD= 10%, suggesting the investigated slip surface is associated very weak soil-like material. Due to the difficulty associated with undisturbed sampling in weathered rock stratum, soil shear strength can only be estimated indirectly from the values of RQD. Values of internal friction angles (ϕ) ranging between 260c-350c are assumed in the following analyses. The first event of heavy rainfall (or groundwater table rise), caused by typhoon Mindulle on July 1, 2004, is used for calibrating in-situ soil parameters K, n, and Rf. The measured groundwater tables before and after rainfall shown in Figure 3 are used in the calibration of the in-situ soil parameters. Figure 5 shows the safety factors of the slope (Fs) calculated using the Janbu’s slice method with various input values of c and φ. It can be seen that during the period of monitoring, values of Fs varied to some extent according to the level of the groundwater table. However, these values of Fs suggest that the slope is stable and thus do not reflect the measured slope displacement.
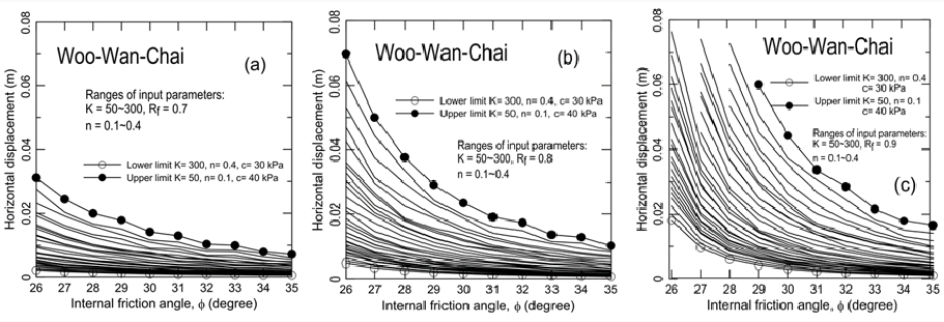
Figure 6: Results of parametric studies on case history #1 (Woo-wan-chai) using wide ranges of K, n, c and (a) Rf=0.7; (b) Rf=0.8; (c) Rf=0.9.
lupinepublishers-openaccess-journal-environmental-soil-sciences
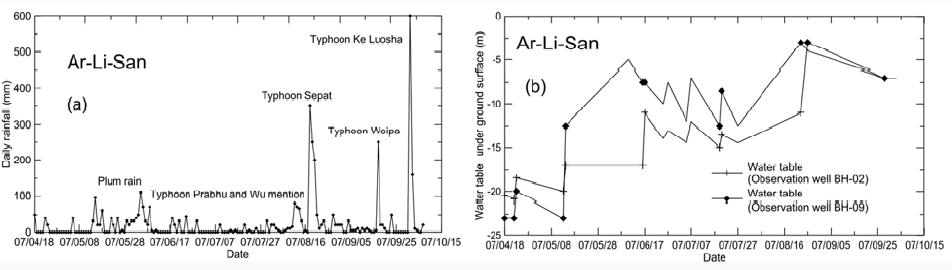
Figure 7: Records of long-term monitoring of case history #2: (a) Daily rainfall; (2) Groundwater table heights.
lupinepublishers-openaccess-journal-environmental-soil-sciences
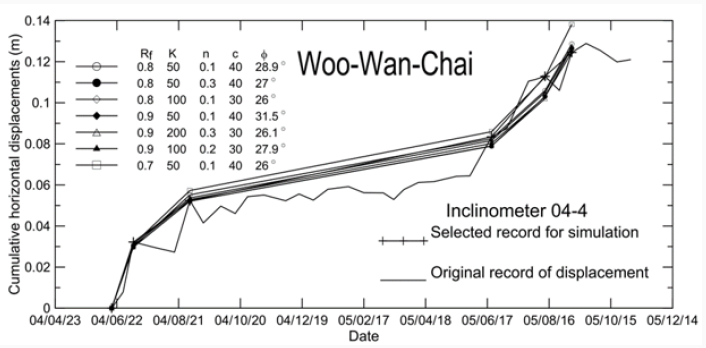
Figures 6(a-c) show the calculated horizontal displacement at the location of inclinometer 04-4 (which is 280.5 m from the crest of the slip surface) for the first rainfall event using Rf= 0.7, 0.8, and 0.9, respectively. In Figures 6(a-c), values of K= 50, 100, 200, 300; n= 0.1, 0.2, 0.3, and 0.4; φ=260c-350c were used to account for possible ranges of soil parameters. The reasons for using these ranges of Rf, K, and n are given in the Discussion section. For all cases, c= 0 was applied to the entire zone of the slope mass for the post-rainfall condition; c= 30 kPa was applied to the above-groundwater-table zone for the pre-rainfall condition. To obtain the calibrated values of K, n, Rf, and φ, horizontal lines were drawn at 30 mm (measured horizontal displacement from inclinometer 04-4 for the first event of slope movement) in Figures 7(a-c). Values of K and n that represent the upper bound, the intermediate value, and the lower bound of ϕ that generate a slope displacement of 30 mm were selected as the back-analyzed values of soil parameters. A total of seven sets of K, n, and Rf, are used for evaluating the slope displacements induced by the subsequent events of rainfall (or groundwater table rises). Figure 8 shows a comparison of calculated and measured cumulative slope displacements at the location of 280.5 m from the crest of the slip surface (at inclinometer 04-4). The calculation of cumulative slope displacements assumed that a plastic (or irreversible) slope displacement occurs for each rainfall event. The cumulative slope displacement measured at 280.5 m for the crest of the slip surface is also shown. A good agreement between the measured and calculated slope displacements (with a maximum error of 10%) can be seen. The fact that seven sets of input K, n, and Rf all generate similar values of cumulative slope displacement reveals that the final results of calculation are insensitive to the input parameters provided that the values of K, n and Rf, and φ are calibrated using the first event of slope movement.

Figure 8: Comparison of measured and calculated long-term slope displacements for case history #1.
lupinepublishers-openaccess-journal-environmental-soil-sciences

Case History: Ar-Li-San Slope

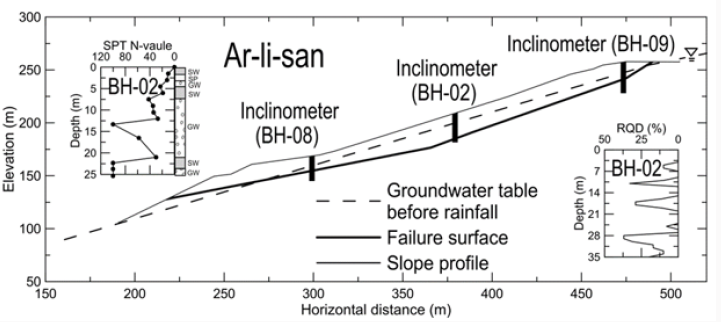
Figure 9: Slope profile of case history #2 (Ar-Li-San).
lupinepublishers-openaccess-journal-environmental-soil-sciences
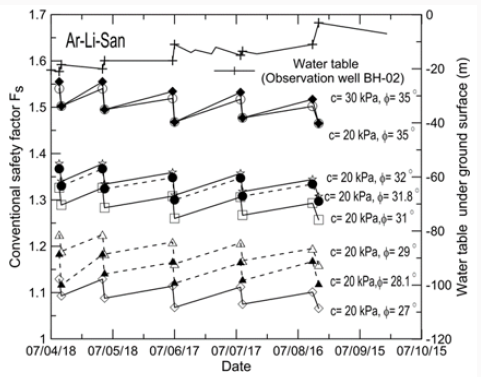
Figure 9 shows the cross section of the Ar-Li-San slope which is on the same highway as the slope in case history no. 1 but at a different location. A maximum depth of slip surface of about 25 m has been detected by the inclinometers shown in Fig. 8. The borehole data shown in Fig. 8 suggest that the slip surface locates in highly weathered rock strata which frequently show RQD values as low as zero. Therefore, a soil-like material is likely to prevail along the slip surface, and φ= 250c -360c is assumed in the following analyses. Figures 7 (a & b) show the daily rainfall and groundwater table levels, respectively, recorded during April-August 2007. Figure 10 shows the changes of safety factors associated with the fluctuation of the groundwater table. Figure 10 reveals a generally descending trend of safety factors in response to the generally ascending groundwater table during the rainy season. However, information on the performance of the slope during the rainy season is also lacking, as discussed for Figure 5.
Figure 10: Sefety factors calculated using Janbu’s slice method during the period of monitoring.
lupinepublishers-openaccess-journal-environmental-soil-sciences
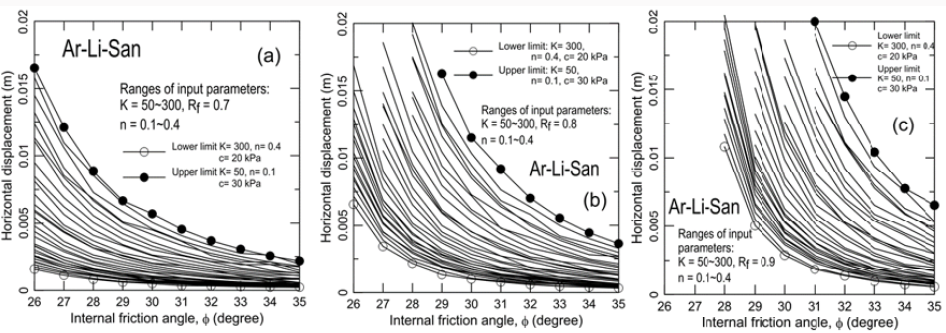
Figure 11: Parametric studies for the slope displacements using various input parameters: (a) Rf=0.7; (b) Rf=0.8; (c) Rf=0.9.
lupinepublishers-openaccess-journal-environmental-soil-sciences
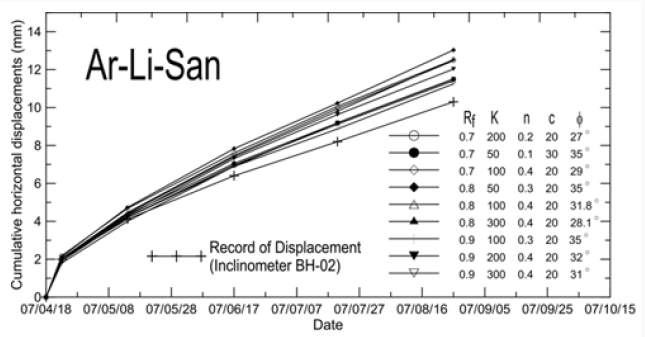
Figure 12: Comparisons of measured and calculated cumulative slope displacements for case history #2.
lupinepublishers-openaccess-journal-environmental-soil-sciences
Figures 11(a-c) show horizontal displacements at the location of 113 m from the crest of slip surface, calculated using Rf= 0.7, 0.8, and 0.9, respectively. Similar to those used for case history #1, K= 50, 100, 200, and 300; n=0.1, 0.2, 0.3, and 0.4; and φ=260c- 350c were used. A total of nine sets of K’s, n, and Rf were back-calculated based on an approach similar to that used in case history no. 1 for a measured horizontal slope displacement of 3 mm from the inclinometer (BH-02) in case history no. 2. Figure 12 shows comparisons between the measured and calculated cumulative slope displacements. The trends of all calculated curves of cumulative slope displacement are close to that of slope displacement during the rainy season. It can be seen that for the five simulated events, the percentage error ranges between 10% and 20%, which is larger than that for case history no. 1 partially due to the fact that the slope displacement in the monitoring season was relatively small (a few mm). A 20% error for slope displacement prediction is considered acceptable. This result confirms that the calculated cumulative slope displacement is insensitive to the input parameters provided that they are back-calculated from the first event of slope movement.


Conclusion

A mechanics-based procedure for predicting continuous slope displacements induced by periodic groundwater table changes was proposed. A limit-equilibrium-based finite displacement method (FFDM) previously proposed by the author was used to calibrate soil parameters based on two long-term records of periodic slope displacements induced by some intensive rainfall (or groundwater table fluctuations). The proposed approach consists of a calibration procedure that is used to find possible representative soil strength and displacement-related parameters based on the first event of slope movement induced by a groundwater table rise. These backcalculated soil parameters were then used to predict subsequent slope displacements in response to the groundwater table rise induced by intensive rainfall. Two case histories were used to verify the proposed approach. The effectiveness of the proposed method in predicting groundwater-table-induced instantaneous and cumulative slope movements was demonstrated. The proposed method requires little computer time to provide useful slopedisplacement- related information which cannot be achieved using conventional limit equilibrium or advanced numerical methods.

For more Lupine Publishers Open Access Journals Please visit our website:
For more Open Access Environment Journal articles Please Click Here:
To Know More About Open Access Publishers Please Click on Lupine Publishers

Follow on Twitter   :  https://twitter.com/lupine_online