Lupine Publishers | Journal of Organic and Inorganic Chemical Sciences
Abstract
Poly (1,4-benzenedimethylene phthalate) was synthesized by
condensation of phthaloyl chloride with 1,4-benzenedimethanol in the
presence of pyridine in dry THF at 30 °C . The resulting polymer white
powder was characterized by viscosity measurement, FT-IR, 1H and 13C
NMR, elemental analysis, thermal (TGA-DSC) methods and scanning electron
microscopy. The uptake properties of Pb(II), Zn(II) and Cd(II) metals
by the polymer from aqueous solutions were studied by the batch and
column techniques as a function of pH, temperature, concentration and
contact time. The uptake increased with increasing pH reaching a maximum
at pH = 6.00 for all ions. The polymer showed high uptake capacities
toward Pb(II) and Zn(II) ions, but medium uptake capacity toward Cd
(II). The linearized forms of Langmuir, Freundlich and
Dubinin-Radushkevich adsorption isotherms indicate studied ions Pb(II),
Zn(II), and Cd(II). The adsorption capacity follow the order: Pb(II)
> Zn(II) > Cd(II).
The thermodynamic functions, ΔGǂ, ΔHǂ and ΔS° were determined for
Pb(II), Zn(II) and Cd(II); the values of AG° indicated that the
adsorption process of these metal ions on the polymer is favorable. In
this work, the values of ΔGǂ, ΔGǂ and ΔSǂ were determined by using
Eyring-Polanyi equation and Arrhenius equation. The results indicated
that ΔGǂ=72.8, 78.6, 87.8kJ/mol for Pb, Zn, Cd ions, respectively. The
column experiments for metal ion uptake were conducted at pH= 6.0, 25.0
°C, and initial concentration of 150.0mg/L. The loaded concentrations
were 76.42, 49,05 and 28.47 ppm for Pb, Zn, Cd ions, respectively. The
efficiency for recovery of metal ions after adsorption by treatment of
the loaded polymer with 0.1M HNO3, 0.1M EDTA, gave good percent recovery
for 0.1M HNO3
Keywords: Benzendimethanol; Phthalate polymers; Condensation polymerization; Polymers uptake; Metal ion uptake; Adsorption
Introduction
Heavy metals are known for their toxicity to living organisms. Their
concentrations in the environment increase with the increase of
industrial activities. Most important, these metals are not
biodegradable and tend to accumulate in living organisms, and causes
serious health problems [1]. Allot of methods were reported for removal
of metal ions from aqueous solutions; these include filtration,
adsorption, chemical precipitation and ion exchange [2]. Different
approach for removal of metal ions from water streams which have been
increased in recent years [3], is the adsorption of metals by polymers.
This approach is characterized by high effectiveness, high adsorption
capacity, and high selectivity, fast kinetics of metal-ion uptake, high
mechanical strength, chemical resistance and recyclability of the
polymer [4,5].
According to their methods of preparation, synthetic polymers can be divided into three major types:
A. Chain Reaction (Addition) Polymers: These polymers are formed by
addition to the double bond of monomers containing carbon-carbon double
bonds, called vinyl monomers, without the loss of small molecules. The
repeating units of addition polymers have the same composition as the
monomer [6].
B. Condensation Polymers: these polymers are formed by condensation
reaction of monomers containing organic functional groups. These
reactions usually involve elimination of small molecules (e.g., water,
methanol, and ethanol) [6].
C. Other Polymers May Be Prepared by Modification of Polymers by: I-
Attachment of an appropriate specific ligand groups to the polymer
chains. This method has been preferred since functional groups
containing ligands can easily be attached to polymers than inorganic
supports. [7,8]f The attachment of dithiocarbamates to polystyrene cross
linked with 2% divinylbenzene is an example of this type [9]. II-
Polymerization of monomers to which ligand groups are attached. Polymers
with ester linkages in their main chain are used in many applications
such as biomedical matrices, liquid crystals, fibers, and heat resistant
materials [10]. Polyesters are characterized by higher adsorption
capacities, efficiencies as well as high selectivity to some metal ions.
[11] Synthetic polyesters may be prepared by polycondensation of
diacids with diols, diaciddichlorides with diols and ester interchange
reaction of diesters with diols.
There are two types of polyesters: Aliphatic polyesters and aromatic
polyesters. The synthesis of aliphatic polyesters has been well
established for several years. However, these polyesters possess low
thermal stability due to their low melting points and glass transition
temperatures owing to their low molecular weight. These properties
resulted in limited usage and few applications of aliphatic polyesters,
yet they showed potential as biodegradable polymers. On the other hand,
aromatic polyesters display an excellent pattern of physical properties.
They are strongly resistant to hydrolysis, bacterial and fungal attack,
they also remain unaltered in the environment [11,12], Combining
aromatic and aliphatic units in the same polyester chain has been
envisaged as an attractive approach to obtain novel products
encompassing biodegradability and high performance properties [11].
There are a lot of polymers were prepared and their sorption behavior
was studied in our laboratory,such aspoly (1,4-cyclohexanedimethylene
oxalate), Poly (bisphenol A oxalate), poly-cis,trans (1,3-cyclohexylene
oxalate), poly (bisphenol- Aphthalate), poly (bisphenol-Acis-1,2
cyclohexanedicarboxylate), poly (1,4-yclohexanedimethanolphthalate) and
poly (1,4-cyclohexanedimethanol succinate).
Experiment
Materials
The chemicals were obtained from commercial sources as either
analytical reagent grade or chemically pure grade and were used as
received. The chemicals were purchased from the corresponding companies:
Phthaloyl dichloride, 1,4-benzenedimethanol, cadmium(II) nitrate
tetrahydrate and zinc(II) nitratehexahydrate from BDH;
N,N-4-dimethylaminopyridine (4- DMAP), dimethylsulfoxide (DMSO) from
Acros, pyridine (GPR), nitric acid (65%), hydrochloric acid (36.5 %),
and disodium ethylenediaminetetraacetate(EDTA)(Scharlau),
sodiumperchlorate (SIGMA), tetrahydofuran (THF) (GCC) and lead(II)
nitrate (PRS Paureac) and 4-dimethylaminopyridine (4-DMAP)from Acros.
Preparation of The Polymer
Poly(1,4-benzenedimethylenephthalate) was synthesized by
polycondensation using single phase organic solvent polymerization.
1,4-benzenedimethanol ( 4.97g, 0.036 mol), pyridine (8.54g, 0.108mol)
and a catalytic amount of 4-DMAP were dissolved in THF (60 mL). To this
solution, a solution of phthaloyl chloride (7.307 g, 0.036mol) in THF
(30mL) was added drop wise with stirring. The reaction mixture was
stirred for 1 h at (30-35) oC and then for 3 days at room temperature.
The polymer precipitated as a white solid from the THF solution. The
solvent was evaporated and the solid was dissolved in chloroform (150mL)
and washed with water (2x500mL), (6% v/v) HCl solution (1 x 150mL), and
finally with distilled water (3x500mL). The chloroform solution was
dried over anhydrous sodium sulfate, and was then concentrated to about
100 mL of solution. The polymer was precipitated by drop wise addition
of chloroform solution to 500.0mL of methanol. The precipitated polymer
was then filtered and dried at 55.0 oC under vacuum to give a white
powder 66.0g, (68 % yield).
Preparation of Stock Solutions
Stock solutions (1000.0 mg/L) of the three metal ions were prepared
by dissolving specific amounts of the salts of Pb(II), Zn(II), and
Cd(II), in 0.1 M NaClO4 which was adjusted to the desired pH. The stock
solutions were used to prepare solution with different concentrations
(20.0, 40.0, 50.0, 60.0, 80.0, 100 and 150.0mg/L). The dilution is
achieved by using 0.10 M NaClO4 and adjusted by 0.10 M HClO4 to achieve
the desired pH= 4.00, 5.00 and 6.00.
Study of Metal Uptake Characteristics of The Polymers By Batch Technique
The metal uptake characteristics for each metal ion were studied
using batch equilibrium technique. An aqueous solution of known metal
ion concentration (25.0mL) was added to polymer powder (0.10 g), the
mixed solutions were mechanically shaken, after a certain period of time
at 25.0 oC, 35.0 oC, 45.0 oC, the mixture was filtered and the amount
of the metal ion remaining in the filtrate solution was determined by
atomic absorption spectrometry after constructing up an analytical
calibration curve for each element (Pb(II), Zn(II), and Cd(II)).
The Rate of Metal Ion Uptake
Experiments for determining the equilibrium time for the metal ion
uptake process involving 100.0mg ± 0.1 mg of the polymer was swelled
with 25.0mL of metal ion solution containing 150mg/L metal ion at
different pH, and the solution was mechanically shaken. The contact time
was varied from 5 minutes to 48 hours at 25.0 oC, 35 oC, 45 oC. The
mixture was filtered and the amount of the metal ion remaining was
determined with atomic absorption spectrometry. The amount of metal ion
uptake by the polymer (qe), may be obtained from the following relation:

qe: Metal ion uptake by the polymer (in mg M(II)/ g polymer).
Ci: Initial metal ion concentration (mg/L).
Ceq : The residual concentration of the metal ion in solution at equilibrium (in mg/L).
V: volume of solution (L).
m: mass of polymer (g).
And the percentage of metal ion loading by the polymer expressed as % uptake was [13]:
Effect of pH on The Metal-Ion Uptake
Similar experiments were also carried out, under different pH values
of 4.00, 5.00 and 6.00 for fixed contact time of 24 hours to determine
the effect of pH on the metal ion uptake by the polymer.
Adsorption Isotherms Studies
The adsorption of Pb(II), Zn(II), and Cd(II) was carried out by
taking a known mass of 100.0g ± 0.1mg of the polymer swelled with 25.0mL
of solutions of concentration variation ranging from (20.0- 150.0)mg/L
for each metal, under different pH values of 4.00, 5.00 and 6.00 and
different temperatures (25.0, 35.0 and 45.0) oC.
Metal Ion-Uptake By The Polymer Using Column Experiment
Glass column of 30.0 cm length and 1.5cm inner diameter was used in
this experiment. The column was packed with 1.00g ± 0.1mg dried polymer.
A sample volume of 150.0mL containing Pb(II) of 1000mg/L was passed
through the column at a flow rate of 1.0mL/4min. The eluate was
collected in a 100.0mL volumetric flask, and concentration of the metal
ion was then determined by AAS. The same experimental conditions were
used for the determination of Zn(II), and Cd(II) ions uptake, where the
sample which passed through the column was 150mg/L of these metal ions.
Desorption studies
The desorption of the Pb(II), Zn(II), and Cd(II), ions was carried
under column condition, where the polymer was loaded with each metal ion
as described before, using 50.0mL of two eluting agents, 0.10M HNO3 and
0.10M EDTA were used for polymer recovery from adsorbed metal ion,
keeping the flow rate of elution at (1mL/4min). The concentration of
metal ion in the eluate was collected in five 10.0mL portions, and was
then determined by AAS.

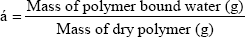
Water regain (α):
Water regain is defined as the amount of water absorbed by 1000.0mg ±
0.1 mg of polymer [14]. A sample of dry polymer was suspended in water,
and was left for 2 and 24 hours. The polymer was filtered and weighed,
dried at 60.0 oC and then re-weighed. Water regain (α) was calculated
from the mass difference (eq).
Results And Discussion
Polymer synthesis
The synthesis of poly (1,4-benzenedimethylene phthalate), from
equimolar amounts of 1,4-benzenedimethanol and phthaloyl chloride was
performed by solution polycondensation in THF at 30.0 °C in the presence
of excess pyridine as acid scavenger and 4-DMAP as the catalyst. The
reaction proceeded by pyridine- catalyzed nucleophilic displacement of
the chloride of the phthaloyl chloride with the alcoholic group of
1,4-benzenedimethanol. The relatively high yield of the polymer may have
been due to the high reactivity of phthaloyl chloride group. The
resulted polymer, which was obtained as a powder was found to be
insoluble in many common organic solvents such as tetrahydrofuran (THF),
diethyl ether, acetone and methanol but soluble in chloroform.
Solution viscosity
The inherent viscosity of poly(1,4-benzenedimethylene phthalate)
solution was calculated from viscosity measurements of dilute polymer
solutions (0.5g/dL) in chloroform at 25 °C. The polymer had an inherent
viscosity of 0.22dL/g. This value indicates that the polymer had an
intermediate inherent viscosity which implies that it had moderate
molecular masses. This value is higher than the those obtained at 0-5°
for poly(bisphenol-Aphthalate), poly(bisphenol-Asuccinate), and
poly(cyclohexanedimethylene phthalate) which had the values of 0.11dL/g ,
0.13dL/g, and 0.11dL/g, respectively [15].
Infrared spectroscopy
The polymer was analyzed by FT-IR spectroscopy. The FT-IR spectrum
exhibits characteristic absorption bands for the major bonds involved in
the polymer. The FTIR spectrum (Figure 1) showed two strong absorption
bands for the stretching vibration of the carbonyl group (C=O) of the
phthalate ester group at 1726cm-1 and for C-O-C in the range from 1124
to 1279cm-1. Another strong IR band was observed at 2951cm-1 assigned to
the C-H stretching in the 1,4-benzendimethanol moiety. These wave
numbers, which are typical for the ester group are conformed to the
reported literature [15], and thus confirm the formation of the
postulated polymer Scheme 1 and Figure 1.
Scheme 1: Preparation of poly (1,4-benzenedimethylene phthalate) polymer.

Figure 1: IR spectrum of poly(1,4-benzendimethayl phthalate) polymer.

The Nuclear magnetic resonance (nmr) spectra for polyesters
Figure 2: 1H-NMR spectrum of the polymer.

1H-NMR spectrum: The polymer was analyzed by NMR spectroscopy in
order to elucidate its chemical structure and support its formation. In
the 1H-NMR spectrum of poly(1,4- benzendimethylene phthalate), the
signal of the aromatic protons of the phenylene ring of
benzendimethylene unit was observed as singlet at δ = 7.36ppm, whereas
that of the aliphatic methylene protons attached to the oxygen of the
ester group was observed as singlet at δ = 5.22ppm. The aromatic
methylene protons of the phthalate unit in ortho and meta positions to
the ester were observed at δ = 7.71ppm and 7.50ppm, respectively. The
1H-NMR spectrum is shown in Figure 2. In the 13C-NMR spectrum of
poly(1,4- benzendimethylene phthalate), the signal of the aromatic
carbon atoms of the phenylene ring of benzendimethylene unit appeared at
δ = 129ppm. The signal of the quaternary aromatic carbon atoms appeared
at δ = 136ppm. The signal of the aliphatic methylene carbon atoms
attached to the oxygen of the ester group appeared at δ = 67ppm. The
signal of the quaternary aromatic carbon atoms of the phthalate unit to
which the ester group is attached appeared at δ = 132ppm. The signals of
the aromatic carbon atoms in ortho and meta positions to the ester
group appeared at δ = 129ppm and 133ppm, respectively. The signal of the
carbonyl carbon atom of the ester group appeared at δ = 167 ppm. The
13C-NMR spectrum of the polymer is shown in Figure (2), and the1H-NMR
and 13C-NMR spectral data for the polymer assigned to the various proton
and carbon atoms are presented in Table 1 (Figures 3 & 4).
Figure 3: 13C-NMR spectrum of the polymer.

Figure 4: DSC thermo gram of polymer.

Table 1: Thermal stability of polymer.

Thermal Properties
The thermal properties of polyesters synthesized were also
investigated by differential scanning calorimetry (DSC), and
thermogravimetric analysis (TGA) under dry N2 atmosphere.
Thermal Transition
The thermal properties of polymer were investigated with DSC and TGA.
The Tg value of the polymer was 52°C. This value is considered lower
than expected for such an aromatic polymer such as poly(ether carbonate)
containing aromatic -aromatic ether showed Tg values from room
temperature up to 47°C [16] and polyquinoxalines and other aromatic
polymers were studied Tg from 215.5 to 394.5°C [17]. This Tg value may
have been due to the imparted flexibility effects of the aliphatic
methylene groups of the 1,4 -benzenedimethanol. The presence of the
aliphatic moieties in the polymer backbone imparted flexibility to
polymer segments to move under the effect of temperature. This ease of
motion is reflected in the slightly low Tg value of the polymer [16].
The DSC thermogram of the polymer is shown in Figure 4.
Thermal stability
The thermal stability of the polymer was investigated by TGA under
dry nitrogen. Table 1 summarizes the initial thermal decomposition
(onset) temperature Tid, T5%d , T10%d , and T50%d
decomposition temperatures, which correspond to the temperatures at
which 1, 5, 10, and 50% loss of mass of polymer occurred, respectively.
The table 2 also shows the residual mass percent remaining after heating
the polymer to 673.1 °C which was found to be 8.74%. The thermogram of
the polymer Figure 5 displayed a typical one-stage characteristic with a
relatively fast mass loss occurring at temperatures between 400 and 450
°C. The fast mass losses may have been due to decomposition of the
polymer backbone. These values are higher than the corresponding values
obtained in the case of poly (1,4-cyclohexandimethlene- phthalate),
which occurred between 350-450°C and the residual mass equal 0.44% [15].
Table 2: Several reported metal uptake values by chelating polymers in the literature.

Figure 5: TGA thermogram of poly(1,4-benzenedimethayl phthalate) polymer.

Morphological Characterization
The surface ofthe polymer was also characterized by SEM before and
after metal sorption. The SEM micrographs for the polymer synthesized
are shown in Figure 6. The pores are distributed on the rough surface of
the polymer, the small pores which are similar to the forms of flowers
are located on the surface of the rods with an average size <5|im.
The existence ofthese pores provides convenient diffusion channels for
metal ions into the interior of the polymer when it is used for
adsorption of metal ions from aqueous solution. The interior structure
of the polymer showed randomly distributed large gaps and air pockets
created during polymerization. The spongy structure of the inner rods
maximize the contact surface between the polymer and the solution which
led to increased metal ion uptake, this is shown in Figure 6a for the
polymer before metal sorption. However, after adsorption of metal ion by
the polymer, a slight loss occurred to the composition of surface
features and of the channel and a small part of its surface became
smooth. This is represented for the polymer surface loaded with Cd(II)
ions and is shown in Figure 6b & c. It has been found by SEM
investigation that loading the polymer with zinc ions changed its
surface topography, increased the proportion of smooth surface and
resulted in narrow channels and pores Figure 6d & 6e. The highest
uptake of metal ions by polymer was for Pb(II), the polymer loaded with
lead ions was studied by SEM to observe the changes in surface
topography that took place, the entire surface became smooth and the
pores disappeared due to full metal ion coverage. SEM for our polymer
was similar to that of poly(cychlohexandimethelen succinate) (Al- Dweri,
2010). The images are presented in Figure 6f-6i.
Figure 6: SEM images of poly(1,4-benzenedimethelen phthalate).

Water Regain or Water Content ( α )
Water regain experiment was performed to determine the water regain
ratio (α) for the polymer. Water regain is usually correlated with the
hydrophilic character of the polymer, the higher the water regains, and
the more hydrophilic the polymer is. The water regain value for the
polymer was found to be 0.019 g/g after 2h of stirring and 0.029g/g
after 24h stirring, this indicates that the polymer has a low
hydrophilic character. These values are higher than the corresponding
values obtained by poly(1,3-cyclohexylene oxalate) polymer which was
found to have values of 0.011g/g and 0.014g/g, respectively. Based on
these values the polymer is considered to be low hydrophilic in nature
[18] and these values are smaller than the corresponding values obtained
for poly (1,4-cyclohexanedimethylene oxalate) polymer which was found
to have values of 0.064g/g and 0.087g/g [19]. Principally, the water
molecules are polar and would interact with the polar groups of the
polymer (the ester group), this interaction explains the water regain
properties of the polymer.
The rate of metal ion uptake by the Polymer
The adsorption kinetics of metal ions on the surface of the polymer
was investigated as shown in Figure 7 for example. The adsorption of
metal ions increase with time until complete saturation.
Figure 7: Metal uptake as a function of contact time, at pH = 6, T = 45 °C, and initial concentration of 150ppm.

Adsorption Isotherms of the Polymer
Using linearized Langmuir and linearized Freundlich isotherm as
analyzed to determine adsorption isotherms for metal ion Pb(II), Zn(II)
and Cd(II) at different pH values (4.00, 5.00 and 6.00) and different
temperatures (25.0 oC, 35.0 oC and 45.0 oC) in the range of
concentrations from 20.0 to 150.0mg/L. The adsorption isotherms results
are presented in Table 3 and shown in Figure 8 & (Table 2) (20-23).
Figure 8: Plots of a) adsorption isotherm b) Linearized Freundlich c) Linearized Langmuir of Pb(II) at pH = 6 and 45 °C.

Table 3: R2, qm, and KL values obtained from Langmuir plots

In the Langmuir model, the values of correlation regression
coefficient (R2) are greater than 0.90 and had excellent linearity. This
indicates that homogenous sites of interaction are better to describe
the process and the maximum sorption capacities (qm) deduced from these
results indicated that the polymers has the highest capacity towards
Pb(II) ions, but it shows a lower capacity towards Cd(II). It is
observed that the adsorption capacity (qm) increases as the temperature
and pH values increase for all investigated metal ions. Comparing the
values of qm of the synthesized polymer to literature values Table 2.
Typical qm values obtained in this work at pH= 6.00 and 45.0 oC for the
adsorption of various metal ions on our polymer were as follows:
Metal ion: Pb(II) > Zn(II) > Cd(II)
qm (mg/g) = 35.7 > 23.8 > 22.7
Metal ion: Zn(II) > Cd(II) > Pb(II)
qm (mmol/g) = 0.36 > 0.20 > 0.17 (Tables 3 & 4).
Table 4: R2, KF and n values obtained from Freundlich plots

The trend in qm values in poly(1,4-cyclohexanedimethylen phthalate)
at pH= 6.00 and 25.0 oC is Pb(II) > Cd(II), in (mg/g) were
53.5>17.7 respectively [15]. The trend in qm values for poly(1,4-
cyclohexanedimethylene oxalate) at pH= 4.00 and 25.0 oC is Pb(II) >
Cd(II) > Zn(II), in (mg/g) were 31.2 > 29.8 > 15.9,
respectively [19]. The trend for Pb(II) and Cd(II) ions in
poly(hydroquinone oxalate), and in poly(neopentyl oxalate) polymer, were
as follows: Pb(II)>Cd(II) [24-27] and thus the results similar in
order the metal ion with our results in the literature [23] that is qm
values 207.7 >30.7 >19.1 for Pb(II) >Zn(II) >Cd(II) in
poly(bisphenol A oxalate). The results indicate that our polymer has
reasonable qm values. In the Freundlich model, both KF and nare
Freundlich constants, being indicative of the adsorption capacity and
the adsorption intensity respectively. High value of n between (1.4-3.6)
indicates that adsorption is good over the entire range of
concentration studied, while small values of n means that the adsorption
is good at high concentrations but much less at lower concentrations
and the values of n were greater than one indicating that the adsorption
was favorable. A greater value of KF indicates a higher capacity for
the adsorption than smaller values [28].
Dubinin-Radushkevich
The linear form for Dubinin-Radushkevich (D-R) isotherm has the following expression:
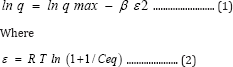
R is the ideal gas constant (8.3145 J.mol-1.K-1) and T is the
absolute temperature (Kelvin). The values of p and q max are
evaluated from the slope and intercept of the linear plot of lnq versus
s2, where q max is related to the adsorption capacity and p is the
constant related with the adsorption energy. The free energy of
adsorption (E) is defined as the free energy change required for
transferring one mole of ions from solution to the solid surface, this
energy is calculated as follows:

Table 5: Dubinnin-Radushkevich (D-R) isotherm parameters for Pb(II), Zn(II) and Cd(II).

As illustrated in Tables 3-5, the values of E for Pb (II) are
(0.1100.600 kJ/mol), for Cd(II) are (0.080 -0.200 kJ/mol) and for Zn(II)
are (0.180-0.310kJ/mol). All values are less than 8.00kJ/mol, this
indicates that physical forces affect adsorption. The result of the
concentration variation isotherms of polymer (Table 5) and the plots of
Dubinin-Radushkevich at pH= 4, 5 and 6 at 25 °C, 35 °C, 45 °C are shown
in Figure 9.
The Effect of Temperature on The Uptake
The effect of varying temperature on the % uptake of metal ions was
also investigated. The results are obtained by plotting % uptake at
different pH against temperature and are presented in Figure 10. The
results obtained showed that the adsorption process of Pb(II) , Zn(II)
and Cd(II) onto the surface of the polymer is an endothermic process
since the % uptake increases as the temperature increases nearly at all
tested pH values.
Figure 9: Plots of Dubinnin-Radushkevich (D-R) isotherm for
the adsorption of Pb(II) on the polymer at pH= 6.00 and a) T= 25 °C, b)
T= 35oC, c) T=45 °C

Arrhenius Parameter
Table 6: The Arrhenius parameters for Pb(II), Zn(II) and Cd(II) at pH=6 and temperatures 25.0oC, 35.0oC, 45.0oC.

Table 7: The Arrhenius parameters: Activation energy ( E) and
pre-exponential factor (A) for Pb(II), Zn(II) and Cd(II) at pH=6 and
temperatures 25oC, 35oC, 45oC.

Arrhenius equation can be used to determine the activation energy and
pre-exponential factor for a reaction were calculated from Figures 11
and shown in Table 6. The results A and Ea values that obtained in
Figure 11 and Table 6 are calculated from Arrhenius equation:
Ln k = - Ea / R T + Ln A .....(4) (Table 7)
Where k is the rate constant, Ea activation energy, R gas constant
and A pre-exponential factor. The values of A and Ea can be calculated
from intercept and slope of a straight line of a plot of Ln k against 1/
T. The pre-exponential factor A is the constant of proportionality
between the concentration of the reactants and the rate at which they
collide. The activation energy Ea is the minimum kinetic energy required
for a collision to result in reaction, through the more favorable
molecular orientations. The factor exp (-Ea / RT) represents the
fraction of molecular collisions that have an energy value equal to or
greater than the activation energy Ea. At higher temperatures a larger
portion of reactant molecules will have the required Ea to react. Thus,
the reaction rates depend on Ea, the reactant orientations (relative
positions) during collisions and the temperature. Both A and Ea are
approximately constant over a moderate range of temperature (50K) [29].
The order of Ea values for Pb, Zn and Cd is (19.2, 32.1, 83.9kJ/mol)
respectively. This low value of Ea indicates a reaction rate slightly
sensitive with temperature [30]. So, we cannot explain the mechanism of
the process from activation energy only but needed to use Eyring
equation [31].
The Eyring equation (activated complex theory)
Determination of activation energy, entropy and enthalpy of activation by this equation

Thus, the above general form ofthe Eyring equation or activated
Complex Theory equation, also known as Eyring-Polanyi equation in
chemical kinetics, relates the reaction rate to temperature and is
trivially equivalent to the empirical Arrhenius equation. The results
were calculated from Figures 11 & 12 and shown in Table 8.
Figure 10: The temperature dependence of % uptake of Pb(II) , Zn(II) and Cd(II) ions at pH=6.

Figure 11: The Arrhenius Plots of (a) Pb(II), (b) Zn(II) and (c) Cd(II) at pH= 6.00.

Figure 12: The Activated Complex theory Plots of (a) Pb(II), (b) Zn(II) and (c) Cd (II) at pH= 6.00 .

Table 8: Calculated thermodynamic parameters of activation (AH, ASt, AGt) at pH= 6 and 25oC.

The Eyring-Polanyi equation has been applied to rate processes and
the calculation of values of enthalpies and entropies of activation
without pointing out the significance of the obtained values and the
difference between the activation energy values found by using the
Arrhenius equation.

A plot of (Ln k/T) versus 1/T gives a straight line with a slope of
-ΔHǂ/R from which the enthalpy of activation can be derived and with
intercept of ln (kB/h) +ΔSǂ/R from which the entropy of activation is
derived. From the values of the free energy of activation the real
energy requirements are known, thus, suggesting the use of the
Eyring-Polanyi equation mainly as a tool for gaining a deeper
understanding of the actual processes at work and not only as a tool for
predicting reaction rates based on measured rate constants. This
relation is usually used for the suggestion of a mechanism for a certain
reaction in the following way: the certain reaction is performed at
various temperatures where the reaction rate constant is measured. The
pre-exponential factor A of Arrhenius equation has been related to ΔSǂ
of Eyring equation.
Low values of lnA correspond to negative values of ΔSǂ, the activated
complex in the transition state has a more organized, more ordered and
more rigid structure than the reactants. This happens when bonds are
formed or substances are absorbed, and high values of lnA correspond to
positive (or less negative) values of ΔSǂ, a positive value for the
entropy of activation indicates that the transition state is disordered
(less organized), compared to the state of the reactants. This happens
when bonds are broken or substances are desorbed. The calculated value
of the entropy of activation is used for the suggestion of a mechanism
i.e. in replacement reactions: Associative (ΔSǂ< 0), Dissociative
(ΔSǂ> 0), Interchange (ΔSǂ = 0). [32] In our results in Table 8, the
values of ΔSǂ for Pb(II), Zn(II) and Cd(II) are -188.7, -164.7, -21.3
J/mol.K, respectively all the values of ΔSǂ< 0 indicated that the
process has Associative mechanism. The relation between Ea of the
Arrhenius and ΔHǂ of the Eyring equation (activated complex theory) is:

There was no comparison between Ea values and the ΔGǂ values that
lead to the conclusion that Ea does not represent the full energetics of
a process. Thus ΔGǂis the critical factor and not Ea. Thus, near room
temperature (the thermodynamic temperature, 25 oC), Ea is roughly 2.5 kJ
mol-1 larger than ΔHǂ. [32] Through Table (4.68) can be calculated
divide between ΔHǂ and Ea for Pb(II), Zn(II) and Cd(II) that equal (2.6,
2.6, 2.5 kJ mol-1) respectively, there results indicated of the
temperature independence on reaction rate and the temperature influences
is room temperature 25 oC [32]. For, so, we needed calculate the free
energies of activation ΔGǂ. It has been found that ΔGǂ gives a more
realistic/true value of the "activation the processes need in order to
take place and not Ea or ΔSǂ alone. The free energy of activation ΔGǂ
includes not only the ΔHǂ component (= Ea-RT) but also the ΔSǂ component
that may be important. The term -TΔSǂ that hΔSǂo be added to ΔHǂ in
order to give ΔGǂ which may be critical,
ΔGǂ = ΔHǂ- T ΔSǂ......(8)
Determines the spontaneity of the reaction ΔGǂ
ΔGǂ greater than zero reaction is spontaneous
ΔGǂ0 = system at equilibrium, no net change occurs
ΔGǂ less than zero reaction is not spontaneous [33]. The results of
ΔGǂ in Table 8 were explaining that all the values of ΔGǂ > 0. So,
this process is spontaneous (physical process).
Distribution Coefficient (Kd)
The distribution coefficient is defined ΔSǂhe final concentration of
metal ion in the sorbed form on polymer divided by its final
concentration in solution. It is regarded a standard parameter in the
assessment of the physicochemical behavior of metal ions between solid
and liquid phases. It is calculated by the following equation.
Kd = qe / Ce = KL qm-KL qe........(9)
Table 9: Distribution coefficient for Pb(II) for different pH values and temperatures.

Where Kd is the distribution coefficient (L/g). Thus, a plot of (qe /
Ce) against (qe) should be a straight line with slope= - K and an
intercept= qm K if Langmuir equation is applicable The distribution
coefficients (Kd) is calculated for the polymer at different pH values
(4.0, 5.0, and 6.0) and temperatures (25°C, 35°C, and 45°C) are given in
Table 9.
Thermodynamics of Adsorption on the Polymer
In order to understand the possible adsorption mechanism involved in
the removal process, thermodynamic functions for the system, including
changes in Gibbs free energy (ΔG°), change in enthalpy of adsorption
(ΔHǂ) and changes in entropy of adsorption (ΔS°), were calculated using
the following equation Using the following equation:

Where Kd is the equilibrium constant, R is the gas constant and T is the temperature in Kelvin.
The plot of lnKd against 1/T for each metal ion gives a linear relationship, where the values of enthalpy (ΔHo) were entropy (ΔSo) are obtained from the slope and intercept of lnKd vs. 1/T plots. AGo was calculated at each temperature using the following equation:

Table 9 present the data of distribution coefficients at different
temperatures and pH values, while Figures 13 show the plots of lnKd
versus 1/T (Table 10).
Figure 13: Plots of ln KdVs 1/T for Pb(II),(a) pH =4.00 (b) pH=5.00 and (c) pH=6.00.

Table 10: Thermodynamic Functions for Pb(II) at T= 298.15 (K).

The results of the studies on the influence of temperature on metal
ions adsorption are presented in Table 10 above. The positive values of
enthalpy indicate that the adsorption removal increased with increase of
the solution temperature. This shows that the adsorption process is an
endothermic one. AG°, ΔHǂ, and ΔS° are the thermodynamic functions
related to the experiment conditions. Spontaneity and favorability of
the adsorption process is established by decrease in Gibbs free energy
values, AG°. The value of AG° between (0.16 - 1.04) indicates the degree
of favorability of the adsorption process, so the values of AG
presented in Table 10 indicate that the adsorption of Pb(II), Zn(II) and
Cd(II) is a favorable process [28]. All the values of AG° are very
small and positive which suggests that the adsorption of metal ions onto
polymer require some small amount of energy to convert reactants into
products [34].
This is agreeing with values of Table 10 which represent to the
degree of favorability of adsorption, the decrease of AG° values of
Pb(II) >Zn(II) >Cd(II). As shown in Table 10 all AH values are
positive this suggests the endothermic nature of metal adsorptions. One
possible explanation of this is the well-known fact that heavy metal
ions used are well solvated in water. In order for these ions to be
adsorbed, they are denuded to some extent of the hydration sheath. This
dehydration process of ions requires energy for removal of water from
ions is essentially an endothermic process [35]. We assume that the
energy of dehydration exceeds the exothermicity of the ions attaching to
the surface [36]. The implicit assumption here is that after adsorption
the environment of the metal ions is less aqueous than it was in the
solution state.
The endothermic interactions between polymer surface and metal ions
were accompanied by small positive values of entropy, which wΔS⫲he
driving force for adsorption. The positive values of AS signify an
increased state of randomness at the solid- solution interface following
adsorption. Also the positive entropy of adsorption reflects the
affinity of adsorbent for metal ions used. The adsorbed water molecules,
which are displaced by the adsorbate species, gain more translational
energy than is lost by the adsorbate ions, thus allowing the prevalence
of randomness in the system [28]. The entropy changes were most likely
to be due to structural changes and adjustments in the adsorbate as well
the adsorbent. The structural changes arise from the release of ions
like H+ from the polymer surface into the solution and also from partial
solvation of the metal ions in water. The adsorptions of Pb(II), Cd(II)
and Zn(II) on polymer were associated with entropy decrease in
conformity with the general situation of ions existing in a more chaotic
random distribution in aqueous solution compared to their adsorbed and
immobilized states [37].
Column Experiments
Metal ion uptake by the polymer
The metal ion uptake by the polymer using column experiment for
Pb(II), Zn(II) and Cd(II) was determined at pH 6.0 and 25.0 oC, initial
concentration of 150.0 mg/L and a flow rate 1 mL/4min. The uptake for
metal ions is represented in Table 11.
Table 11: Metal iron uptake using column experiments.

It can be seen that the uptake capacities of the polymer with the metal ions fall in the order;

This result is similar to the order of the metal ions in the batch
experiment. However, the values of percent uptake for the metal ions in
column experiment are lower than those obtained in batch experiments,
because in order to achieve the complete saturation a much greater time
is needed. On the other hand, there is no mechanical shaking associated
with the column experiments, which result a decrease in percent of metal
uptake.
Desorption Studies
Two eluting agents, 0.10 M HNO3 and 0.10 M EDTA were used for removal
of metal ions, keeping the flow rate of elution 1 mL/4 min. The fluent
was collected in five portions, 10.0mL for each portion; the results are
expressed as percent recovery and represented in Table 12. The eluting
agents react in two different ways: HNO3 act as proton-exchange agent
and the second a complex-forming agent as EDTA. Depending on the values
of the % accumulative recovery, in Table 12, the following trend was
observed for the eluting agents of metal ions from the polymer:
0.1M HNO3 > 0.1M EDTA
Table 12: Desorption of Pb(II), Zn(II) and Cd(II) ions from the polymer.

The experiments confirmed that maximum metal desorption can be
achieved with mineral acids in concentrations of 0.1M solutions. This
could be attributed to cation exchange between the proton and metal
sorbed. However, this method is more complex than protonation [8,38].
Conclusion
In this study, we prepared a polymer containing phthalate function
group and capable of adsorbing the metal ion by solution
polycondensation and characterization of poly(1,4- benzenedimethelene
Phthalate). The structure and properties of polymer was confirmed by
FT-IR, 1H NMR, 13C NMR, elemental analysis, SEM and thermal analysis.
The sorption properties of the synthesized polymer toward Pb(II),
Zn(II), and Cd(II) in aqueous solutions were examined under various
experimental conditions using both batch and column experiments. The
effective desorption for the metal ions was studied, and the coefficient
of recovery of sorption ability was also investigated. The polymer has
high sorption rate for Pb(II) observed during the first 24h with high
percentage of uptakes toward Pb(II), Zn(II) and low percentage of
uptakes toward Cd(II) ions. The influence of different pH on metals
uptake showed that the metal-ion uptake by the polymer increased with
increasing pH and reached a maximum at pH=6 for Pb(II), Zn(II), and
Cd(II). The best conditions for adsorption of metal ions and maximum
adsorption capacity (qm) on polymer surface are pH=6, T= 45°C and
initial metal concentration of 150 ppm.
The obtained adsorption data showed fitting for Langmuir, Freundlich
and Dubinin-Radushkevich adsorption isotherm models. The application of
the Eyring equation to literature data i.e. the calculation of AH+, AS+
and AG+, has pointed out that in geochemical transformations it is
necessary to calculate the entropy of activation along with the enthalpy
of activation in order to fully characterize a process energetically. A
column packed with the polymer has good metal uptake properties toward
all metal ions, and followed the order: Pb(II) > Zn(II)> Cd(II) at
pH 4.0 and 25 oC and flow rate 1 mL/4min. The efficiency of recovery of
metal ions after adsorption can be carried out by treatment of the
loaded polymer with 0.1M HNO3 and 0.1M EDTA with good percent recovery.
Acknowledgements
The authors would like to thank the Deanship of Academic Research and
Quality Control (DAR) of The University of Jordan for supporting this
work and all supervisors who worked in the improvement of this work.
Read More Lupine Publishers Chemistry Journal Articles:
https://lupinepublishers-chemicalsciences.blogspot.com/


