Wednesday 30 September 2020

Lupine Publishers | Information and Communication Technology Roles in Improving Women Farmers Access to Agricultural/Agribusiness Services in Orlu Agricultural Zone of Imo State, Nigeria

    Lupine Publishers | Current Investigations in Agriculture and Current Research


Abstract

This study examined Information and Communication Technology (ICTs) roles in improving women farmer’s access to agricultural services and agribusiness in Orlu Agricultural Zone of Imo State. Data were collected with structured questionnaire distributed to 110 respondents randomly selected from the 10 extension blocks in Orlu Agricultural zone. Data collected were analyzed using percentages, mean scores and standard deviation. The results obtained showed that ICT devices available in the area included radio, mobile phones, television and newspaper among others. However, mobile phone is the most readily available (ICT) device (87.3%), followed by Radio (74.5%). It was also observed that ICTs play significant roles in improving women’s access to agricultural service and agribusiness as as indicated by a mean score of 2.50 Several factors constrained the use of ICT devices. Among these factors were; network problems/connectivity(M=4.00), high cost of ICT devices (M=3.47), widespread illiteracy (M = 2.96), low level of awareness (M=2.55), poor saving ability (M=2.47), insufficient income (M=2.12), and language illiteracy (M=2.00). This study thus recommended that government should provide rural infrastructure especially electricity supply, good road network etc in the study area, establishment of ICT centers where farmers can acquire practical computer training for the enhancement of ICT use. Information on agricultural services and agribusiness should be made available to farmers through their mobile phones in their local language and it should be timely for effective utilization.

Keywords: Agriculture; Agribusiness; ICTs; Farmers; Services; Market; Women

Introduction

Globally, agriculture takes center stage as the engine that can transform nations’ economies. Similarly, the place and role of smallholder farmers from local to global levels are recognized by the respective governments and international partners as a way to avoid age-old problems like hunger and miserable lives. Currently, it is believed that smallholder farmers can feed the world’s undernourished people [1,2]. Accordingly, agriculture employs about 62% of the population in SSA (excluding South Africa) and generates about 27% of the Gross Domestic Product [3]. Agriculture accounts for the vast majority of the poor’s livelihood activities and also holds the most promise for pro-poor economic growth [4]. Smallholder farmers, mostly women, who produce the majority of agricultural products, face various challenges, including access to adequate information, services, and key value chains [5]. Many women experience a life that is a complex web of multiple roles and multi task. This requires an average woman to conduct different roles at different times in a bid to fulfill her family needs. Women especially those in the rural areas are extensively involved in serious farm operation and agricultural activities. Women make up over half the agricultural labour force, yet they are frequently subject to discrimination. They play a vital but under-recognized and unsupported role in food production. Looking at the national average of women in the agricultural labour force, they vary but globally they have a principal role in agro business, food processing and consumer related activity [6].

In Nigeria, women consist 60 – 80 percent of labour in agriculture starting from production, processing and marketing of food. These women have their own farms and also assist in the family farms [6]. This has made the Nigerian women to be in a position to contribute to food supply. Despite outnumbering the men farmers, they are still not usually seen as the “typical farmer” by policymakers and administrators such as extension officers and are therefore often bypassed by agricultural services [7]. Women’s potential to become successful farmers have also been limited due to the fact that they are facing many other obstacles and challenges such as lack of access to productive resources, information and credit [8]. In addition, women’s social networks are often more local, connected to the rural village and therefore often more restricted than men’s, whose mobility is often greater and reaches outside the borders of the village. Since most information channels in Nigeria and Africa are built on social networks, women’s networks offer fewer opportunities for learning about, as well as engaging in, new productive opportunities and strategies, leading to underperformance of the sector, which is bad for the country and rural development at large [9]. There lies both an instrumental and intrinsic value in enabling women to optimize their production to the same extent as men [8]. When it comes to the former, research shows that women’s agricultural productivity can increase around 20-30 percent, if women would get the same kind of access to productive resources that men have.

Optimizing women’s production should be equally important based on a gender equality perspective and rights-based approach, because they should have the same right to be as productive as men, which in the end would benefit the whole country at large by reducing poverty and hunger. Applying ICT solutions could be a way to “extend the reach of existing information channels thus overcoming barriers women farmers face in accessing information” [9]. A number of studies have shown that ICT can have a positive impact on rural livelihoods and farmers, whether it is by encompassing or by accessing vital market information on a mobile phone [10,11], or by generating thematic maps and online applications to monitor the spread of agricultural pests [12]. In agriculture, information is a critical factor that has always mattered, and even though farmers may have undertaken the same activities for years, decades or even centuries, producers have not always found it easy to obtain answers when conditions for them have changed [13]. Usually for many farmers in low-income countries, information is obtained through a complex web of social networks [9]. Applying modern Information and Communication Technologies (ICTs) such as mobile phones, radios, TVs and Internet services in agriculture may offer a new way of sharing information and knowledge amongst farmers. But due to prevailing inequalities in accessing ICTs, many groups in low-income countries are often left out from using ICTs, especially women [14]. The inequality experienced by women is often referred to as the “gender digital divide”, as empirical evidence shows that women have worse access to, and use ICT less, than men, both in rich and poor countries [11].

Communication is indispensable for all endeavors to bring about a societal change. The emergence of information communication technology (ICT) has enabled to collaborate, interact and information in a fast pace which has brought a greater impact on society. The ICT is a diverse set of technological tools and resources to create, disseminate, store, bring value addition and manage information [15]. ICTs do play an important role in disseminating a wide range of information and advice leading to knowledge and attitude change among rural communities. It is also supporting rural communities to acquire new skills and is also creating new employment opportunities.

Statement of Problem

Increasing production is a major challenge facing present agriculture. Smallholder farmers which dominate the landscape of developing world need to improve farming through acquiring adequate knowledge and information [16]. Farmers exhibit ambiguous risk-averse behavior when they lack information pertaining to the likelihood of occurrence of the possible outcomes of new technology, which might have a detrimental impact on adoption (Tessema, 2016). A mix of several factors prevents the adoption of new agricultural technology and innovation by farmers and involves the level of education, individual risk preferences, capital, perception, as well as inputs such as land, labour and credit, as well as access to information [16]. Relevant and suitable information on best practices, new technologies, postharvest handling, and value-addition are key in order to boost productivity [5]. According to Asayehegn (2012), in Ethiopia most agents use individual extension methods (farm or home visits and use of contact farmers) to communicate and to disseminate agricultural technologies to farmers. Agents are also working under areas characterized by lack of infrastructural facilities such as transportation. This situation is the same in Nigeria where conventional extension methods such as farm or home visits and the use of contact farmers do not provide the needed agricultural information on timely basis (Deribe.K, 2011).

The impact of mobile phones on development will, however, in the end be determined not only by the number of owners of SIM cards and subscription rates, but also by the actual ways in which mobile phones are used and the benefits that Africans derive from using mobile phones (Bornman, 2012). Again, due to the high extension agent farmer ratio, it is practically difficult to reach the farmers by face-to-face or individual contact methods. The abovementioned problems call for the use of ICTs to support agricultural extension services, because ICTs, particularly mobile phones, can be very effective in delivering timely and relevant information to farmers, even to those living in remote areas. Though the potential of mobile phones is vast, little is known regarding the use of mobile phones in agriculture among women farmers in Nigeria.

Objectives of the Study

The main objective of this study is to analyze the roles of information communication technologies (ICTs) in improving of rural women farmers’ access to agricultural services and agribusiness in Imo state. The specific objectives of this study include to: a. identify ICT devices available to women farmers; b. identify agricultural services available to respondents in the area; determine the roles of ICTs in improving women access to agricultural services and agribusiness; and c. examine perceived constraints to respondents use of ICT devices in the area.

Methodology

The study was carried out in Orlu agricultural zone of Imo state, South-east Nigeria. Imo state is having three agricultural zones namely; Okigwe, Owerri, and Orlu (ADP, 2003). Orlu agricultural zone is made up of eleven (11) LGAs namely; Njaba, Nwangele, Orsu, Oru west, Orlu, Nkwere, Oru east, Oguta, Ideato north, Ideato South and Isu. The state lies within latitudes 4°45°N and 7°15°N and longitude 6°50°E and 7°25°E with an area of around 5,100sq/ km. It is bordered by Abia state on the East, by the River Niger and Delta state on the west, by Anambra state to the North, and River state to the south (IMSG, 2001). The estimated population of Imo state as of 2018 is 5.8million with a population density that varies from 230-1,400 people per square kilometer (NPC,2006). The rainy season spans from March to October and is bimodal with a twoweek break in rainfall in August (August break). The main annual rainfall in the state is between 25°c and 28°c with relative humidity of about 98% during the raining season and between 50% and 60% during dry season. The major arable crops grown are Cassava, Yam, Plantain, Banana, Maize, Melon, Sweet potato and Vegetables such as Okra, pepper, tomato and telfaira (ADP,2003).

Sample and Sampling Technique

Orlu agricultural zone has 10 extension blocks and 107 extension circles manned by extension agents. All ICT women user farmers in the zone constitute the population of the study. A list of all registered ICT women user farmers in the zone was obtained from ADP office in the zonal headquarters. The list has a total number of 1,100 ICT women user farmers and 10% of the total number was randomly selected which gave a total sample size of 110 ICT women user farmers.

Method of Data Collection

The study made use of both primary and secondary data. The primary data were collected from field investigation or survey using structured questionnaires and interview schedule. Secondary data sources were utilized to provide background information and other, necessary to achieve some objectives of the study. Such secondary data includes textbooks, reports, journals, publications and proceedings. Enumerators were trained and used.

Method of Data Analysis

Basically, data were analyzed using descriptive statistical tools such as mean, standard deviation, bar graph and percentages. This was used to analyze all objectives of the study. A four (4) point liker type scale of strongly agreed (SA), agreed (A), disagreed (D) and strongly disagreed (SD) assigned values of 4,3,2 and 1 was used to achieve objective 3. The scores were added together to give 10 and was divided by 4 to give a discriminating index of 2.50. Therefore, a mean of 2.50 and above was adjudged okay and accepted as role of ICTs in helping women farmers gain access to agricultural services while any value between 2.50 was not accepted. While objective (4) was analyzed on a 4 point like type scale of very important constraints (VIC), important constraints (IC), less important constraints (LIC), not important constraints (NIC) assigned scores of 4,3,2 and 1, added together to give 10 and divided by 4 to give a discriminating index of 2.50. Mean values 2.50 and above were taken as constraints while mean values below 2.5 were not constraints of ICT use in gaining access to agricultural services.

Results and Discussion

ICT devices available to women farmers

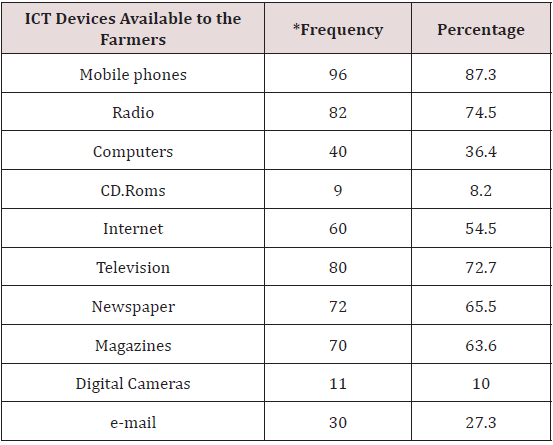
Table 1 showed the different ICT devices available in the study area. Mobile phones, radio and television are the most available ICT devices in the study area with a percentage of 87.3%, 74.5% and 72.7% respectively. This means that these devices are the most common sources of technological information and dissemination of innovation in the area. Newspapers with 65.5%, magazines and internet with percentage of 63.6% and 54.5% respectively also indicate that information can be sourced through them. Computer and E-mail with percentage of 36.4% and 27.3% respectively are also sources of information. On the other hand, digital cameras which has a percentage of 10 is not readily available to everyone. This could be due to high cost or illiteracy of the respondents. CDRoms have the least percentage of 8.2%. Not many people have this device.

Table 1: shows the ICT devices available to the farmers.

Lupinepublishers-openaccess-Agriculture

Source: Field survey data 2017. *Multiple responses.

The above agrees with Singh et al (2015) reported that Agriculture Information System (AIS) is a computer-based information system which contains all the interrelated information which could really help farmers in managing information and policy decision making. The ICT devices that help facilitating farming activities encompassed applications like radio, television, cellular phones, computers, tablets and networking, hardware and software, satellite systems [17,18]. In the same way, Yimer [19]; Munyua [17] reported that radio is extensively used to inform users on agricultural topics, including new and upgraded farming techniques, production management, and market information. This shows that farmers may take advantage of using radio in the absence of technology especially rural farmers. The Internet and web-based applications are extensively used in sharing and dissemination of agricultural knowledge, marketing of goods and services.

Agricultural/agribusiness services in the study area

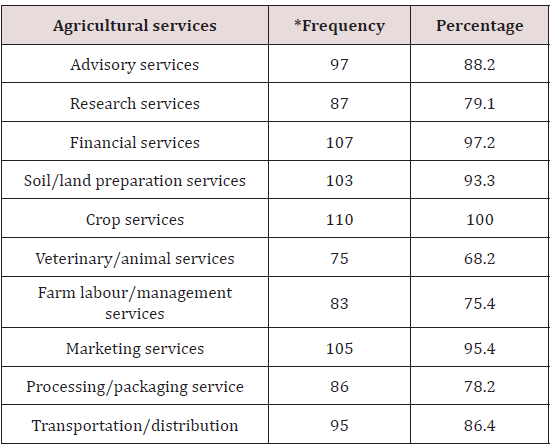
Table 2 showed that numerous agricultural/agribusiness services that exist in the study area. These services included advisory services (88.2%), research services (79.1%), financial services (97.2%), and market services (95.4%). Advisory services here means that farmers need advice on a variety of agricultural business opportunities to be explored. They need information on solving farm problems, training/education, among other services. Research services here means that farmers should be kept abreast of the latest developments/innovations in agriculture. Their problems need to be solved by research institutes which serve as centres of innovations who proffers solution and get back to them through communication with the change agent. Financial serves are very important in agric-business for farmers to optimize production and maximize income. They need credit, savings, payments/transfer and also insurance to cover crop and livestock losses. Market is important for farmers to improve their production systems, so they can fetch better prices, avoid gluts and have what it takes to grow market-led crops.

Table 2: Agricultural/agribusiness services of respondents.

Lupinepublishers-openaccess-Agriculture

Source: Field survey data 2017. *Multiple responses.

Other services include soil/land preparation (93.3%) and crop production services (100%). Soil preparation services includes plowing, application of fertilizer, seed bed preparation and other services for improving the soil for crop planting, while crop services includes crop planting, cultivating and protecting, cultivation services, disease control of crops, entomological services, irrigation system operation systems, orchard cultivation services, seeding crops, pruning of orchard trees and vines, and weed control); crop harvesting by machine; crop preparation services for market. Animal/veterinary services (78.2%), and farm labour service (75.4%), includes animal hospitals, veterinarians and veterinary services for livestock, and animal hospitals, veterinary services for pets. Animal services, including livestock services (e.g., artificial insemination services, livestock breeding, milk testing, cattle spraying, vaccinating livestock, sheep dipping and shearing, and custom slaughtering) and animal shelters. Farm labor and management services includes farm labor contractors and crew leaders, and farm management services; and processing/ packaging services (78.2%) and transportation/ distribution services (86.4%) (e.g., sorting, grading and packing of fruits and vegetables, grain cleaning and fumigation, drying of corn, fruits and vegetables); and cotton ginning.

ICT roles in improving access to agricultural/ agribusiness

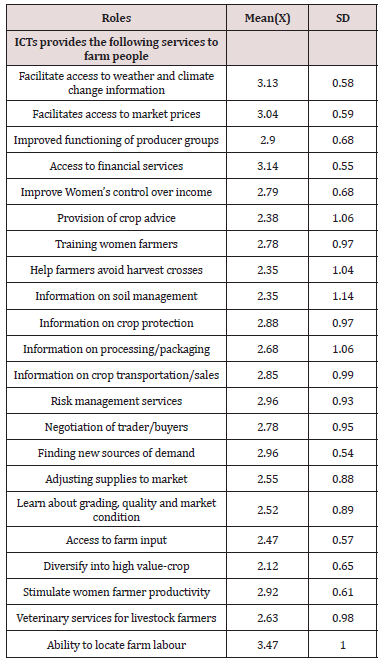
ICTs play great roles in providing access to agriculture services to women farmers. With a discriminating mean (M) index of 2.50, ICTs play the following roles - ability to locate farm labour (M = 3.47), which is usually done by making voice calls on the person, gain access to financial service (M = 3.14), which includes information on credit, loan and levies, facilitate access to weather and climate change information (M = 3.13), access to market prices (M = 3.04), risk management services(M= 2.96), finding new sources of demand (M = 2.96), improved functioning of producer groups (M = 2.90), information on crop protection (M = 2.88), information on crop transportation\sales M = 2.85, improved women’s control over income (M = 2.79). Speaking on the importance of ICTS in providing access to agricultural and agribusiness services, Chavula (2012) said ICTS help extension workers and researchers to adopt improved agricultural practices and disseminate them to farmers. They provide agricultural information that is relevant to farmers such as agricultural and farming techniques, commodity prices and weather forecasts to farmers. The utilization of ICTS especially mobile technologies help agricultural producers who are often unaware of commodity process in adjacent markets and rely on information from traders in determining when, where or for how much to sell their produce to have relevant and timely information to this regard. Delays in obtaining this information or its misinterpretation by traders has serious consequences for agricultural producers, leading to charging low prices or high/low produce supply in the markets [20]. Other areas were training women farmers (M=2.78), negotiating with trader\buyers (M=2.78), information on processing\packaging (M=2.68). Akor and Mbiti (2010) opined that ICTS facilitates information flow and can have communication between buyers and sellers leading to lower communication costs, thereby allowing individuals and firms to send and acquire information quickly and cheaper (Table 3).

Table 3: Roles of ICT in Agricultural services/Agribusiness.

Lupinepublishers-openaccess-Agriculture

Field survey, 2017 Mea score 2.50 and above accepted.

This makes market operate more efficiently, hence increase the overall production in agricultural sector and growth of the economy as a whole [21]. ICTS facilitates agricultural growth because they increase the efficiency of market interactions and provide access to real-time information mainly by enhancing farmers access to use of trading platforms over the internet through web/mobile application [22]. Finally, veterinary services for livestock farmers (M=2.63), adjusting supplies to market (M= 2.55), learn about grading, quality and market condition (M= 2.52), provision of crop advice (M= 2.38), access to farm input (M= 2.47), information on soil management (M = 2.35), help farmers avoid harvest losses (M = 2.35), diversify into high value crop (M= 2.12) and finally, stimulate women farmers productivity (M= 2.92). ). They allow people to obtain information immediately on a regular basis as compared to other information channels. The utilization of ICTS especially by using mobile phones reduces search costs, improve consumers welfare and reduces trade/market monopoly if not complete disruption of the monopolistic idea/practices.

Problems facing respondents use of ICT devices

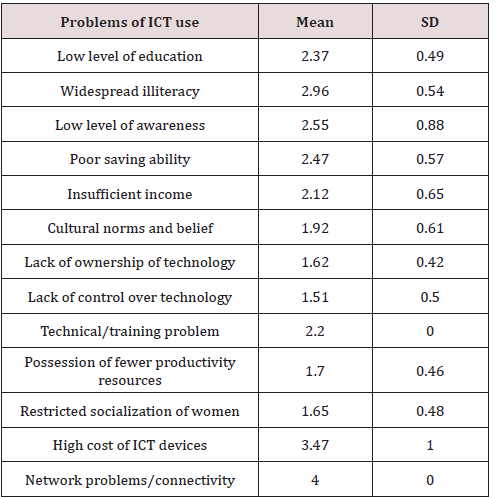
Table 4 showed that numerous problems face respondents in use of ICT devices as indicated by high mean (M) responses, which includes- network problems/connectivity (M=4.00), high cost of ICT devices (M = 3.47), widespread illiteracy (M = 2.96), low level of awareness (M =2.55), poor saving ability (M 2.47), insufficient income (M=2.12), technical/training problems of farmer part (M=2.20). This affirms FAO (2000) stand that the update and harnessing of information is limited by the lack of trained personnel or lack of access to know how. Other constraints that also faced respondents use of ICT devices included; cultural norms and belief (M = 1.92), possession of fewer productivity resources (M=1.70), restricted socialization of women (M= 1.65), lack of ownership of technology (M=1.62), lack of control over technology (M= 1.51) and low level of education (M = 1.37). The above agrees with previous studies that inadequate, and unstable power supply, cost of hardware and software are high with respect of average rural dwellers [23]. Similarly, Taragona [24] maintains that awareness, time, cost of technology, system integration, and software availability are the main constraints of ICT adoption in horticulture.

Table 4: Problems facing respondents’ use of ICT devices.

Lupinepublishers-openaccess-Agriculture

Field survey 2017. Mean response 2.50 and above accepted.

Conclusion

From the study, one can conclusively say that mobile phones, radio and television were the most accessed and utilized ICTs devices among the respondents. However, the extent of access and utilization of contemporary ICTs devices such as CD-Roms, digital camera are still very low. There was a high perception of positive effect of ICT in improving women’s access to agricultural services and agribusiness, however, the use of these ICT devices are limited by some factors. Therefore, there is need to encourage ICT user farmers in the area, by making available all that are necessary for successful ICT usage. Including training in order to promote maximum gain and utilization of technological information which will lead to improved access to agricultural services thereby improving farmers practices, increased productivity as well as bettering standard of living of the farmers.


Read More Lupine Publishers Agriculture Journal Articles:

Monday 28 September 2020

Lupine Publishers | Allele Mining for the Reported Genes Governing the Yield Related Traits in a Set of Rice Germplasm Using PCR-Based Markers

   Lupine Publishers | Current Investigations in Agriculture and Current Research


Abstract

The present study was an initial attempt towards enhancing grain yield in rice through molecular breeding approach by allele mining. Forty one diverse rice genotypes were used for allele mining study with an objective to detect among them superior alleles for rice grain dimensions viz. grain length, grain width, grain thickness, grain size and grain weight. SSR markers associated with reported genes for these traits were used for PCR amplification. It was found that SSR primer RDD 1-2 can be used for identifying alleles enhancing grain length from diverse genomic sources for crop improvement. The allele A (600 bp) from Rdd 1 can be used in breeding programmes to enhance grain length in rice. The genotypes viz. Hans raj, Pant dhan-18, Pant dhan-10, Narendra, Pant dhan-12, Pant dhan-4, ARR-09, Shahsarang, IVT-ASG-2712, IVT-ASG-2701, AVT-I-ASG-2602, AVT-I-ASG-2609 and IVT-ASG-2705 identified carrying this allele can be used as a source for large grain length in future. The primers RM 478 for grain thickness and RM 574-2 for grain width can be used in marker assisted breeding programmes. Allele A (205 bp) of RM 478 and allele B (240 bp) of RM 574-2 associated with low grain weight and grain width, respectively can be used for rejection at seedling stage in marker assisted breeding programme. This study also identified novel alleles (alleles distinct from those reported in biparental programme) which could be significant in a larger panel of rice genotypes.

Keywords: Allele mining; rice;Oryza sativa; O. nivara; SSR primers

Introduction

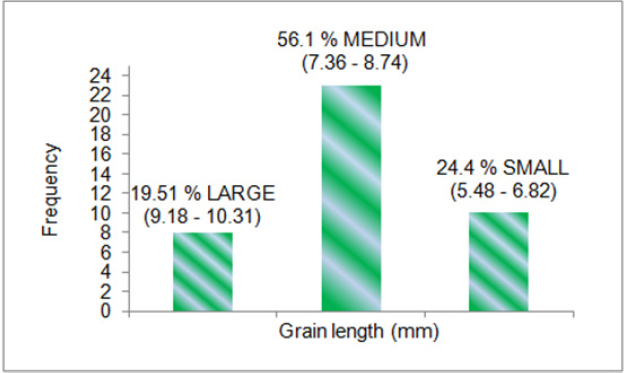
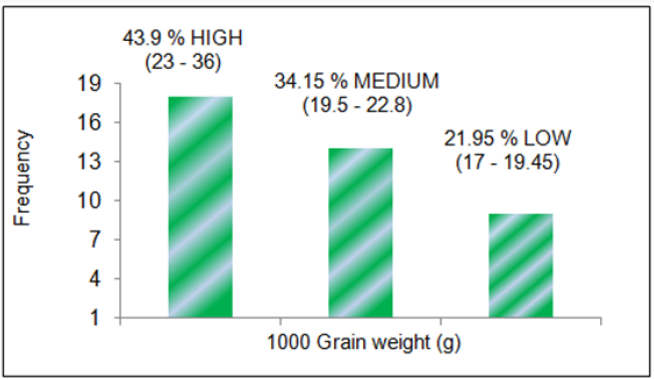
A panel of 41 rice genotypes consisting of the released cultivars of O. sativa, landraces and nineteen accessions from AVT, AVIT and IVT series and two accessions RWR-19 and RWR-125 from wild species O. nivara were used for allele mining study for grain traits contributing to grain yield. The mean data for grain length, grain width and 1000 grain weight was taken for all the genotypes used for allele mining study. The 41 rice genotypes were categorized into three groups in order of their grain dimensions and 1000 grain weight. The genotypes consisted of 39.02 % large (2.49-3.62), 51.22 % medium (2.01-2.44) and 9.76 % small (1.85-1.97) for grain width in mm; 19.51 % large (9.18-10.31), 56.1 % medium (7.36-8.74) and 24.4 % small (5.48-6.82) for grain length in mm; 43.9 % high (23- 36), 34.15 % medium (19.5-22.8) and 21.95 % small (17-19.45) for 1000 grain weight in grams. F-test was conducted for analysis of variance in phenotypic traits between the genotypes. Significant variation at 5% level was observed for grain length (F=9.61) and grain width (F=6.10). Allele mining for grain yield contributing traits viz. grain length, grain weight and grain width was done for the reported gene Rdd1 and the QTLs tightly associated with the traits with an aim to identify alleles of genes conferring the grain yield traits. The genes/QTLs associated with these three-grain yield contributing traits viz. grain length, grain width and 1000 grain weight targeted in this study included Rdd 1 (Rice dof daily fluctuations 1), gw8 (Grain width 8), gt7 (Grain thickness 7), gw 8.1 (grain weight 8.1), G S5 (Grain size 5), and gw7 (Grain weight 7), all previously reported to be associated with grain yield traits in biparental studies (except Rdd 1).

Scoring of PCR products was done through gel electrophoresis by comparing the size of the bands of the PCR products using a gel documentation system. The markers showing bands of similar positions in gels for all the genotypes were monomorphic markers while those markers showing bands at different position were polymorphic markers. All the genotypes that show products of similar size with that of expected amplicon size for the reported trait will carry the desired allele for grain yield and likewise the alleles for all the target regions were identified. PCR-based allele mining for these traits was performed in a panel of 41 genotypes using 10 microsatellite markers reported to be tagged with these genes/QTLs. Ten microsatellite markers were used for allele mining; out of which nine markers (RDD1-2, RM 234, RM 478, RM 23201, RM 502, RM 574-1, RM 574-2, RM 593-1 and RM 593-2) amplified. Out of these nine markers, RM 23201 was monomorphic and the rest were polymorphic. Maximum number of four alleles was found for marker RM 478 and RM 574-2, three alleles for RDD I-2 and RM 234 and two alleles for RM 502, RM 574-1, RM 593-1 and RM 593-2 when scored in agarose gel. Chi square test was conducted to study the association of the markers with grain traits [1]. Each of the alleles observed in the top 15 and bottom 15 genotypes were tested for the consistency of their distribution with the whole population. Significant associations were observed for allele A in 15 largest genotypes (Χ2=3.94, p=0.05) and B allele (Χ2=4.51, p=0.03) in the 15 smallest length genotypes for primer RDD 1-2. Allele A was found to be associated with large grain length and allele B was found to be associated with small grain length. The genotypes viz. Hans raj, Pant dhan-18, Pant dhan-10, Narendra, Pant dhan-12, Pant dhan-4, ARR-09, Shahsarang, IVT-ASG-2712, IVT-ASG-2701, AVT-IASG-2602, AVT-IASG-2609 and IVT-ASG-2705 were found to contain A allele found to be associated with large grain length for RDD 1-2 marker. Significant association was observed in marker RM 478 with grain weight and for distribution of A allele in the bottom 15 genotypes (lowest grain weight) with the distribution in the overall population (Χ2=5.08, p=0.02) and for primer RM 574-2, distribution of B allele (Χ2=4.3, p=0.08) in the bottom 15 genotypes (smallest grain width) was observed to be significant.

From this present experiment, hybrid plants from inter-specific crosses can be used for backcrossing in future plant breeding programmes. Crosses can also be attempted for genotypes that failed during this experiment. Primer RDD 1-2 can be used for identifying alleles enhancing grain length from diverse genomic sources for crop improvement [2]. The allele A (600 bp) from Rdd 1 can be used in breeding programmes to enhance grain length in rice. The genotypes viz. Hans raj, Pant dhan-18, Pant dhan-10, Narendra, Pant dhan-12, Pant dhan-4, ARR-09, Shahsarang, IVTASG- 2712, IVT-ASG-2701, AVT-IASG-2602, AVT-IASG-2609 and IVT-ASG-2705 were identified to be carrying this allele can be used as a source for large grain length in future. The primers RM 478 for grain thickness and RM 574-2 for grain width can be used in marker assisted breeding programmes. Allele A (205 bp) of RM 478 and allele B (240bp) of RM 574-2 associated with low grain weight and grain width, respectively can be used for rejection at seedling stage in marker assisted breeding programme. This study also identified novel alleles (alleles distinct from those reported in biparental programme), which could be significant in a larger panel of rice [3].

Materials and Methods

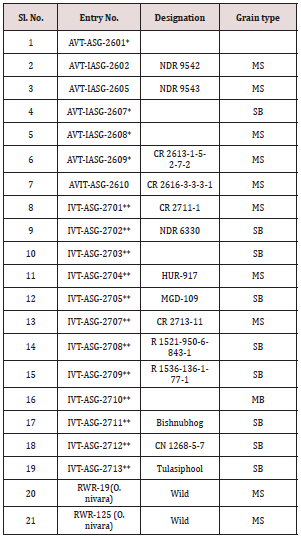
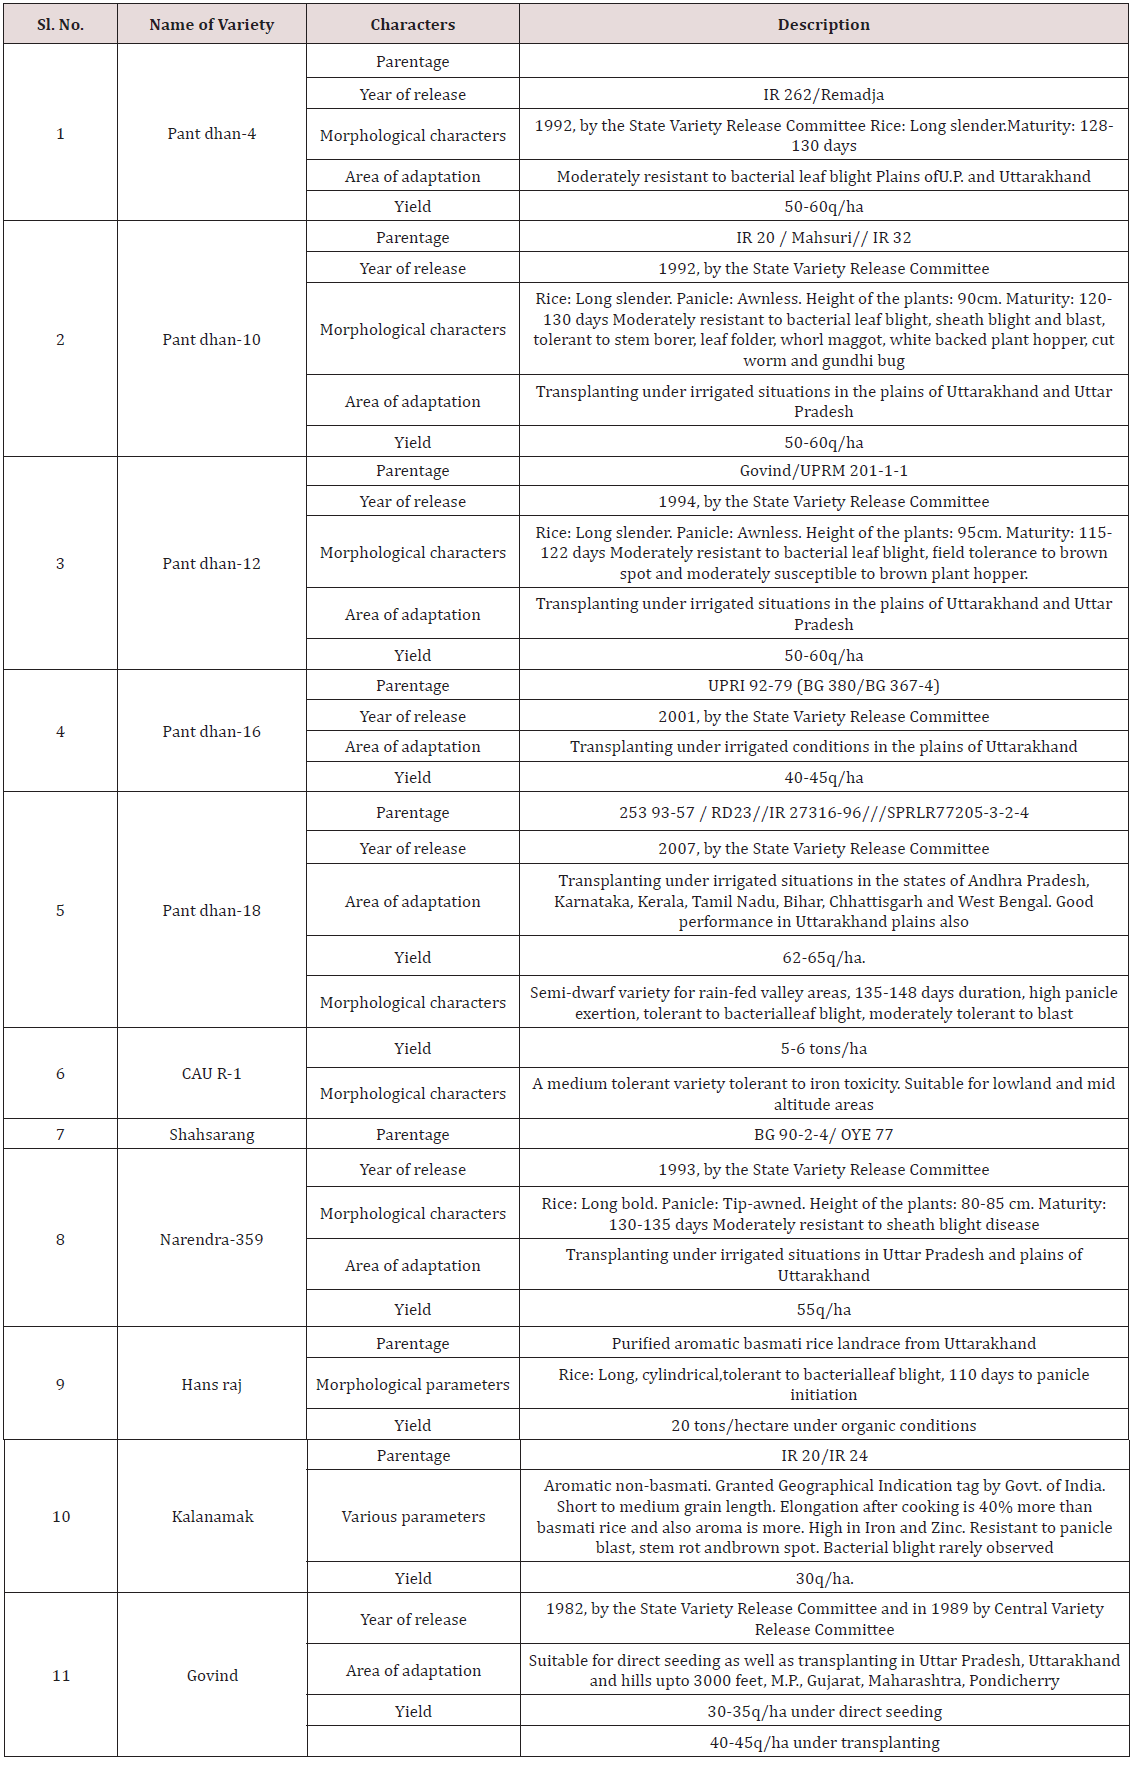
A panel of different rice genotypes including released cultivars of O. sativa i.e., IR-1552 (LR-55), Govind, CAU R-1, Kalanamak, Hansraj, Pant dhan-4, Pant dhan-10, Pant dhan-12, Pant dhan-16, Pant dhan-18, Narendra-359, landraces like ARR-09, LR-1 (Balwai), LR-5 (Laljagli), LR-23 (Sabhagidhan), LR-71 (Basmati paddy), LR- 77 (BR-1),Shahsarang, Bhasphool (LR-2), Chakaoporieton (LR- 26), and nineteen accessions from AVT and IVT series and two accessions RWR-19 and RWR-125 from wild species O. nivara were used for allele mining. The experimental material seed of Pant dhan was obtained from Pantnagar and seed of AVT, AVIT and IVT series have been procured from DRR (Directorate of Rice Research), Hyderabad (Tables 1-3) [4].

Table 1: Description of different rice (O. sativa and O. nivara) genotypes used for allele mining.

Lupinepublishers-openaccess-Agriculture

*- Advanced varietal trial; **- Initial varietal trial; SB: Short bold; MS: Medium slender/Mild scented; LS: Long slender; SS: Strong scented.

Table 2:

Lupinepublishers-openaccess-Agriculture

Table 3:

Lupinepublishers-openaccess-Agriculture

Statistical analysis of seed parameters for grain size variance in 41 rice genotypes

The grain size of rice is contributed collectively by a complex of yield related traits of which grain length, grain width and grain weight also play a major role. Given prior concern to these three traits, a set of data for average grain length, grain width and grain weight has been taken for all the genotypes used for allele mining.

Phenotypic analysis/Analysis of variance

The frequency distribution in percent for grain length, grain width and grain weight was determined for large, medium and small grains in the population of 41 genotypes. Analysis of variance for significance of phenotypic variations for grain length and grain width of 41 genotypes was studied through F-test (Table 4).

Table 4:

Lupinepublishers-openaccess-Agriculture

Germination and sowing of seeds

Sowing of seeds used for allele mining study was done in the month of February 2014 (Table 4). Prior to sowing, seeds of all the genotypes were first allowed to germinate in sterilized Petri plates containing filter papers moistened with water. Upon germination, the seeds were transferred to shallow plastic trays and the genotypes were grown in rows with each genotype in a single row having at least twenty seedlings per row [5]. The soil was finely prepared free of clods and was mixed with farm yard manure. The trays containing the plants were kept inside the greenhouse and the plants were maintained by regular watering and also weeding as and when required.

Molecular Characterization

SSR analysis for polymorphism

Rice dof daily fluctuations1 (Rdd1), Grain width5 (GS5), Grain thickness (gt7) and Grain weight8 (GW8) previously reported to be linked to the grain traits/QTLs were used for allele mining studies in different rice genotypes. Forty one rice genotypes including two accessions of O. nivara were used for allele mining studies to detect the existing alleles among the genotypes for the given traits. Markers for these reported genes were obtained from Gramene marker database. Genomic DNA from rice leaves of all the genotypes were isolated using CTAB method of Doyle [3]. The DNA samples were diluted to obtain a working standard according to the concentration and the quality of the DNA obtained. The PCR reaction conditions for primers were standardized to obtain good quality bands and were used as the standard reaction conditions throughout the whole PCR amplification process [6].

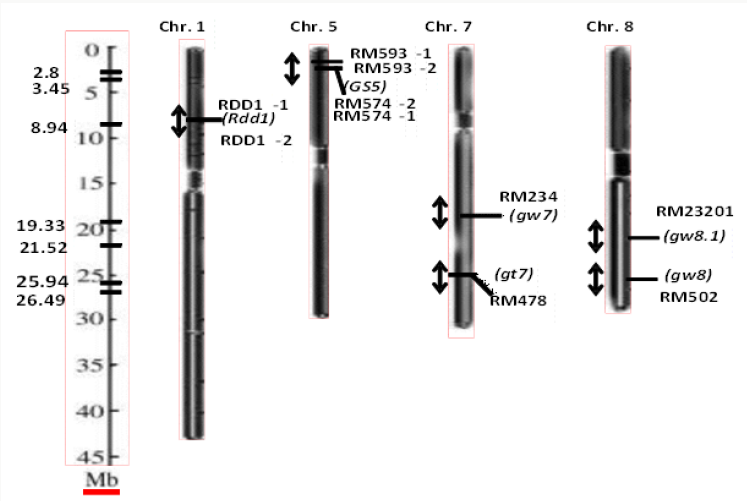
The three yield contributing traits namely grain length, grain width and grain weight was targeted in this study. The gene Rdd1 has been reported to be indirectly related to increase in grain size in rice. Since increase in grain size is constitutively contributed by grain traits which include grain length, the RDD1 markers associated with this gene has been used in allele mining for grain length trait. Gs 5 is a reported QTL which has been known to associate positively with grain width and thus contributing to grain size and the RM markers reported to be associated with this gene and flanking at the regions near it were used for allele mining study. Another QTL, gw 8, known to positively control grain width and QTLs; gt7, gw 8.1 and gw 7 for grain weight were targeted for allele mining in the present study (Figure 1).

Figure 1: Chromosome map showing genes/QTLs (italicized) associated with grain yield traits and the position of the markers (designated as RDD 1 and RM) linked to these traits respectively, in rice. The scale of the maps in megabase is shown on the left axis.

Lupinepublishers-openaccess-Agriculture

Isolation of Genomic Dna from Plant Tissue

Genomic DNA was isolated from genotypes used for allele mining. Tender leaves from young rice seedlings were used for the extraction of genomic DNA. Genomic DNA from rice leaves was isolated using CTAB method of Doyle [3]. Young actively growing leaves of 15 days-old plants were collected and used for DNA extraction.

Procedure for DNA extraction

About 2g of young fresh plant leaf tissue was rapidly frozen in liquid nitrogen and ground to a fine powder in a pre-chilled sterile pestle and mortar. The frozen powder was transferred to a 2ml tube. 1ml of CTAB extraction buffer was added to each tube and tubes were inverted several times with gentle shaking. The tubes were incubated at 65 0C in a water bath for 1 hr. Contents were mixed by inverting the tubes after every 10-15 minutes. The tubes were cooled to room temperature and 1 ml of chloroform: isoamyl alcohol in the ratio of 24:1 was added to each. The contents were mixed by inverting the tubes several times. The tubes were centrifuged at 10,000 rpm for 10 minutes at 4 0C. The upper clear aqueous supernatant was removed and transferred to fresh tubes. 1ml of pre-chilled isopropanol was added to each tube and the contents were mixed by inverting the tubes several times and the tubes were kept overnight at -20 0C. Although DNA precipitation began as soon as isopropanol was added, it was kept overnight for better and complete precipitation. The samples were centrifuged for 10 minutes at 5,000 rpm at 4 0C. The solution was poured without disturbing the DNA pellet at the bottom of the tubes. 1.5ml of 70% ethanol was added and then centrifuged at 5,000rpm for 5 minutes at 4 0C. Supernatant was decanted. Pellet was air dried for 15-20 minutes. 50μl of TE buffer was added to the pellet [7].

DNA quantification

The quantification of DNA was done by staining DNA with ethidium bromide after electrophoresis in 0.8% agarose gel at 100V for 1 hour in TBE buffer (0.04M Tris borate, 0.001 M EDTA, pH 8.0) using known DNA concentration standard.

Dilution of DNA samples

A part of the DNA sample of each genotype was taken and dilution of each sample was made with appropriate amount of TE buffer to yield a working concentration and stored at -20°C for further use in PCR amplification.

Polymerase chain reaction (PCR)

Dilution of SSR markers: The SSR markers which were in lyophilized state were centrifuged and diluted with TE buffer accordingly to yield 100pmol/μl stock concentration and from the stock, working concentration of 10pmol/μl was made by diluting at 1:9 ratio of stock with TE buffer. The primer stock was immediately transferred to -20 °C to prevent degradation during longer duration storage and the working standard was kept in 4 °C for use in the study.

Standardization of PCR conditions

Standardization of annealing temperature: Annealing temperatures for each of the primers was standardized by PCR reaction at least three different PCR conditions. The reaction condition giving amplification with good bands were taken as the standard for all the following experiments.

PCR conditions for markers used for allele mining

Primary denaturation: 95 °C for 3 minutes

Denaturation: 95 °C for 0.30 minutes

Annealing: 55 °C for 0.45 minutes

Extension: 72 °C for 0.40 minutes

Final extension: 72 °C for 2 minutes

Number of cycle: 32

Allele mining of reported genes/ QTL for yield related grain traits in rice using SSR markers

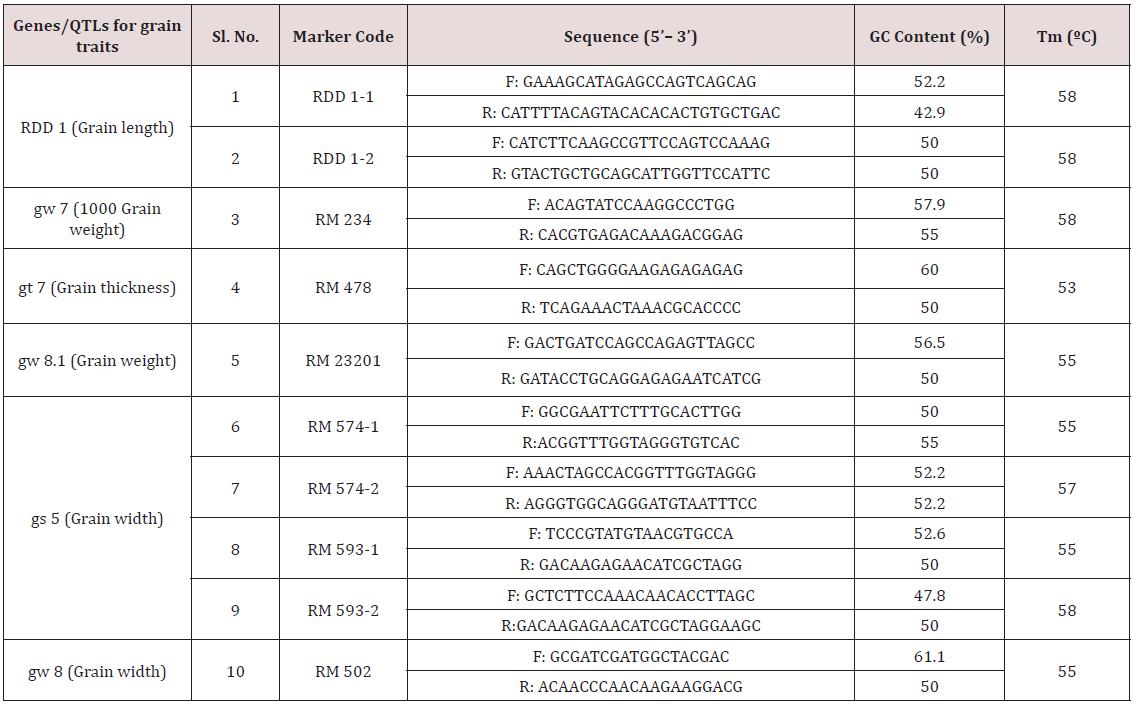
In this study, 41 diverse rice genotypes were used for allele mining study with an objective to detect among them superior alleles for rice grain dimensions viz. grain length, grain width, grain thickness, grain size and grain weight. SSR markers associated with reported genes for these traits were used for PCR amplification Micro satellite markers linked to reported genes/QTL for grain yield traits were used to detect polymorphism and to detect the yield enhancing alleles among 41 rice genotypes. PCR amplification was done with a set of 10 primers (Tables 5 & 6) and analysis for polymorphism was done through electrophoresis in 3% agarose gel. Scoring of PCR products was done through gel electrophoresis by comparing the size of the bands of the PCR products using a gel documentation system. The markers showing bands of similar positions in gels for all the genotypes were monomorphic markers while those markers showing bands at different position were polymorphic markers. All the genotypes that show products of similar size with that of expected amplicon size for the reported trait will carry the desired allele for grain yield and likewise the alleles for the entire target regions were identified [8].

Table 5: Concentrations of reaction mixtures for markers used for allele mining.

Lupinepublishers-openaccess-Agriculture

Table 6: List of SSR primers used for allele mining study.

Lupinepublishers-openaccess-Agriculture

Association between phenotype and genotype

The average grain length, grain width and 1000 grain weight distribution in the genotypes carrying different alleles was determined by checking whether the error bars referring to confidence interval showed overlapping or not. The 41 genotypes were further categorized into top and bottom groups of 15 genotypes based on grain length, grain width and grain weight. Chi square analysis was performed to study the association between markers with grain traits and allelic association with the trait for each of the sub-groups.

Results and Discussion

Phenotypic analysis for yield related traits

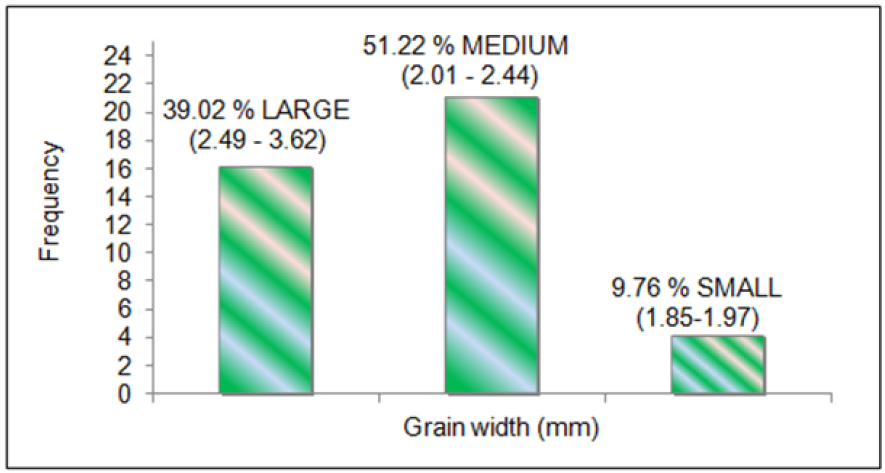
Phenotypic variation was observed for grain dimensions in all the genotypes. The mean data for grain width (Figure 2), grain length (Figure 3) and 1000 grain weight (Figure 4) was taken for all the 41 genotypes used for allele mining study. The genotypes with larger grain width (mm) were LR-1 (3.62), LR-71 (3.07), Pant dhan- 16 (2.85), IVT-2712 (2.79) and RWR-19 (2.77). Smaller grain width (mm) was observed in Kalanamak (2.01), AVT-2607 (2.0), Hans raj (1.97), AVT-2701 (1.94), IVT-2703 (1.904) and AVT-2609 (1.85). The panel consisted of 39.02 % large (2.49-3.62), 51.22 % medium (2.01-2.44) and 9.76 % small (1.85-1.97) for grain width (in mm) trait. The genotypes with larger grain length (mm) were Hans raj (10.31), Pant dhan-18 (9.83), Pant dhan-10 (9.7), Narendra (9.63), Pant dhan-12 (9.53), RWR-125 (9.27), Pant dhan-4 (9.23) and Govind (9.12). Smaller grain length (mm) was observed for genotypes IVT-ASG-2708 (6.41), Kalanamak (6.35), IVT-ASG-2711 (6.15), IVT-ASG-2607 (5.92), IVT-ASG-2713 (5.71), IVT-ASG-2703 (5.69), LR-71 (5.59) and LR-77 (5.48). The genotype panel consisted of 19.51 % large (9.18-10.31), 56.1 % medium (7.36-8.74) and 24.4 % small (5.48-6.82) for grain length (in mm).The genotypes having the highest grain weight (g) were LR-1 (36.04), Pant dhan- 18 (27.97), Pant dhan-4 (26.39), LR-23 (25.32), RWR-125 (25.05), Narendra (24.2), Pant dhan -12 (23.97) and Pant dhan-16 (23.39). Lower grain weight (g) was observed for genotypes, Kalanamak (12.17), LR-77 (12.14), AVT-IASG-2609 (12.00), IVT-ASG-2713 (11.96), AVT-IASG-2607 (10.74) and IVT-ASG-2703 (10.72). The genotype panel consisted of 43.9 % high (23-36), 34.15 % medium (19.5-22.8) and 21.95 % small (17-19.45) for 1000 grain weight (g). The phenotypic variance observed for the 41 rice genotypes were found to be significant at 5% level for grain width (F=9.61) and grain length (F=6.1).

Figure 2: Classification of rice genotypes in large, medium and small grain width categories.

Lupinepublishers-openaccess-Agriculture

Figure 3: Classification of rice genotypes under large, medium and small grain length categories.

Lupinepublishers-openaccess-Agriculture

Figure 4: 4: Classification of rice genotypes in high, medium and low grain weight categories.

Lupinepublishers-openaccess-Agriculture

Allele mining for genes/QTLs

Alleles are the alternative DNA sequences at the same physical locus which may or may not result in different phenotypic traits. Increasing demand of rice varieties with higher yield is making scientists work for the identification of superior and novel alleles to be used in breeding programmes. Allele mining is another very important molecular approach towards identifying and bringing together useful traits from diverse genetic sources and introgression these useful alleles into a common recipient promising cultivar lacking one or two superior alleles for some agronomic traits. Molecular markers are effectively being used to detect the variant alleles present in diverse genotypes or cultivars which are phenotypically different from each other for the traits in question. Microsatellite markers or SSR markers are PCR-based markers that specifically bind to the complementary sequence of the plant genomic DNA during PCR reaction. Through allele mining novel genes could be identified from diverse sources and used in improvement of crops for specific traits. Allele mining for grain yield related traits in large number of genotypes/ cultivars would help in identifying new alleles of the genes known for the target trait and their sources. It can also provide an insight into molecular basis of novel trait variations and identify the nucleotide sequence changes associated with superior alleles [9].

The quantitative trait locus (QTL) mapping has contributed to a better understanding of the genetic basis of many agronomically important traits such as grain yield. Grain yield is a quantitatively inherited trait which is the result collectively contributed by several individual grain traits. Of these, grain length, grain width and grain weight are some of the important yield contributing grain traits in rice. Today, a number of genes/QTLs associated with these traits have been identified, sequenced, mapped and many associated markers to these QTLs have been developed recently. In this study, a set of 41 diverse genotypes including two accessions viz. RWR- 19 and RWR-125 from wild species O. nivara were used for allele mining using nine SSR markers tagged to reported genes/QTLs. Out of the nine primers viz. RDD 1-2, RM 234, RM 478, RM 23201, RM 502, RM 574-1, RM 574-2, RM 593-1 and RM 593-2 used in the present study, RM 23201 was found to be monomorphic and the rest eight primers were polymorphic.

Association between genotype and phenotype

Chi square test was conducted to study the association of the markers with grain traits. Each of the alleles observed in the top 15 and bottom 15 genotypes were tested for the consistency of their distribution with the whole population. Significant association (Χ2=3.94, p=0.05) was observed for allele A in the 15 genotypes having large grain length for primer RDD1-2. Allele Bfor Rdd1 gene too showed significant association (Χ2=4.51, p=0.03). Allele A was found to be associated with large grain length and allele B was found to be associated with small grain length. Significant association was observed for marker RM 478 with grain weight and for the distribution of A allele in the bottom 15 genotypes (lowest grain weight) with the distribution in the overall population (Χ2=5.08, p=0.02) and for primer RM574-2, distribution of B allele (Χ2=4.3, p=0.08) in the bottom 15 genotypes (smallest grain width) was found to be significant.

Rdd 1 (Rice dof daily fluctuations1) Dof gene in rice has been reported to be associated with plant growth, grain size and flowering timein rice. In a study conducted by Iwamoto et al. (2009), transgenic plants carrying full length Rdd 1cDNA driven by constitutive promoter were produced in order to study the role of Rdd1 and in - vivo function of Dof gene in plants. The two types of transgenic plants were produced viz. RDD 1-S, transgenic containing sense strand and RDD 1-AS with anti-sense strand. Differences in the grain length, grain width and grain weight were observed between RDD 1-AS and RDD 1-S plants when subjected under varying photoperiod conditions [4]. When the grain sizes of the two transgenic types of plants were compared with the wild type plants, there was significant decrease in grain length, grain width and decrease in 1000 grain weight in transgenics carrying antisense gene (AS1=4.67 and AS2=4.54). In our study, we used previously reverse RDD-1 primer and designed a new forward primer giving an amplicon size of 620 bp. The three alleles obtained in the present study with sizes of 600, 620 and 600’490 base pairs were designated as A, B and C, respectively. Significant association (Χ2=3.94, p<0.05) was observed between the grain length and the allele A (600bp) for large grain length and allele B (620 bp) associated with small grain length (Χ2=4.51, p<0.05). The allele A for Rdd1 can be used in breeding for large grain length. In our study, however, a set of 41 genotypes having large grain length ranging from 8.27-10.31mm and small grain length of 5.48-7.52 mm were used. This phenotypic variation is distinct from the WT genotype Nipponbare (4.94mm) used by Iwamoto [4]. The allele A though similar in size could be different due to nucleotide variation. In order to rule out that possibility, sequencing of the allele from a panel of genotypes showing large grain length will have to be done.

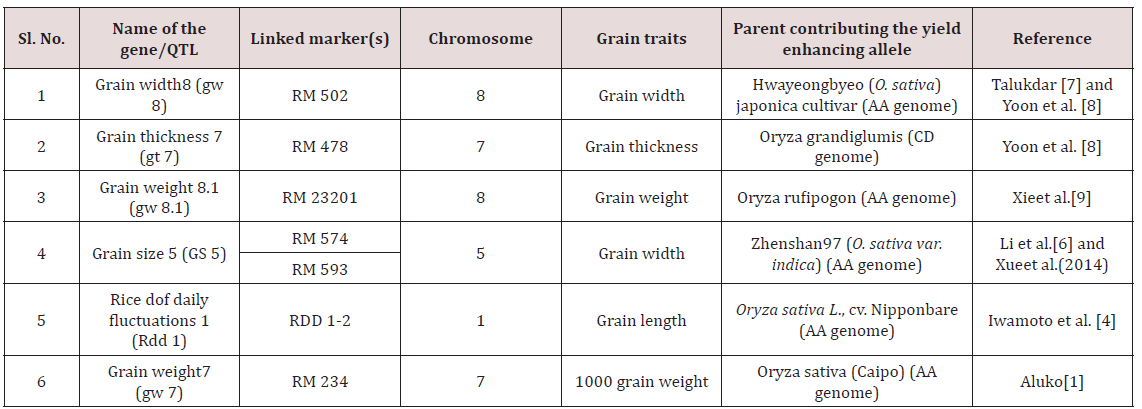
GS 5 (Grain size 5) QTL has been reported to be a positive regulator of grain width and flanked by markers RM 593 and RM 574. Over-expression of GS5 promotes cell division resulting in an increase of grain width [6]. Other genes/QTLs in rice are Grain weight 7 (gw 7) reported to be associated with 1000 grain weight located at chromosome 7 in population derived from O. sativa and O. grandiglumis. Phenotypic variation of 13.3% was observed in populations having allele for gw 7 from Caipo (Aluko, 2003). Grain width 8 (gw 8) at chromosome 8 has been reported to have negative effect on grain width with decrease in grain width in populations resulting from separate crosses made between HJX 74 x Anmol 3 and HJX 74 x Basmati 370, with possible introgression of the recessive allele from Anmol 3 and Basmati 370 [7,8]. No significant association was observed for primers reported for Grain weight 8.1 (gw 8.1) [9] QTL in our panel of 41 genotypes. Grain thickness 7 (gt 7), a QTL for grain thickness with linked marker RM 478 at chromosome 7¸ has been reported to be associated positively with grain thickness in HG 101 which is a near isogenic line obtained from O. sativa (Hwaseongbyeo) x O. grandiglumis. T [8].

he increased grain length in mm (5.53), grain width in mm (3.08) and 1000 grain weight in grams (26.3) was observed for the NILs as compared to the recipient parent, Hwaseongbyeo, with grain length (5.03 mm), grain width (2.84mm) and 1000 grain weight (21.5g). In the present study, significant association of primer RM 478 was observed and the allele A (205bp) was significantly associated with low 1000 grain weight. The genotypes used in the present study have highest 1000 grain weight ranging from 20.16-36.04 grams and lowest ranging from 10.72-15.59 grams. Since grain yield is quantitative in nature, it is a complex trait and the markers tagged with the genes/QTLs may not show association in a diverse set of genotypes. Also the effect of individual genic components to grain yield may be very low as grain yield is a trait caused by cumulative action of many related components. Our study however, suggests that the allele A (600 bp) from Rdd 1 can be used in breeding programmes to enhance grain length in rice. The genotypes viz. Hans raj, Pant dhan-18, Pant dhan-10, Narendra, Pant dhan-12, Pant dhan-4, ARR-09, Shahsarang, IVT-ASG-2712, IVT-ASG-2701, AVT-IASG-2602, AVT-IASG-2609 and IVT-ASG-2705 have been identified to be carrying this allele. These can be used as a source of large grain length in future. The primers RM 478 for grain thickness and RM 574-2 for grain width can be used in marker assisted breeding programmes. Allele A (205 bp) of RM 478 and allele B (240 bp) of RM 574-2 associated with low grain weight and grain width, respectively can be used for rejection at seedling stage in marker assisted breeding programme (Table 7). This study also identified novel alleles (alleles distinct from those reported in biparental programme); which could be significant in a larger panel of rice genotypes (Figure 2-4).

Discussion

Phenotypic analysis for yield related traits

Phenotypic variation was observed for grain dimensions in all the genotypes. The mean data for grain width (Figure 5), grain length (Figure 6) and 1000 grain weight (Figure 7) was taken for all the 41 genotypes used for allele mining study. The genotypes with larger grain width (mm) were LR-1 (3.62), LR-71 (3.07), Pant dhan- 16 (2.85), IVT-2712 (2.79) and RWR-19 (2.77). Smaller grain width (mm) was observed in Kalanamak (2.01), AVT-2607 (2.0), Hans raj (1.97), AVT-2701 (1.94), IVT-2703 (1.904) and AVT-2609 (1.85). The panel consisted of 39.02 % large (2.49-3.62), 51.22 % medium (2.01-2.44) and 9.76 % small (1.85-1.97) for grain width (in mm) trait. The genotypes with larger grain length (mm) were Hans raj (10.31), Pant dhan-18 (9.83), Pant dhan-10 (9.7), Narendra (9.63), Pant dhan-12 (9.53), RWR-125 (9.27), Pant dhan-4 (9.23) and Govind (9.12). Smaller grain length (mm) was observed for genotypes IVT-ASG-2708 (6.41), Kalanamak (6.35), IVT-ASG-2711 (6.15), IVT-ASG-2607 (5.92), IVT-ASG-2713 (5.71), IVT-ASG-2703 (5.69), LR-71 (5.59) and LR-77 (5.48). The genotype panel consisted of 19.51 % large (9.18-10.31), 56.1 % medium (7.36-8.74) and 24.4 % small (5.48-6.82) for grain length (in mm). The genotypes having the highest grain weight (g) were LR-1 (36.04), Pant dhan- 18 (27.97), Pant dhan-4 (26.39), LR-23 (25.32), RWR-125 (25.05), Narendra (24.2), Pant dhan -12 (23.97) and Pant dhan-16 (23.39). Lower grain weight (g) was observed for genotypes, Kalanamak (12.17), LR-77 (12.14), AVT-IASG-2609 (12.00), IVT-ASG-2713 (11.96), AVT-IASG-2607 (10.74) and IVT-ASG-2703 (10.72) (Tables 8 & 9). The genotype panel consisted of 43.9 % high (23-36), 34.15 % medium (19.5-22.8) and 21.95 % small (17-19.45) for 1000 grain weight (g). The phenotypic variance observed for the 41 rice genotypes were found to be significant at 5% level for grain width (F=9.61) and grain length (F=6.1).

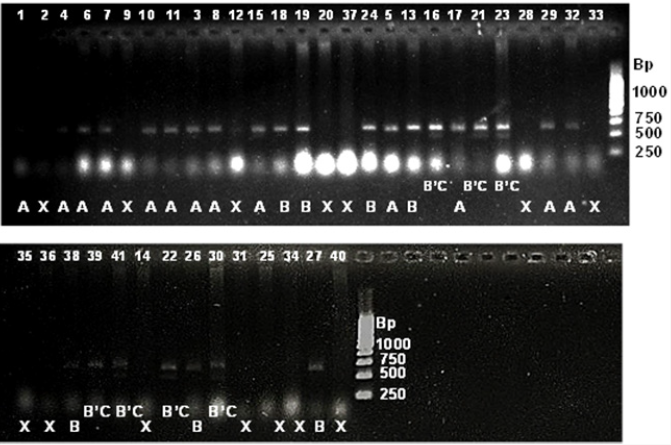
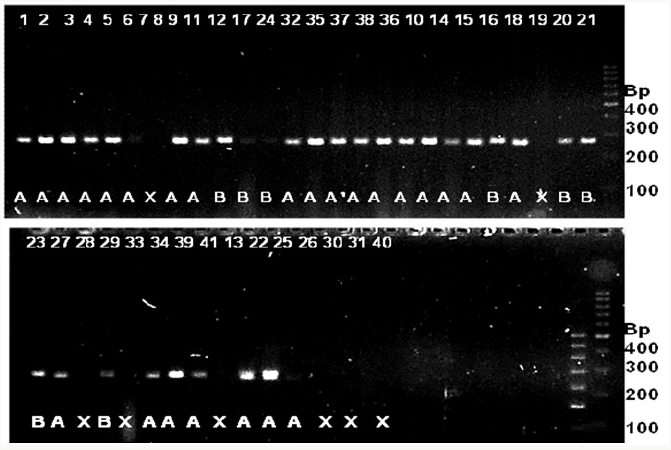
Figure 5: SSR profile of grain length generated by primer RDD1-2 in 41 rice genotypes. The numbers at the top refer to the genomic DNA code as mentioned in Table 4.2. Alleles are indicated at the bottom. Allele A=approximately 600 bp; allele B=620 bp; B’C=620’ 490 bp; X=no amplification. 1kbp ladder is indicated at the right of the gel.

Lupinepublishers-openaccess-Agriculture

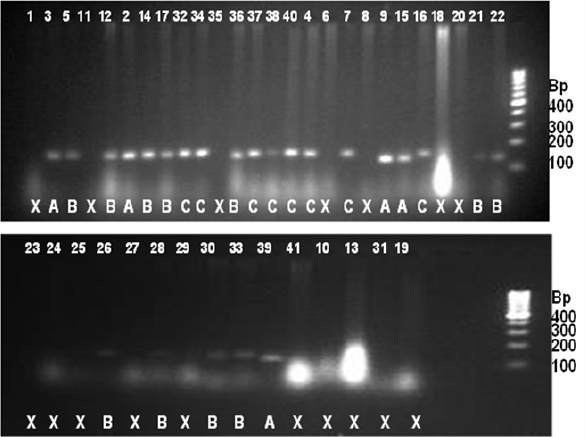
Figure 6: SSR profile of grain weight generated by primer RM 234 in 41 rice genotypes. The numbers at the top refer to the genomic DNA code as mentioned in Table 4.2. Alleles are indicated at the bottom. Allele A=approximately 110 bp; allele B=125 bp; allele C=155; X=no amplification. 100 bpladder is indicated to the right of the gel.

Lupinepublishers-openaccess-Agriculture

Figure 7: SSR profile of grain width generated by primer RM 502 in 41 rice genotypes. The numbers at the top refer to the genomic DNA code as mentioned in Table 4.2. Alleles are indicated at the bottom. Allele A=approximately 255 bp; B=170 bp; X=no amplification. 100 bpladder is indicated to the right of the gel.

Lupinepublishers-openaccess-Agriculture

Allele mining for genes/QTLs

Alleles are the alternative DNA sequences at the same physical locus which may or may not result in different phenotypic traits. Increasing demand of rice varieties with higher yield is making scientists work for the identification of superior and novel alleles to be used in breeding programmes. Allele mining is another very important molecular approach towards identifying and bringing together useful traits from diverse genetic sources and introgression these useful alleles into a common recipient promising cultivar lacking one or two superior alleles for some agronomic traits. Molecular markers are effectively being used to detect the variant alleles present in diverse genotypes or cultivars which are phenotypically different from each other for the traits in question. Microsatellite markers or SSR markers are PCR-based markers that specifically bind to the complementary sequence of the plant genomic DNA during PCR reaction. Through allele mining novel genes could be identified from diverse sources and used in improvement of crops for specific traits. Allele mining for grain yield related traits in large number of genotypes/cultivars would help in identifying new alleles of the genes known for the target trait and their sources. It can also provide an insight into molecular basis of novel trait variations and identify the nucleotide sequence changes associated with superior alleles.

The quantitative trait locus (QTL) mapping has contributed to a better understanding of the genetic basis of many agronomically important traits such as grain yield. Grain yield is a quantitatively inherited trait which is the result collectively contributed by several individual grain traits. Of these, grain length, grain width and grain weight are some of the important yield contributing grain traits in rice. Today, a number of genes/QTLs associated with these traits have been identified, sequenced, mapped and many associated markers to these QTLs have been developed recently. In this study, a set of 41 diverse genotypes including two accessions viz. RWR- 19 and RWR-125 from wild species O. nivarawere used for allele mining using nine SSR markers tagged to reported genes/QTLs. Out of the nine primers viz. RDD 1-2, RM 234, RM 478, RM 23201, RM 502, RM 574-1, RM 574-2, RM 593-1 and RM 593-2 used in the present study, RM 23201 was found to be monomorphic and the rest eight primers were polymorphic.

Association between genotype and phenotype

Chi square test was conducted to study the association of the markers with grain traits. Each of the alleles observed in the top 15 and bottom 15 genotypes were tested for the consistency of their distribution with the whole population. Significant association (Χ2=3.94, p=0.05) was observed for allele A in the 15 genotypes having large grain length for primer RDD 1-2. Allele Bfor Rdd 1 gene too showed significant association (Χ2=4.51, p=0.03). Allele A was found to be associated with large grain length and allele B was found to be associated with small grain length. Significant association was observed for marker RM 478 with grain weight and for the distribution of A allele in the bottom 15 genotypes (lowest grain weight) with the distribution in the overall population (Χ2=5.08, p=0.02) and for primer RM 574-2, distribution of B allele (Χ2=4.3, p=0.08) in the bottom 15 genotypes (smallest grain width) was found to be significant. Rdd 1(Rice dof daily fluctuations 1) Dof gene in rice has been reported to be associated with plant growth, grain size and flowering time in rice. In a study conducted by Iwamoto et al. (2009), transgenic plants carrying full length Rdd 1 cDNA driven by constitutive promoter were produced in order to study the role of Rdd 1 and in vivo function of Dof gene in plants. The two types of transgenic plants were produced viz. RDD 1-S, transgenic containing sense strand and RDD 1-AS with anti-sense strand. Differences in the grain length, grain width and grain weight were observed between RDD 1-AS and RDD 1-S plants when subjected under varying photoperiod conditions [4]. When the grain sizes of the two transgenic types of plants were compared with the wild type plants, there was significant decrease in grain length, grain width and decrease in 1000 grain weight in transgenics carrying antisense gene (AS1=4.67 and AS2=4.54).

In our study, we used previously reverse RDD-1 primer and designed a new forward primer giving an amplicon size of 620bp. The three alleles obtained in the present study with sizes of 600, 620 and 600’490 base pairs were designated as A, B and B’C, respectively. Significant association (Χ2=3.94, p< 0.05) was observed between the grain length and the allele A (600bp) for large grain length and allele B (620bp) associated with small grain length (Χ2=4.51, p<0.05). The allele A for Rdd 1 can be used in breeding for large grain length. In our study, however, a set of 41 genotypes having large grain length ranging from 8.27-10.31 mm and small grain length of 5.48-7.52 mm were used. This phenotypic variation is distinct from the WT genotype Nipponbare (4.94mm) used by Iwamoto [4]. The allele A though similar in size could be different due to nucleotide variation. In order to rule out that possibility, sequencing of the allele from a panel of genotypes showing large grain length will have to be done. GS 5 (Grain size 5) QTL has been reported to be a positive regulator of grain width and flanked by markers RM 593 and RM 574. Over-expression of GS 5 promotes cell division resulting in an increase of grain width [6]. Other genes/QTLs in rice are Grain weight 7 (gw 7) reported to be associated with 1000 grain weight located at chromosome 7 in population derived from O. sativa and O. grandiglumis. Phenotypic variation of 13.3% was observed in populations having allele for gw 7 from Caipo [1]. Grain width 8 (gw 8) at chromosome 8 has been reported to have negative effect on grain width with decrease in grain width in populations resulting from separate crosses made between HJX 74 x Anmol 3 and HJX 74 x Basmati 370, with possible introgression of the recessive allele from Anmol 3 and Basmati 370 [7,8]. No significant association was observed for primers reported for Grain weight 8.1 (gw 8.1) [9] QTL in our panel of 41 genotypes.

Grain thickness 7 (gt 7), a QTL for grain thickness with linked marker RM 478 at chromosome 7¸ has been reported to be associated positively with grain thickness in HG 101 which is a near isogenic line obtained from O. sativa (Hwaseongbyeo) x O. grandiglumis [8]. The increased grain length in mm (5.53), grain width in mm (3.08) and 1000 grain weight in grams (26.3) was observed for the NILs as compared to the recipient parent, Hwaseongbyeo, with grain length (5.03mm), grain width (2.84mm) and 1000 grain weight (21.5g). In the present study, significant association of primer RM 478 was observed and the allele A (205bp) was significantly associated with low 1000 grain weight. The genotypes used in the present study have highest 1000 grain weight ranging from 20.16-36.04 grams and lowest ranging from 10.72-15.59 grams. Since grain yield is quantitative in nature, it is a complex trait and the markers tagged with the genes/QTLs may not show association in a diverse set of genotypes. Also the effect of individual genic components to grain yield may be very low as grain yield is a trait caused by cumulative action of many related components. Our study however, suggests that the allele A (600bp) from Rdd 1 can be used in breeding programmes to enhance grain length in rice. The genotypes viz. Hans raj, Pant dhan-18, Pant dhan- 10, Narendra, Pant dhan-12, Pant dhan-4, ARR-09, Shahsarang, IVTASG- 2712, IVT-ASG-2701, AVT-IASG-2602, AVT-IASG-2609 and IVTASG- 2705 have been identified to be carrying this allele. These can be used as a source of large grain length in future. The primers RM 478 for grain thickness and RM 574-2 for grain width can be used in marker assisted breeding programmes. Allele A (205bp) of RM 478 and allele B (240bp) of RM 574-2 associated with low grain weight and grain width, respectively can be used for rejection at seedling stage in marker assisted breeding programme. This study also identified novel alleles (alleles distinct from those reported in biparental programme); which could be significant in a larger panel of rice genotypes (Tables 7-9).

Table 7: List of reported candidate genes/QTL, their associated markers, location, and associated grain traits used for allele mining study.

Lupinepublishers-openaccess-Agriculture

Table 8: Analysis of variance for grain width in rice genotypes.

Lupinepublishers-openaccess-Agriculture

Table 9: Analysis of variance for grain length in rice genotypes.

Lupinepublishers-openaccess-Agriculture

Conclusion

From this present experiment, hybrid plants from inter-specific crosses can be used for backcrossing in future plant breeding programmes. Crosses can also be attempted for genotypes that failed during this experiment. Primer RDD 1-2 can be used for identifying alleles enhancing grain length from diverse genomic sources for crop improvement. The allele A (600 bp) from Rdd 1 can be used in breeding programmes to enhance grain length in rice. The genotypes viz. Hans raj, Pant dhan-18, Pant dhan-10, Narendra, Pant dhan-12, Pant dhan-4, ARR-09, Shahsarang, IVTASG- 2712, IVT-ASG-2701, AVT-IASG-2602, AVT-IASG-2609 and IVT-ASG-2705 identified carrying this allele can be used as a source for large grain length in future. The primers RM 478 for grain thickness and RM 574-2 for grain width can be used in marker assisted breeding programmes. Allele A (205bp) of RM 478 and allele B (240bp) of RM 574-2 associated with low grain weight and grain width respectively, can be used for rejection at seedling stage in marker assisted breeding programme. This study also identified novel alleles (alleles distinct from those reported in biparental programme); which could be significant in a larger panel of rice genotypes.

Read More Lupine Publishers Agriculture Journal Articles:
Friday 25 September 2020

Lupine Publishers | Lipoma of the Parotid Gland: A Case Report

 Lupine Publishers | Journal of Otolaryngology


Abstract

Lipoma of the parotid gland is extremely rare, accounting for only 0,6% - 4,4% of all parotid tumors. We present a rare case of lipoma of the superficial parotid lobe. A 68 - year-old man, presented in our department with a mass of the left parotid region. Clinical examination revealed a mobile, soft, non-tender mass in the area of the left parotid gland. MRI concluded to a lipoma of the superficial lobe of parotid gland. Parotidectomy preserving the facial nerve was performed. No complication nor recurrence were noted after a follow-up of 12 months. Lipoma arising in the parotid gland is extremely rare. Resection of this tumor requires full exposure of the facial nerve and its branches.

Keywords: Lipoma; Parotid gland; Superficial lobe; Parotidectomy

Introduction

Lipoma is a common mesenchymal soft tissue tumor that can be found in any part of the body. It can develop in the head and neck region in 15–20% of cases. Rarely it can arise in the Parotid gland with a ranging incidence from 0,6 to 4,4 % [1]. Clinical diagnosis may be difficult. MRI is necessary, in diagnosis [2]. Surgical management of these tumors is challenging and need meticulous dissection of the facial nerve. We report a case of lipoma arising of the parotid gland and we discuss through literature its clinical and therapeutic features.

Case Report

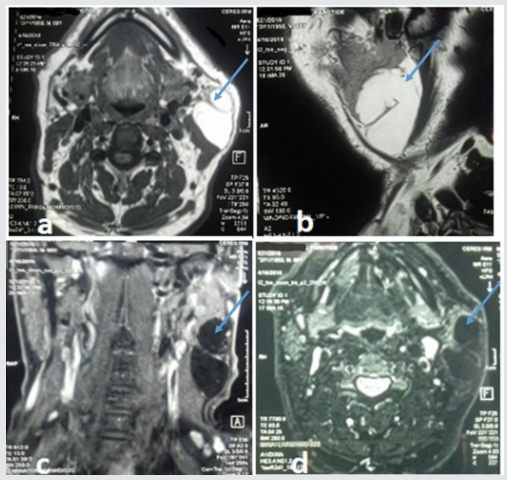
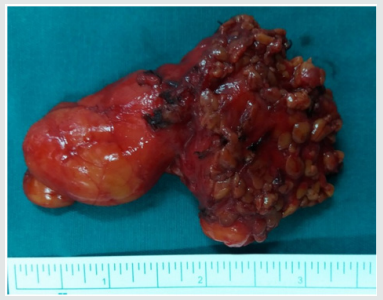
A 68 - year-old man presented with mass of the left parotid region, which was painless slow-growing for 5 years. Clinical examination revealed a mobile, soft, non-tender mass that measured about 6cm in diameter in the area of the left parotid gland, extending from the ear lobule to the left mandibular angle. There was no facial paralysis nor evidence of cervical lymphadenopathy. Magnetic resonance imaging (MRI) showed a well-defined homogeneous lesion of the superficial lobe of the left parotid gland with an enhanced signal on T1- and T2-weighted sequences and weak signal on fat suppressed sequences (Figure 1). The diagnosis of intra parotid lipoma was evoked. A left superficial parotidectomy preserving the facial nerve was performed. The specimen was soft, yellowish, well- circumscribed measuring 80*34mm. Histological examination revealed a well-circumscribed aggregate of mature adipocytes surrounded by a thin fibrous capsule confirming the diagnosis of intraparotid lipoma. No recurrence or complication were observed after a follow-up of 12 months.

Discussion

Lipoma is one of the most frequently encountered benign mesenchymal tumors that may originate from adipose tissue in any part of the body [3,4]. Rarely, it can develop in the parotid gland with reported incidence ranging from 0,6% to 4,4% among parotid tumors [3,5]. Lipoma may occur at any age, but most frequently between 40 and 60 years with a male predominance [5,6]. Its aetiology is unknown. It can be caused by heredity, obesity, diabetes, radiation, endocrine disorders, insulin injection, corticosteroid therapy and trauma [7]. In our case, we did not find any aetiological factors. Most of the reported cases were located at the superficial parotid lobe [7]. Lipomas involving the deep parotid lobe are extremely rare [5-8]. Clinical diagnosis may be difficult [9], especially for tumors located at the deep parotid lobe because it is difficult to evaluate the relationship between these masses and the surrounding tissues. Those situated at superficial parotid lobe usually appear as a slow growing, non-tender, movable and well-differentiated soft mass in parotid region [3-10]. Facial paralysis and pain are uncommon signs and rarely have been described [5-11]. This benign clinical presentation is most often mistaken for Warthin tumor or pleomorphic adenoma [3-12]. Fine needle aspiration cytology (FNAC) has great value in the diagnosis of parotid tumors and requires an experienced cytologist. Its accuracy drops to less than 50% in the cases of parotid lipomas [5-13]. On imaging, CT scan shows hypodense, homogeneous and well delineated mass with few septations and negative attenuation, without contrast enhancement [3-13]. However, CT scan cannot distinguish lipoma from surrounding adipose tissue. MRI remains the best diagnostic tool that can accurately diagnose lipomas [5-1]. Lipomas produce strong signals on T1- and T2 weighted sequences and weak signals on fat-suppressed sequences. After Gadolinium injection, the mass still hypointense to parotid, homogeneous in signal and uniformly non-enhancing [3]. MRI can also clearly define the limits of lipoma from normal adipose tissue and may be useful in determining the appropriate surgical approach.

Figure 1: MRI of the parotid gland showing homogeneous mass on the superficial lobe of the left parotid gland on hyper signal T1 and T2 and a weak signal on fat suppressed sequences. The lesion is hypointense to parotid and uniformly non-enhancing.

lupinepublishers-openaccess-journal-otolaryngology

Figure 2: Macroscopic findings of the resected tumor.

lupinepublishers-openaccess-journal-otolaryngology

Histopathologic investigation reveals mature adipose tissue separated from parotid gland parenchyma with a fibrous capsule. Identification of a capsule may aid in distinguishing such a neoplasm from pseudolipoma, lobular lipomatous atrophy, or lipomatosis, all of which are unencapsulated [3]. Surgery is the treatment of choice of parotid gland lipoma, but its modalities remain controversial [8-12]. It should be performed by experienced surgeons because of the need for meticulous dissection of the facial nerve branches. The postoperative esthetic and functional results should be the major concerns [1]. Some surgeons recommend simple enucleation of a superficial lobe parotid lipoma with a small border of healthy parotid gland parenchyma, as this is easy to perform because of the well-defined capsule. Other surgeons suggest that the surgical management of parotid lipoma should be the same as that for other parotid tumors [5]. However, it is well known that transient facial nerve dysfunction and Frey’s syndrome may occur as complications following surgical intervention for parotid tumors and should be explained to the patient before operation [5]. Facial nerve dysfunction ranged between 8.2 and 65% after parotid gland surgery for benign tumors [10]. Therefore, it requires efforts such as facial nerve monitoring to identify the facial nerve. Recurrence rate of parotid lipoma after adequate resection is very low. It has been reported in 5% in all cases when it is well-encapsulated [5-9]. Malignant transformation into liposarcomas has been reported in few cases in the literature [9]. Therefore, careful follow-up is recommended.

Conclusion

Lipoma of the parotid gland is a rare benign tumor, which should be considered in the differential diagnosis of parotid gland’s mass lesions. MRI is essential to locate the tumor, and to precise its relationship with the facial nerve. Their management is challenging. Definitive diagnosis can only be accomplished with histopathologic review.

Read More Lupine Publishers Otolaryngology Journal Articles:
https://lupine-publishers-otolaryngology.blogspot.com/
Read More Lupine Publishers blogger Articles: https://lupinepublishers.blogspot.com

Thursday 24 September 2020

Wednesday 23 September 2020

Lupine Publishers | Evaluation of Combinatorial Capacity of Coconut and Cocoa Plant Growth Promoting Rhizobacteria (Pgpr) with Biocontrol Agent Trichoderma Harzianum

  Lupine Publishers | Current Investigations in Agriculture and Current Research


Abstract

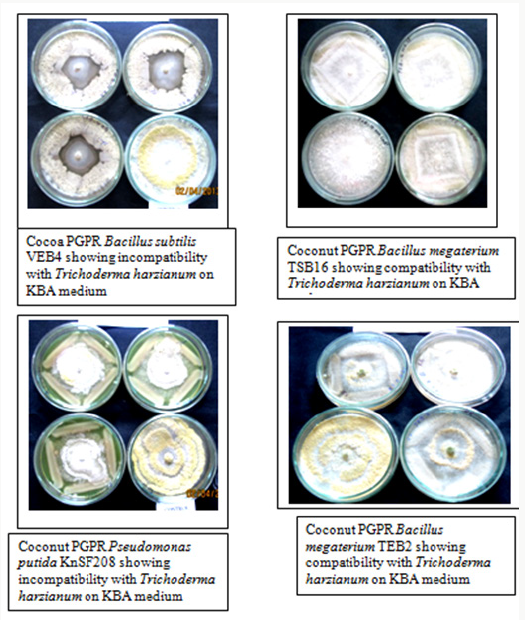
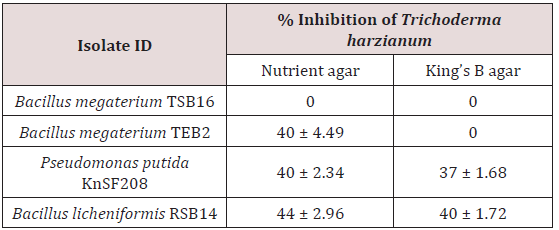
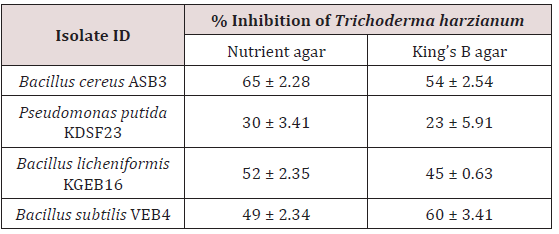
Combining PGPR and biocontrol agents that are compatible with each other is a strategic approach to enhance plant growth and development, control plant diseases and pests. A screening study was carried out to evaluate the compatibility of eight PGPR isolated from the rhizosphere and endorhizosphere of coconut (Pseudomonas putida KnSF208, Bacillus licheniformis RSB14, Bacillus megaterium TEB2, Bacillus megaterium TSB16) and cocoa (Bacillus cereus ASB3, Bacillus subtilis VEB4, Bacillus licheniformis KGEB16, Pseudomonas putida KDSF23) with fungal antagonist, Trichoderma harzianum, under in vitro conditions. The Trichoderma harzianum was isolated from the rhizosphere of coconut. All the PGPR isolates were tested for compatibility with Trichoderma harzianum by dual culture technique on four different media. Among the coconut PGPR isolates tested, Bacillus megaterium TSB16 was found to be compatible with Trichoderma harzianum on nutrient agar and King’s B agar. However, none of the cocoa PGPR were compatible with Trichoderma harzianum on all the media tested. This study indicates that combined application of PGPR Bacillus megaterium TSB16 and Trichoderma harzianum, as bioinoculants, is possible for dual benefits of enhanced plant growth and soilborne pathogen suppression.

Keywords: Bacillus megaterium; Trichoderma harzianum; Compatibility; Fluorescent Pseudomonas

Introduction

Beneficial rhizosphere organisms are generally classified into two broad groups based on their primary beneficial effect on plant growth: (a) microorganisms with direct effects on plant growth promotion and (b) biological control agents that indirectly assist with plant productivity through the control of plant pathogens. Co-inoculation of plant growth promoting rhizobacteria (PGPR) and bio control agents (BCAs) is considered to be an innovative approach in plant-health management, and for the improvement of crop yield and quality. The use of formulated preparations, consisting of a single microbial species or strains as inoculants has often resulted in inconsistent performances in agriculture [1]. One of the reasons of such a failure could be that a single strain might not grow equally well in a variety of environmental conditions [2]. Thus, more emphasis was laid on the combined use of beneficial microorganisms as they will have the advantage of exercising a broad-spectrum activity, more stable rhizosphere community, enhancing the efficacy and reliability of biological control generally and ensuring greater induction of defense enzymes over individual strains [3].

Application of binary or multiple mixtures would mimic the natural situation more closely and might broaden the spectrum of biocontrol activity [1]. Combining such beneficial organisms can enhance the plant’s innate resistance level against the invading pathogens more than their individual effort. In particular, combinations of fungi and bacteria may provide protection at different times or under different conditions and occupy different or complementary niches [4]. Such combinations may overcome inconsistencies in the performance of individual isolates. It was reported that the consortia of Trichoderma harzianum, fluorescent Pseudomonas and Glomus intraradices against Fusarium wilt not only suppressed the disease incidence but also helped in sustenance and growth promotion of crop through their different plant growth enhancement and nutrient uptake properties [5]. Interestingly, several researchers have observed increased plant growth and improved disease control using microbial consortia comprising of various biocontrol organisms such as Trichoderma, Pseudomonas, Bacillus spp., etc. in wheat, radish, chickpea, tomato, pepper, Arabidopsis and pigeon pea [5].

Rhizosphere facilitates growth, development and functioning of diverse microbial communities including plant growth-promoting rhizobacteria (PGPR). PGPR colonize the root surfaces, promote plant growth and protect plants from phytoparasites [6]. The rhizosphere is a nutrient-rich habitat influenced by the chemical and biological processes of root, which is an ideal place for the proliferation of these microbes [7,8]. PGPR may promote plant growth by several mechanisms which entail nitrogen fixation, sequestration of iron for plants by siderophores, production of plant hormones like auxins, cytokinins and gibberellins and lowering of plant ethylene levels [9]. PGPR have the potential capability to significantly enhance the yields of various crops [10]. Trichoderma species are plant symbionts that live free in the rhizosphere [11]. The soil fungus Trichoderma harzianum is used as biocontrol agent using its antagonistic abilities against phytopathogenic fungi, although it also has direct effects on plants, increasing or accelerating their growth and resistance to diseases and tolerance to abiotic stresses.

Biocontrol by Trichoderma is achieved through several mechanisms with a combination of two or more mechanisms acting together, probably responsible for the versatility of its biocontrol. A well-known mycoparasite, it secretes cell wall-degrading enzymes and other compounds that can directly kill the target pathogen. A competent rhizosphere colonizer, it can compete for space and nutrients with other microorganisms in the rhizosphere. Depending upon the strains, the use of Trichoderma species in agriculture can provide numerous advantages viz. rhizosphere competence allowing the strains to establish rapidly within the stable microbial communities in the rhizosphere; control of pathogenic and competitive or deleterious microflora by using a variety of mechanisms; improvement of the plant health and stimulation of root growth [12]. So far, Trichoderma species are among the most studied fungal biocontrol agents and commercially marketed as biopesticides, biofertilizers and soil amendments [13]. Compatibility and effectiveness of combinations of Trichoderma with other beneficial organisms is an important issue [14]. Therefore, the present study was undertaken to investigate the compatibility of eight PGPR, isolated from the rhizosphere and roots of coconut and cocoa, to fungal antagonist Trichoderma harzianum.

Materials and Methods

Cultures

Trichoderma harzianum culture was obtained from the Crop Protection Division, Central Plantation Crops Research Institute Kasaragod, which was previously isolated from the rhizosphere of coconut [15]. Fungal cultures were maintained on Potato Dextrose Agar (PDA) slants from which fresh cultures were prepared for further use.

PGPR strains

The compatibility of eight PGPR was tested against the biocontrol agent Trichoderma harzianum. Of the eight PGPR, four (Pseudomonas putida KnSF208, Bacillus licheniformis RSB14, Bacillus megaterium TEB2 and Bacillus megaterium TSB16) were isolated from the rhizosphere and endorhizosphere of coconut and the other four (Bacillus cereus ASB3, Bacillus subtilis VEB4, Bacillus licheniformis KGEB16 and Pseudomonas putida KDSF23) were isolated from the rhizosphere and endorhizosphere of cocoa. These PGPR were selected based on their plant growth promoting characteristics, performance based on seedlings study, green house experiments and field trials in coconut and cocoa [16,17]. The isolates were maintained on the nutrient agar slants at 4 °C for further use.

Selection of suitable medium for antagonistic studies

Eight selected Bacillus species and Pseudomonas species along with T. harzianum were inoculated on different media like Potato Dextrose Agar (PDA), Sabouraud Dextrose Agar (SDA), Nutrient Agar (NA) and King’s B Agar (KBA) to select an appropriate medium which would allow both bacteria and fungus to grow well for compatibility studies.

Compatibility study

Dual culture technique was performed for evaluating the compatibility of PGPR with Trichoderma harzianum in different media viz. NA and KBA. Fungal cultures, grown on PDA plates at 30°C for 3 to 4 days, were used for the study. Bacillus and Pseudomonas species were raised in nutrient broth and King’s B broth, respectively. Twenty four hr. old bacterial cultures were streaked at four equidistant points along the periphery of the NA and KBA plates. Mycelial discs of Trichoderma harzianum were cut out from the edge of an actively growing colony with the help of a sterile 5mm diameter cork borer and placed upside down at the centre of the assay plates. Control plate was kept without bacterial inoculation. All the plates were incubated at 30°C. When the hyphal growth of Trichoderma in the control plates reached the periphery, the growth of fungus in the dual inoculation plates (Trichoderma harzianum+PGPR) were measured for assessing compatibility. The zone of inhibition was measured and percent inhibition over control was calculated using the formula R1-R2/R1x100 where, R1 is maximum radius of mycelial growth on the control plate and R2 is radius of mycelial growth directly opposite to the bacterial growth [18].

Results

Out of four media tested, PDA and SDA, though favored the growth of Trichoderma harzianum but did not suit the growth of all the bacterial isolates. Hence, they were not suitable for studying compatibility. The in vitro compatibility studies were, therefore, carried out using NA and KBA media, which supported growth of both Trichoderma harzianum and PGPR bacteria. Strains of Pseudomonas putida (KnSF208), Bacillus megaterium (TSB16 and TEB2) and Bacillus licheniformis (RSB14) isolated from coconut rhizosphere and endorhizosphere were tested in vitro for compatibility. Bacillus megaterium TSB16 overgrew Trichoderma harzianum on all the media tested, no inhibition zone formed between these two isolates indicating that these organisms were compatible. Coconut isolate Bacillus megaterium TEB2 was compatible with Trichoderma harzianum on KBA medium (Figure 1). The isolate showed 40% inhibition when co-cultured on nutrient agar. Among the PGPR tested, Pseudomonas putida KnSF208 showed mycelia inhibition of 40% on NA and 37% on KBA (Table 1), (Figure1). The coconut isolate Bacillus licheniformis RSB14 showed highest inhibition of 44% on nutrient agar.

Figure 1: PGPR isolates showing antagonism against Trichoderma harzianum.

Lupinepublishers-openaccess-Agriculture

Table 1: Compatibility of Coconut PGPR on Different Media.

Lupinepublishers-openaccess-Agriculture

All the PGPR isolated from cocoa rhizosphere and endorhizosphere were incompatible with Trichoderma harzianum on NA and KBA. Of the cocoa PGPR tested, Bacillus cereus ASB3 showed maximum inhibition of mycelia growth of Trichoderma harzianum (65%) on nutrient agar. This was followed by Bacillus subtilis VEB4 which recorded 60% inhibition of Trichoderma over control on King’s B agar (Figure 1). The cocoa isolate Pseudomonas putida KDSF23 recorded the least mycelial growth inhibition of 23% on King’s B agar and 30% on nutrient agar (Table 2). As far as the medium used was concerned, maximum inhibition of hyphal growth of Trichoderma harzianum was obtained on nutrient agar as compared to King’s B agar.

Table 2: Compatibility of Cocoa PGPR on Different Media.

Lupinepublishers-openaccess-Agriculture

Discussion

The PGPR isolated from coconut and cocoa rhizosphere and roots were individually screened for their compatibility with Trichoderma harzianum in dual culture test. For carrying out compatibility studies, both NA and KBA were found suitable and PGPR and the fungal biocontrol agent exhibited satisfactory growth on these media. However, all the tested isolates showed maximum inhibition of growth of Trichoderma harzianum on nutrient agar medium. Greater levels of antagonism on the nutrient agar medium could be related to more suitable conditions for synthesis of antagonistic bioactive molecules. Peptone had been reported as a key nutrient for the production of antifungal compounds by Bacillus amyloliquefaciens RC-2 [19]. Also, variation in the antagonism of the native strains against fungi was observed on different solid media [20]. Antagonistic properties of Pseudomonas species were also reported to be influenced by culture medium composition, the fungal pathogen, and its growth stages [21]. Coconut isolate, Bacillus megaterium TSB16, was found to be compatible with Trichoderma harzianum on both media tested.

A positive interaction existed between Bacillus megaterium TSB16 and the fungal antagonist, Trichoderma harzianum. It could be attributed to the existence of synergism between the metabolites produced by PGPR and Trichoderma harzianum. Our findings corroborate the report of [22]. who found that the rhizobacterial strains, Bacillus subtilis, Bacillus pumilus and Bacillus cereus did not inhibit growth of Trichoderma harzianum in in vitro assays. Combinations of fungi and bacteria might provide protection at different times or under different conditions and might probably mimic the natural situation in the rhizosphere [23]. Bacillus licheniformis RSB14 isolated from the rhizosphere of coconut inhibited the mycelial growth of Trichoderma harzianum by an inhibition per cent of 44%. It had been earlier reported that the Bacillus licheniformis RSB14 had antagonistic activity against Ganoderma applanatum (57%) and Thielaviopsis paradoxa (80%) in in vitro studies George and workers [24] had also reported that the Bacillus licheniformis RSB14 had the potential to produce siderophore, chitinase, ammonia, β-1, 3- glucanase and salicyclic acid.

Chitinases are the cell wall-degrading enzymes that degrade chitin, a common constituent of fungal cell walls that is made up of β-1, 4-linked homopolymers of N-acetylglucosamine [25]. The antifungal metabolites such as β-1,3-glucanase and β-1,4-glucanase degrade the components of fungal cell wall such as chitin, β-1,3- glucan and glucosidic bonds [26]. Therefore, it was likely that cell wall lysis would have been due to concerted action of chitinase and β -1,3-glucanase. Generally, Bacillus species are capable of producing variety of fungal cell wall-degrading enzymes, such as chitinase, proteinase, cellulase and amylase [27]. Production of chitinase, β-1,3-glucanase, ammonia and siderophore by Bacillus licheniformis RSB14 might have collectively contributed to inhibition of fungal growth. Ghasemi [28] reported that halotolerant bacterium, Bacillus pumilus strain SG2 produced chitinases which had antifungal activity against Rhizoctonia solani, Verticillium species, etc. It was also reported that Bacillus megaterium and Bacillus subtilis inhibited the growth of Aspergillus niger in plate assay by the production of antifungal substances such as chitinase, cellulase and protease [29].

Pseudomonas putida KDSF23 isolated from cocoa and Pseudomonas putida KnSF208 isolated from coconut were also found to inhibit Trichoderma harzianum. The strains had the potential to produce siderophores [16, 17]. Competition for iron by siderophore production had been considered as one of the important mechanisms by which fluorescent pseudomonads exert their antagonistic activity and plant growth promotion. Siderophores produced by the microorganisms could bind iron with high specificity and affinity, making the iron unavailable for other microorganisms, and thereby limiting their growth. Siderophores might play an important role in the competition between microorganisms and may also act as growth promoters [30]. In an earlier report, Pseudomonas aeruginosa showed strong antagonism against two fungal pathogens, Macrophomina phaseolina and Fusarium oxysporum through the production of siderophores and HCN [[26]. Costa and coworkers [31] found that most of the Pseudomonas species displaying antifungal activity were siderophore producers.

All the cocoa isolates tested were found to be incompatible to Trichoderma harzianum and per cent inhibition ranged from 23% to 64% (Table 2). Among the cocoa isolates, the maximum inhibition of Trichoderma harzianum was shown by Bacillus cereus ASB3, isolated from cocoa rhizosphere, and Bacillus subtilis VEB4, isolated from the endorhizosphere of cocoa. A plausible reason for their antagonistic effect could be the production of secondary metabolites, such as antibiotics which resulted in inhibition of mycelial growth of Trichoderma harzianum. Antibiotics are lowmolecular weight compounds produced by microorganisms that are deleterious to the metabolism or growth of other microorganisms. It is well known that most of the Bacillus strains, such as Bacillus subtilis and Bacillus cereus, produce antibiotics such as d-gluconic acid and 2-hexyl-5-propyl resorcinol and bioactive compounds belonging to the cyclic lipopeptides [6]. In addition Bacillus subtilis VEB4 was found to be an antagonist to Phytophthora palmivora in an earlier study and the percent inhibition recorded was 45% over control [17].

Further, the strain was observed to produce siderophore, antibiotic and ammonia [17]. This suggested that the fungal mycelia inhibition happened not only by antibiosis but also by other antifungal metabolites such as siderophores, and gaseous product like ammonia. The cocoa isolates Pseudomonas putida KDSF23, Bacillus cereus ASB3 and Bacillus licheniformis KGEB16 had the potential to produce chitinases which also might have helped them to inhibit the growth of Trichoderma harzianum. Species of Pseudomonas excrete chitinases and β-1, 3-glucanases to digest the fungal cell wall chitin and glucan, respectively, and use these as a carbon and energy source [32]. Mostly Bacillus species were selected to play an important role in Trichoderma species inhibition [33]. Similar to our findings, Bacillus subtilis and Bacillus atrophaeus were reported to be inhibitory to Trichoderma harzianum in dual culture studies and were found to inhibit rhizome rot pathogens [22].

Conclusion

Out of eight PGPR, four from coconut and four from cocoa, tested for compatibility to Trichoderma harzianum, Bacillus megaterium TSB16 isolated from the rhizosphere of coconut was found to be compatible with Trichoderma harzianum. Among the four media tested, nutrient agar and King’s B agar were observed to support the growth of both the fungal antagonist Trichoderma harzianum and PGPR. The results of this study permit the integration of fungal antagonist and PGPR for effective rhizosphere management in future.

Acknowledgement

We acknowledge the financial assistance provided by ICAR under the Network Project on “Application of Microorganisms in Agriculture and Allied Sectors” coordinated by National Bureau of Agriculturally Important Microorganisms, Mau, UP State, for carrying out this study. Khadeejath Rajeela is grateful for Senior Research Fellowship.

Read More Lupine Publishers Agriculture Journal Articles: