Wednesday 26 October 2022

Lupine Publishers| The Use of Tin Plague in The Analysis of Pure Tin

 Lupine Publishers| Journal of Material Science


Abstract

Study focuses on the basis of knowledge the mechanism of the process βSn  αSn for use it to analysis of important material for science and technology. The possibility of ultra-high purity Sn to analyse by measuring the rate (V) of the allotropic changing (V βSn  αSn) is investigated. Metals of such high purity are inaccessible to chemical method, so analyzed by method of a residual resistance at temperature (T) of liquid He, inaccessible to most enterprises. The method gives an estimate of the total content of impurities. For Sn with low T of βSn αSn) due to the simplicity of the measuring purity by the V (βSnαSn) is tempting. In high purity Sn with a low content of impurities, this method seems more accessible and convenient than others and probably possible. This paper proposes the affordable and simple method of analysis, high sensitivity, accuracy and reproducibility of the results. not inferior to the complex method of measuring the residual resistance.

Keywords: Residual Resistance; Phase Transition Rate; Impurities

Introduction

The World made 7 metals, according to the 7 planets. (Navoi). In the table of ranks of the ancient Sn is pair to Jupiter, the largest planet. And now Snwith the honorary № 50 in the center of the Periodic Table of Mendeleev. Sn is the oldest to man known metal. Aristotle knew about the Sn plague, but didn’t know that it was a consequence of the allotropic transformation of Sn white to gray, β®α. The nebulous mysteries of Sn plague infection accumulated interests many centuries tothis phenomenon.A main Interest in βSn®αSn appeared after the evidence [1,2]Goryunova semiconductor nature of αSn with covalent bond by changing the metal bond to covalent, the electronic structure s2 p2βSn to sp3,tetragonal structure with

KN=6 to a cubic structure with KN=4 with bonds to the vertices of tetrahedrons ofαSn.These principlescreating of semiconductor compounds ofneeds properties. To turn into metastable αSn except T below 12.4oC,is a necessary [2] seed withthe parameters of the bond and structures related αSn and its contact with tin.The nearest neighbors of Sn give a compounds InSb and CdTe, There, pairs of atoms give in sum of total electrons the same as 2 atoms of Sn and parameters of structures [1] almost the same of αSn. InSb, CdTe, αSn the better seed of Sn®αSn, but in contrast to metastable αSn powder, InSb, CdTe are strong solid crystals. Theinfection is caused by atomic contact with a seed. Tin always covered by protective film of SnO2which don’t allow contact.If the seed is placed on the surface of Sn, there is Infection!? And from inert substances that had contact previously with the seed although it now removed[3]. Solid crystals recognized the past! Infection at a distance is possible too![4]. It was quite misunderstood: what gives an information from the seed? Necessary presence of the air, atmosphere.There is Ic agent,[5-7] Inthe vacuum, dryvessel, or after treatment of the inert substance with any solvent of water, so there is no infection,Ic is a carrier from the seed. Metastable structure Ic in the size of nanoparticles can growing epitaxially on the related structure, penetrate through the microdefects of the protective SnO2. So, it is clear that infection under water which absorbed the Icnanoparticles is impossible.This opinion turned out to be wrong. With a very small probability for a time more a year under moving water, infection occurs, and this valuable phenomenon gives ways to many practical tasks andunderstanding of life processes[7].The source of infection has been found. and yet another unexpected source of infection was found. This is property for practical aim. Tin remember about stay in the αSn phase. There is a βSn®αSn transition and back αSn®βSn, due to a change of .>/<d by 26.6%.volume effect. At each β®αmovedecreased d and at α®βd increased. So without external tools Sn gives pure powder of any size particles[8,9].

Knowing the Icas seed allows to use for solving a row of other practical problems [5-7]with use of the terrible plague by a simple way [10,11] in forms convenient for creating p/n shifts , simple effective purification of Sn without meltingin solid phase [12].Method of zone melting [13] to purification is determined by the difference in the K, ratio of the solubility of impurities at the phase boundary. At melting metal doesn’t change type of the bond on the border ofsolid/liquid, soK is near to 1, the difference is knowingly less than at of the metal /semiconductorboundary with the great differences in the nature of their chemical bonds, CN (coordination number), structures. The cleaning efficiency at the border metal /semiconductor, K far from1. And so was a reason that zone melting became widely used when there was a need in semiconductors of high purity.A knowledge of the mechanism of the solid-phase process of βSn ®αSn [7] land to opinionof possibility to apply it in the analysis of the height purity of Sn.

Theoretical View on The Possibility of Analyzing by V Βsn→Αsn

Analysis of high-purity materials is labor-intensive and often impossible if the sensitivity of classical methods is insufficient [14]. There is a method for measuring the g4.2К, i.e. the ratio R 300K /R 4.2 K, method of residual resistance, which gives an estimate of the amount of impurities in metals [15] of high purity. The residual resistance of Sn at 4.2 K before the transition to the superconducting state depends on its purity and perfection of structure. The R at T of room is almost constant, and the g4.2К, i.e. the ratio R 300K /R 4.2 K, is residual R characterizes the purity of Sn.The purer the metal and more perfect its structure, the lower the R at 4.2 K and the higher the value g4.2К, which serves as a measure of the total content of impurities in metals. But measuringequipment is difficult, and liquid He is rarely available to the most of organizations. Studies of allotropic transformation of Sn [5-7] showed a connection between the purity by g4.2К, and the rate V of its phase transformation into αSn. But also, it seemed unrealistic to use it for analyses after bright experiments [16] showed the impurities in Sn are accelerating, indifferent and inhibiting. Hence, the analysis of the purity of Sn by V βSn®αSnis impossible at it depends on the ratio of concentrations of dissimilar impurities. But the mechanismof distinguishing the role of impurities is not clear at all. If each atom of the impurity violates the g4.2К, of the metal, which theg4.2Кmethod illustrates by analyzingany other metals, why the impurities of different metals differ in their effect on the V βSn®αSntransition. This became clear when we knew the mechanism of infection with the "tin plague" [4]. In [16] was studied Sn not of high purity, there are no errors in experiments. The chaotic nature of the dependences of V on purity is clearly shown [5,7]atstudying the influence of impurities on V of βSn ®αSn. The fact is that the commonly zone melting is powerless to clean from Sb because it has K=1 in Sn. The solubilities of Sb in solid and molten Sn are the same, And the Sb impurity on both sides of the phase boundary is the same and so can’t to be redistributed, as other impurities with K≠1.And in the ores of Sn impurity in the Sb usually dominates. At zone melting cleaning, the Sb impurityalways prevails over the others. And Inhimself like of all metals is inhibitory too by the same reasons, but it was shown as accelerator [16] because In+Sb gives the best seed InSb. And in the Sn of high purity, the impurity of In, like any impurity, individual. But having the knowledge aboutthe dependence of the βSn ®αSnprocess on many factors, it is necessary to observe the requirements 1-4, understood during the experiments for creating a method for analyzes[17].

Experimental Part

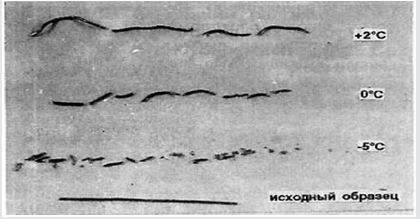
It is possible to create a method for analyzing the purity of V βSn → αSn similar to measurements of residual resistance, suitable for high-purity metals. Previously, it was found [3,5,7] that the dependence of V βSn → αSn on T for any samples has a maximum. This is very easy to understand. At low T with its growth V βSn → αSn grows according to the Arrhenius equation. V cannot grow constantly, because as it approaches the point of the phase transition, it becomes smaller and turns to 0. When infected, Sn crumbles into an arc-shaped powder, making difficult to measure phase shift lengths. Amorphous wires of fast quenching, single crystals of βSn and even annealed wires with slow infection remain almost the original shape but with some bending, and break at V βSn→αSn depending on the T (Figure 1) to parts of different lengths, but almost the same at each T. Accumulation of impurities by the method of residual resistance was recorded in the fracture. It is seen that after the fracture, the sections at each T are close to each other. For analysis, it is necessary that the content of impurities is constant along the length, that is, choose V βSn → αSn for it, V of growth of αSn and V of impurities were now equal, and Sn maintain the solidity too.

Figure 1: Fracture of Sn of different purity with the accumulation of impurities overtaking the phase boundary at its low V. T= +2:0 and -5 ̊С.

Lupinepublishers-openaccess-material-science-journal

Requirements

1) Monoliths are obtained for the growth of αSn [10,11] in the ice shape. The study of a movement of impurities at βSn → αSn allowed us to create a method like of zone cleaning in a solid, but for analysis it is necessary that the content of impurities is constant along the length, that is, choose V βSn→αSn and V of impurities equal and maintain the solid state.

2)Monoliths are obtained by standard preparing a Sn for analysis, so its behavior and structure depends on the previous mechanical and thermal history of Sn. Ins sample in standard quartz formsmelted and cooled under standard vacuum conditions, then Sn melt poured into a SiO2 mold to made identical samples in the form of wire or rod with a spherical surface of one edge of it, then annealed and cooled in vacuum.

3)To create the minimum of seeds by moving of H2O near of the contact Sn of spherical surface of edge with polishedor spherical surface of InSbseed.in thermostat with selected T for analysis.So, to create the minimum of seeds by moving of H2O near of contact Snwith InSb in thetermostat with ice nearly of chooses T.

4)The diagram of calibration dependence of V βSn®αSn / g4.2should be attributed to the same strictly selected T for analysis.

5)The infection V should be measured repeatedly for graphical correction of errors in a visual determination of the length of the infected area. At T, chosenfor aphase transition the impurity does not accumulate, and the concentration along the entire length is constant, which is important for analysis. For the integrity of the sample, it is possible to infect as in [10,11].You can make many measurements V βSn®αSn on length, reducing the measurement error statistically. The sections along the path of the Snwhite – dark border is measured repeatedly over time. After the end of the analyze measurement with standard remelting, the αSn is converted to βSn, especially if the analysis result must be checked by direct measurement g4,2K, which is applicable only f or metals. According to the graph for a given analysis at T V βSn ®αSn from g4,2Kfind the purity of Sn. Measures of V different samples gave 1.37 and 1.41 mm/hour, corresponded to g4,2K47 500 and 55 000. Control analyses of them give g4,2K46,800 and 55,400. Errors of 1.5% and 0.8% within the measurement accuracyof V and g4,2K. And to check the reproducibility of results in 10 standard samples, an infection V was measured on the same day in the same thermostat. The average of a value of V is 1.48 mm/ hour. A maximum deviation V valueof one sample was 1.46 mm / hour, which is 1.3%, all the others gave 1.48, 149, 1.47.

Summary

By using for the practical aims of “terrible tin plague” along with its application to obtain pure powders of a given dispersion, for further purification of high-purity tin, for growing profiled crystal of a unique material αSn even with p/n transition, simple accessible method of purity Sn analysis was created, which seemed fundamentally impossible. The accuracy and reliability of the results of the proposed method with obvious availability, accessibly and simplicity even is not complicated and complex method of residual resistance without using of liquid helium. Here is only whether the method can be considered created until it still not published and not known to researchers, for whom, and not for corrupt officials, this work was done.

Read More About Lupine Publishers Journal of Material Science Please Click on Below Link: 

Saturday 22 October 2022

Lupine Publishers | Mechanical Ventilation Basic Terms and Physiology

 Lupine Publishers | Journal of Anesthesia & Pain Medicine


Terms and Physiology

There are some terms related to mechanical ventilation which the healthcare professionals who deal with the patients who are placed on the ventilator for various reasons, should have knowledge about them.
Based on the selected mode of mechanical ventilation there are “Control “variables like volume or pressure-controlled ventilation modes. Mechanical ventilation’s dependent variables are “ Conditional “ variables. “ Trigger “ initiates the inspiration. As a matter of fact, one breath can be time, pressure or flow triggered. End of inspiration and beginning of exhalation determinant would be the “ Cycle “. The mechanical ventilator can be time, volume and pressure cycled. Mechanical respiratory cycle’s resistive forces are named “ Airway resistance “ which its normal range is equal to or lower than 5 cmH2O. [1-2]
Atelectasis causes surface area’s gas exchange loss which is called “ De-recruitment “. Increasing PEEP can minimize Derecruitment which is among the most common cause of gradual hypoxemia in the patients who are intubated. Reopening the lung’s atelectatic or collapsed areas with pressure application and gas exchange surface area’s restoration, is called “ Recruitment “. Lungs elasticity or their ease to expand and stretch in response to volume or pressure changes is called “ Lung compliance “. Highly compliant lungs can be seen in the Obstructive lung diseases and Lungs with a low compliance can be seen in Restrictive lung diseases as an example. The weight which should be used in ventilator settings determination is “ Predicted body weight “ or “ PBW “. Height and sex are two factors which determine lung volumes and therefore they should be used in PBW determination. [3-4]

Read More About Lupine Publishers Journal of Anesthesia & Pain Medicine Please Click on Below Link:
https://lupine-publishers-anesthesia-pain.blogspot.com/

Friday 21 October 2022

Lupine Publishers | Pethidine Infiltration in Intra Fascial Layer After Abdominal Hysterectomy

 Lupine Publishers | Journal of Gynaecology and Women's Healthcare


Abstract

Introduction: multimodal analgesia regimen has a cornerstone component involving local wound infiltration with analgesic agents to manage and enhance post-operative pain to increase patient satisfaction.

Aim: assessment and evaluation of effectiveness of local pethidine infiltration as a local analgesic in total abdominal hysterectomy.

Methodology: A cohort of 151 cases that have undergone abdominal hysterectomy have been categorized randomly into two research groups research group I (n=74 cases), involved women that were administered both wound infiltration and IM pethidine; and research group II (n=77 cases), involving women that were administered IM pethidine.

Results: The median 10-cm VAS for postoperative pain was significantly lower in women who received both WI and IM pethidine when compared to women who received only IM pethidine, 1 hour, 6 hours, 12 hours and 24 hours postoperatively. The mean total morphine consumption was lower in women who received both WI and IM pethidine when compared to women who received only IM pethidine.

Conclusion: Pethidine when administered in a simultaneous manner intrafascially and intramuscularly in cases undergoing total abdominal hysterectomy is more effective in reducing post-operative pain levels

Introduction

Post-operative pain management in cases undergoing total abdominal hysterectomy is considered a major challenge for both gynecologists and anesthesiologists aiming for enhancing patient satisfaction and level of health care service requiring multidisciplinary management and planning regarding the pathway of pain management of pain [1,2]. Despite the fact that epidural form of analgesia is an efficient mode of managing post-operative pain in abdominal surgeries however less invasive forms are considered more practical and applicable for many health care systems [3,4].

Local analgesia infiltration is considered a simple and efficient mode of pain management that has reduced costs in comparison to epidural analgesia. Advancing the pain management protocols could enhance patient post-operative recovery and improve clinical outcomes [5,6]. A widely implemented synthetic opioid known as pethidine causes its analgesic action by Functioning as an agonist on opioid receptors, furthermore it has been revealed and displayed to exert a local anesthetic impact chiefly via Linked to its interfaces with sodium‑ion Channels that are voltage‑dependent. peripheral nerve conduction blockage action has been revealed and displayed widely in various in vivo and in vitro experimental animal research studies that makes its applicability in clinical practice in humans a promising protocol of management [7,8].

Furthermore, pethidine has been shown to block conductivity in both motor and sensory neural systems via electrophysiological research studies making this issue a matter of interest to investigate its impact on patients undergoing abdominal surgeries via research studies aiming to merge from them evidence-based protocols in practice [9,10]. The privilege of local anesthetic agents’ infiltration interestingly has revealed that there are no local anesthetic toxicity issues arise if properly administered in a professional manner, no wound infection or healing issues due to usage of this form of analgesia making it an attractive mode for postoperative pain management for both gynecologists and anesthesiologists [11,12].

Aim of the Study

Assessment and evaluation of effectiveness of local pethidine infiltration as a local analgesic administered intrafascially in total abdominal hysterectomy.

Methodology

A randomized controlled research trial performed at Ain Shams University Maternity Hospital 151 cases that have undergone abdominal hysterectomy have been categorized randomly into two research groups research group I (n=74 cases), involved women that were administered both wound infiltration and IM pethidine; and research group II (n=77 cases), involving women that were administered IM pethidine. Oral and written consent form was obtained from the study subjects with the American Society of Anesthesiologists physical Status I‑II, aged range 45 to 65 years, who were recruited for total abdominal hysterectomy and bilateral salpingo‑oophorectomy, under general anesthesia via performing a Pfannenstiel incision. The exclusive research criteria involved malignancy, cases on chronic analgesic agents, known allergy to local anesthetics, morphine, pethidine, or nonsteroidal anti‑inflammatory drugs, with chronic hepatic disease, chronic renal impairment, coagulation abnormalities and DM. After performance of wound closure, cases recruited for wound infiltration research group were administered 1mg/kg of pethidine dosage divided half intrafascially, prepared in a 15ml saline syringe and an half IM injection in simultaneous manner in a solution of 2.5ml saline, while the cases recruited for the IM research group were administered an IM injection of 1mg/kg pethidine in a solution of 2.5ml saline with simultaneous infiltration of 15ml of normal saline intrafascially.

Pain assessment

was conducted by usage of a point visual analogue scale (VAS) at 1, 6, 12 hours, at 24 at rest and with cough in the post-operative period. The study subject was asked to mark on the line the pain she feels. The usage of standard 10cm visual analogue scale (VAS) for scoring pain level was explained to the patient during the preoperative visit represented 0=no pain and 10=the most severe pain.

Ethical approval

The research study had approval from the Ethical Committee of the Department of Obstetrics and Gynecology, Faculty of Medicine, Ain Shams University and fulfilling declaration of Helsinki ethical principles for medical research involving human study subjects 2001.

Sample size justification

Data from a previous study Stamatakis et al. [12] showed that the mean values for 24-hour total morphine consumption in cases who received wound infiltration and in those who received intramuscular pethidine were 11.33 ± 8.3 mg and 15.56 ± 9.69 mg, consecutively (p< 0.05). Calculation according to these values, setting the type-1 error (α) at 0.05 and the power (1-β) at 0.8, produced a minimal sample size of 72 women in each group. Assuming a drop-out rate of 5%, a total number of 154 cases were needed to be randomized into two groups.

Statistical methods

Statistical analysis was performed using Microsoft Excel version 2016 and SPSS for Windows version 22.0. Data were presented as range, mean and standard deviation (for normally distributed data); range, median and interquartile range (for discrete or skewed data); or number (percentage) for categorical data. Difference between the two groups was analyzed using independent student’s t-test (for normally distributed data); Mann-Whitney’s U-test (for discrete or skewed data); or chi-squared test for categorical data. The mean differences and risk ratios were presented with their 95% confidence intervals, as well. Significance level was set at 0.05.

Results

Table 1: Initial Characteristics of Included Women in Both Groups.

lupinepublishers-openaccess-journal-gynaecology-women-health-care

WI wound infiltration

IM intramuscular

BMI body mass index

EBL estimated blood loss

Data presented as mean ± standard deviation

MD (95% CI) mean difference and its 95% confidence interval

1 Analysis using independent student’s t-test

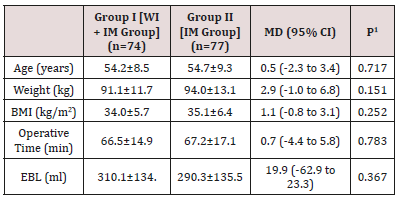
Table 1 reveals and displays that there was no statistically significant difference as regards age (years), weight (kg), BMI (kg/m2), operative time (min), estimated blood loss (ml) (p values =0.717,0.151,0.252,0.783,0.367, consecutively).

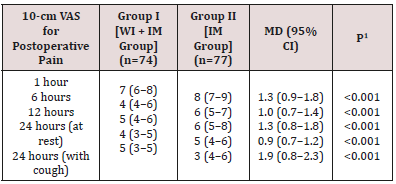
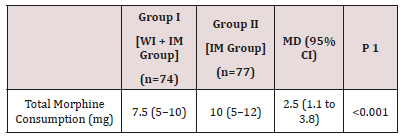
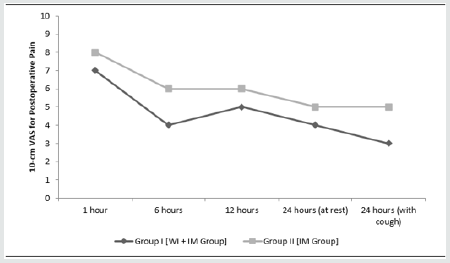
A total of 151 women who underwent abdominal hysterectomy completed the study were included in the final analysis. They were randomized into one of two groups: group I (n=74), including women who received both wound infiltration and IM pethidine; and group II (n=77), including women who just received IM pethidine. (Table 1) shows the initial characteristics of included women in Citation: Raafat TA, Mostafa M S. Pethidine Infiltration in Intra Fascial Layer After Abdominal Hysterectomy. Int Gyn & Women’s Health 3(1)- 2019. IGWHC.MS.ID.000153. DOI: 10.32474/IGWHC.2019.03.000153. 3/4 both groups. There were no significant differences between women of both groups, regarding the age, weight, BMI, estimated blood loss and operative time. The median 10-cm VAS for postoperative pain was significantly lower in women who received both WI and IM pethidine when compared to women who received only IM pethidine, 1 hour, 6 hours, 12 hours, and 24 hours postoperatively (Table 2, Figure 1). The mean total morphine consumption was lower in women who received both WI and IM pethidine when compared to women who received only IM pethidine (Table 3). As regards the pethidine-related adverse effects, the rates of nausea/ vomiting were comparable in both groups of women. The median sedation score was, however, significantly higher in women who received both WI and IM pethidine when compared to women who received only IM pethidine (Table 4).

Table 2: VAS for Postoperative Pain in Included Women in Both Groups.

lupinepublishers-openaccess-journal-gynaecology-women-health-care

WI wound infiltration

IM intramuscular

VAS visual analogue scale

Data presented as median (interquartile range)

MD (95% CI) mean difference and its 95% confidence interval

1 Analysis using Mann-Whitney’s U-test

Table 2 reveals and displays interestingly a statistically significant difference as regards VAS scoring between group I and group II at 1,6,12,24 (at rest), 24 (with cough) (p values < 0.001) being lower in research group I (wound infiltration +IM).

Table 3: Total Morphine Consumption in recruited Women in Both Research Groups.

lupinepublishers-openaccess-journal-gynaecology-women-health-care

WI wound infiltration

IM intramuscular

Data presented as median (interquartile range)

MD (95% CI) mean difference and its 95% confidence interval

1 Analysis using Mann-Whitney’s U-test

Table 3 reveals a statistically significantly lower morphine consumption levels in the research group administered both wound infiltration and IM pethidine administration than the IM only research group. (p value< 0.001).

Table 4: Pethidine-related Adverse Effects in Included Women in Both Groups.

lupinepublishers-openaccess-journal-gynaecology-women-health-care

WI wound infiltration

IM intramuscular

Data presented as median (interquartile range); or number (percentage)

MD (95% CI) mean difference and its 95% confidence interval

RR (95% CI) risk ratio and its 95% confidence interval

1 Analysis using Mann-Whitney’s U-test

2 Analysis using Chi-Squared test

Table 4 reveals clearly that sedation score levels were much higher in a statistically significant manner in the research group administered both wound infiltration and IM pethidine administration than the IM only research group. (p value< 0.001) whereas there was no statistically significant difference as regards nausea and vomiting between both research groups (p value=0.420).

Discussion

Infiltrative form of analgesia locally acts by blockage of pain transmission due to triggering of voltage‑dependent sodium channels, and additionally, sensitizes noci receptors by decreasing inflammatory mediators release responsible for pain [13,14]. Exploring and advancing post-operative pain management is a crucial issue in gynecological practice particularly in frequently performed procedures such as total abdominal hysterectomy .Pethidine as a frequent and preferred analgesic implemented for control of pain could be administered in a more efficient manner when considering its usage in a local and systemic manner that raises the effectiveness in the total performance level of the agent as an analgesic [1,3,5]. The current research study revealed and displayed the following findings that prove the higher privilege in administering I.M pethidine and local fascial layer infiltration to reduce pain levels without increasing side effects such as nausea and vomiting in which sedation score levels were much more higher in a statistically significant manner in the research group administered both wound infiltration and IM pethidine administration than the IM only research group.(p value< 0.001) whereas there was no statistical significant difference as regards nausea and vomiting between both research groups (p value=0.420).

Figure 1: VAS for Postoperative Pain in Included Women in Both Groups. Figure 1 displays clearly lower VAS scoring levels in cases having simultaneous administration of Pethidine intrafascially and intramuscular forms in research group I in comparison to research group II having intramuscular pethidine only. .

lupinepublishers-openaccess-journal-gynaecology-women-health-care

Concerning pain levels estimated by using VAS scoring system Table 2 reveals and displays interestingly a statistically significant difference as regards VAS scoring between research group I and research group II at 1,6,12,24 (at rest), 24 (with cough) (p values < 0.001) being lower in research group I (wound infiltration +IM). That finding could be justified by the fact that both the local action of pethidine on sodium channels and systemic action on opioid receptors have been elicited by using wound infiltration in the fascial layer and I.M forms of administration adding a clinical value in patient recovery within the post-operative period.

As regards morphine consumption that is an issue of concern for clinicians and surgeons due to the fear of possible clinical side effects Table 3 reveals a statistically significantly lower morphine consumption levels in the research group administered both wound infiltration and IM pethidine administration than the IM only research group. (p value< 0.001). Similarly, a prior research study similar to the current research have revealed that the effectiveness of wound infiltration during performance of total abdominal hysterectomies, in decreasing the opioid consumption levels during the first 24 hours of postoperative period that is in great harmony with the current research study results that issue could be justified by a hypothesized mechanism demonstrated in abdominal surgeries by usage of a neuroanatomical approach. Similarly, prior research groups have revealed interestingly that subcutaneous administration of pethidine, in comparison to bupivacaine, have an opioid‑sparing impact after cesarean delivery procedures [7,9,11].

Similarly another research study performed by a similar methodology performed to evaluate the effectiveness of sole administration of pethidine intrafascially in comparison to I.M injection have shown that Postoperative VAS scoring levels have revealed no statistically significant privilege between wound infiltration and intramuscular method, whereas the total consumption of morphine was lower in the IM, in comparison to the wound infiltration research group (27.2%). The research team in that study came to the conclusion that local wound infiltration with pethidine after total abdominal hysterectomy did not decrease the total morphine consumption levels within the first 24 hours postoperatively that shows great contradiction to the current research study findings [12].

As a sole agent pethidine, was displayed by prior research team of investigators to be efficient and effective in accomplishing a successful transversus abdominis blockage during conductance laparoscopic cholecystectomy [2,4,15]. Furthermore, there are numerous research studies assessing the local analgesic effectiveness of pethidine, particularly in performing peripheral blockage action. Additionally, in orthopedic surgery research wound infiltration analgesia implementing pethidine causes a postoperative analgesic impact in cases undergoing total hip replacement, chiefly by blockage voltage‑activated sodium channels present within the nerve endings and by interaction with opioid receptors [6,8]. Contradicting with the current research study findings it was revealed priorly that pethidine showed failure to control pain by wound infiltration after performance of laparoscopic tubal ligation. The finding was justified by the research team due to the dosage used, and to the issue that the visceral pain experienced by the cases was more overriding, in comparison with the pain correlated to the wound due to trocar insertion, where the infiltration was conducted. Furthermore, contradicting with the current research study in a similar fashion it was shown that wound infiltration using a local anesthetic had no opioid‑sparing impact after performing total abdominal hysterectomy, as regards morphine consumption levels [10].

Conclusion

Pethidine when administered in a simultaneous manner intrafascially and intramuscularly in cases undergoing total abdominal hysterectomy is more effective in reducing post operative pain levels. However, the current study results should be interpreted with caution as other variables are required to be put in consideration in future research studies such as racial and ethnic differences and normal anatomic integrity such as cases with prior abdominal incisions could have more fibrosis affecting drug absorption levels intra facially. Future research efforts are recommended to be performed in a multicentric fashion with larger numbers of cases to elucidate the usefulness of local pethidine administration by wound infiltration in comparison with other analgesic agents and at different anatomical planes in ac comparative manner such as subcutaneous layer. Other gynecological procedures should be put in consideration in future research such as total laparoscopic hysterectomy and commonly performed obstetric procedure such as cesarean section deliveries in which wound infiltration should be implemented in a manner permitting useful implementation of clinical guidelines aiding in improving postoperative recovery.

Read More About Lupine Publishers Journal of Gynecology Please Click on Below Link:
https://lupinepublishers-gynecology.blogspot.com/

Thursday 20 October 2022

Lupine Publishers | Human Brain Quantum Psychology (HBQP) to use Brain as Virtual Time Machine (VTM)

 Lupine Publishers | Journal of Psychology and Behavioral Sciences


Introduction

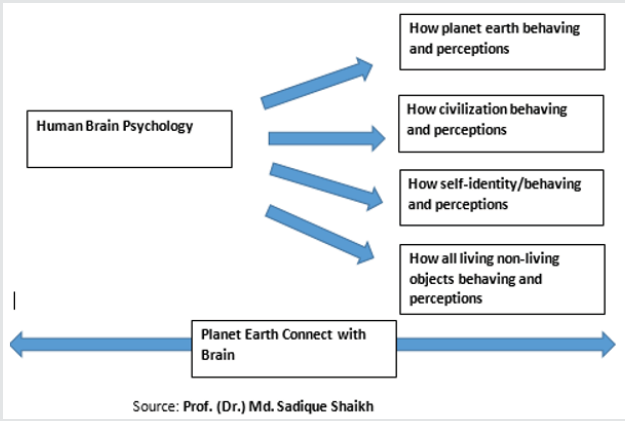
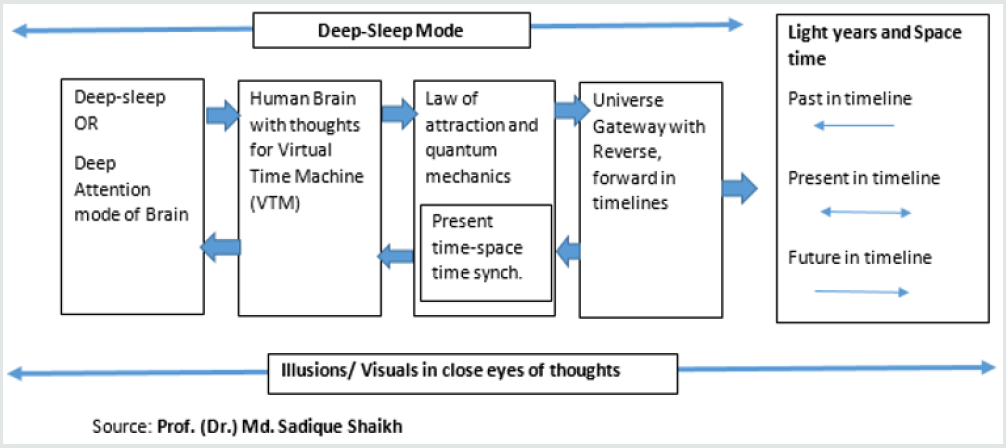
Being outstanding scientist and successful researcher after my huge experience I came to write this fact, what you are just because of thoughts process leads to your thinking and in result you are get your view and visuals to see your universe (Androphobic Principle: our universe result of consciousness) which completely different appearance from other one and it’s not a science fiction or philosophy it’s a “Human Brain Quantum Psychology (HBQP)”. Now what HBQP, how its work and how it’s correlate with the concept of “Virtual Time Machine (VTM)” discussed in this write-up. In general human psychology practitioners as well as mankind themselves only aware themselves with their entity and existence on planet earth and treating self only a part of earth which is a planet just like particle in universe and exist in universe. Hence unaware with the fact they are not only part of planet earth but more than of entire universe (Figures 1-3). Therefore in every think , act, thoughts, feelings, emotions, perceptions, response, stimuli’s and action only relevance to earth not to universe but in fact we know or we don’t know our psychology working on the principles of Quantum Mechanics and Space Physics, after all we are active part of this universe and every visuals at every second front of us because of our quantum thoughts which develop our Quantum Psychology which is accepted and executed by universe what we knew as our “Life” as we want or don’t want based on your thoughts and feelings and your brain is a machine for the production of the same. Hence as you thoughts according to it universe develop your Quantum Psychology and you will see that pictures in form of desires, needs, wish, work accomplishment and all of these because of “Human Brain Quantum Psychology (HBQP)” where thoughts frequencies are the command to universe for your life whereas Quantum Mechanics channel between human brain and universe to develop what mental model and life every humankind at the time want to live. Now after this I want to demonstrate you the idea how brain can behave like “Virtual Time Machine (VTM)” using Universe, Quantum Mechanics, Law of Attraction, Anthrophobic principles and Human Brain Quantum Psychology (HBQP) depicted in below model.

Figure 1: Human Brain psychology Life cycle.

Lupinepublishers-openaccess-journals-psychology-behavioral-science

Figure 2: How to plan human brain perceptions.

Lupinepublishers-openaccess-journals-psychology-behavioral-science

Figure 3: Deep-Sleep Mode

Lupinepublishers-openaccess-journals-psychology-behavioral-science

Mankind since longtime trying to research and explore the concept of physical time machine but not focusing attention on their dreams which are the visuals/pictures/science of past, present or future which everybody used to do so. Hence my concept originated from dreams to define “Virtual Time Machine (VTM), of course virtual time machine you can say dream or dream-like but not the dream surely due to the one biggest reason and difference “Dreams occurred in sleep unintentionally and no control it might be good or bad or else, but in Virtual Time Machine (VTM) we can only dream intentionally what we thought and want to dream with entering in that era of time virtually via your dreams”. Hence can say dream is the source to enter you in Virtual Time Machine in what time you want to enter with illusions/visuals/moving pictures of it scene like reality. For the concept you need deepsleep, like hypnotism, attention, calmness with thoughts with time in which you want enter and will put you with law of attraction in it with present-time space-time synching via connecting to universe gateway to the universe using law of quantum mechanics to reverse and forward your timeline in space timeline and light years and put you in visuals like virtual reality in past, present and future timeline witching and tuning and Universe back it to you in your brain like Virtual Time Machine (VTM).

Read More About Lupine Publishers Journal of Psychology Please Click on Below Link:
https://lupine-publishers-psychology-journal.blogspot.com/

Wednesday 19 October 2022

Lupine Publishers| An in vivo study for the effect of Citrus reticulata (Rutaceae) fruit peels extracts on the onset of toxicity of Cerastes cerastes venom in Albino mice

 Lupine Publishers| Journal of Drug Designing & Intellectual Properties


Abstract

Venom of Cerastes cerastes has been extracted and its toxicity was investigated in the presence of aqueous and methanolic extracts of Citrus reticulata (Rutaceae) fruit peels. The decline in the mean survival time of the male albino swiss mice were used to deduce the venom property in the presence and absence of aqueous and methanolic extracts of Citrus reticulata (Rutaceae) fruit peels. The aqueous and methanolic extracts of Citrus reticulata (Rutaceae) fruit Peels significantly decrease the mean survival time compared to the venom alone. From these results it was evident that the toxicity of Cerastes cerastes venomis increased significantly in the presence of Citrus reticulata in a dose dependent manner

Keywords: Citrus reticulata; Cerastes cerastes; Venom; Toxicity

Introduction

Snakebites are severe socio-medical difficulty that lead to morbid and fatal affect on victims in Libya and other North African countries [1,2]. Immediate antivenom treatment is crucial and vital to avoid morbidity and mortality [3]. The oxidative trauma condition, which result from snake bite envenomation is another measurement of kidney destruction and severe renal failure [4], connected with the antioxidant defense system, that might be subject for treatment by antioxidant therapy [5]. ROS (Reactive oxygen species) are engaged in many inflammatory reactions, thus influencing the physiology of the cells and participate a significant function in the pathological conditions [6]. As have been free radical, ROS are involved in harming cellular components, and they play an important function in venom induced toxicity, as reported among envenomed mice [7]. Ascorbic acid is an antioxidant that has been reported to have useful effects on a number of cancer types [8,9] and could be concerned in alleviation of Reactive oxygen species cellular damage, produced during exposure to toxins, metabolism and carcinogens [10]. In addition to augmentation of protease inhibitor effects concerned in preventing organ efficient injure [11,12]. Citrus reticulata (Rutaceae) is commonly known as narangi or santra (orange). It is a small spiny tree with thick top of slim branches, extensively grown in Egypt, Tunisia and Libya [13]. Mandarin is a collection name for this class of orange with thin, loose peel. The name ‘tangerine might be applied as an interchange name to the entire group, but in trade, it is usually limited to the types with red-orange skin. The fruit has aphrodisiac, laxative, tonic and astringent properties [14,15]. It is also used to alleviate vomiting [16,17]. The fruit peel controls the skin moisture, rough and softens hard skin and possess a cleaning effect on oily skin [18]. Chemical composition of the volatile oil of the fruit peels of this species has been reported [19-23]. The effects of the volatile oil of C. reticulata has been studied against Saccharomyces cerevisiae [24], pathogenic fungi, Paenibacillus larvae, Schistosoma mansoni, Aspergillus flavus , and other microorganisms [25-30]. Very recently, the volatile oil of C. reticulata also demonstrates anticancer activity [31-33]. The main aim of the current study is to investigate the effects of Citrus reticulata (Rutaceae) fruit peels extracts on the toxicity of Cerastes cerastes venom in albino mice.

Materials and Methods

Collection of plant material and preparation of aqueous extract

The oranges were bought from a shop in Tripoli (February 2019), and the Citrus reticulata was identified and authenticated by a botanist. Orange rinds were peeled off carefully with the help of a sharp razor blade, and each rind sample was cut into smaller pieces and 30g mass of the sample was taken. The sample was initially rinsed with distilled water, and the fresh peels (30g) were added to 30ml hot distilled water. In addition, another 30g of the fresh peels were macerated in cold 99% methanol for three hours at room temperature (28-30 °C), the mixture was then filtered under vacuum and the filtrate was stored at 4 °C and used when appropriate [34].

Experimental models

Albino mice (Swiss type) of either sex weighing approximately 18–28g (2 to 2.6 month old) were utilized for investigational purpose. They were kept in cages made from polypropylene in airconditioned room with the temperature retained at 25±2 °C, and twelve hours sporadicing dark and light cycles. The mice were supplied with drinking water ad libitum and an adequate diet during the study. The authorization for the experimental procedures was obtained from the Animal Ethics Committee.

Venoms

Cerastes cerastes venom was extracted by means of physical stimulation and was gained in liquid forms, from the Faculty of Science, Zoology Department, University of Tripoli (Libya) and kept at –20 °C until utilize. A 7.5μl aliquot from the venoms was added to eight hundreds microliter of normal saline. A dosage of hundred microliter (100 nanogram) was administered to the male Swiss Albino mice.

Acute toxicity study

Acute toxicity was commonly performed to determine the LD50 value in experimental animals. The intend of doing acute toxicity study is to establish the therapeutic index of a methanolic and aqueous extracts of Citrus reticulate and to guarantee the in-vivo safety. The acute toxicity experiment was done in mice, in which all animals were overnight fasted prior to treatment and given food one hour after aqueous and methanolic extracts administration, with the period observation of common behavior at 0.5, 1, 8, 12 and 24 hours. The number of animals that died after taken the extracts was monitored daily for 7 days [35,36].

Intoxication of venom by Citrus reticulata extracts The animals (albino mice) used in this study were divided to ten groups, each of them is of six mice (male or female). Five groups were used to investigate the aqueous extracts, while the other were used for methanolic extract. The first group received only hundred microliter (hundred microgram of total protein) of the Cerastes cerastes venom (LD99 5μg/kg). Groups 2 to 4 were used as treatment groups and given an equivalent amount of the Cerastes cerastes venom with 50μl, 100μl and 200μl of aqueous Citrus reticulate extracts intraperitoneally (30g/30ml), respectively. Group 5 was given 100μl of the Cerastes cerastes venom and polyvalent anti-snake venom (ASV) was bought from India from Haffkine Bio-Pharmaceuticals Company. The number of death was recorded within twenty-four hours. Similar experiments were repeated in the same manner with the methanolic extract using groups 6 to 10.

Statistical analysis

The difference among various control group and treated groups were analyzed using ANOVA method of one-way. The obtained results were dealt with using unpaired Student’s test. All results were articulates as the mean±SEM of the number of experiments performed, with P value less than 0.05 showing significant difference among groups.

Results and discussion

Acute toxicity study

With the growing amount of research about naringin as a component of the orange and its potential utilize within the pharmacological and food industries, illuminating its toxicological outline becomes increasingly significant. In the present study, the Citrus reticulata extracts were found to be safe up to 200mg/kg orally. This present study is compared with other previous studies in which an oral single dose of 16g/kg of naringin did not produce acute oral toxicity in rats [37].

Acute toxicity of Cerastes cerastes venom and its reaction with aqueous and methanolic Citrus reticulata extracts and antivenom The Cerastes cerastes venom at the dose five micrograms per kilogram (LD99) produces 100% mortality in mice. The aqueous and methanolic Citrus reticulata extracts significantly decrease the mean survival times by 3, 5 and 6 times for 50, 100 and 200µl (30g /30mL), respectively when compared with the venom alone which was 3.1±0.3 hours. ASV was established to be efficient and showing mean survival of 2-days for 5-mice and absolute survival of one mouse. The Cerastes cerastes toxins contain of cardiotoxin, neurotoxin, proteins and enzymes. The victim may die from respiratory troubles which is the main cause of death. Assisted ventilation and ASV can save life in a lot of cases [38-40].

It has been reported that the citrus species contain glycosides and flavonones in huge amounts, and they play a main function in treating a range of pathological conditions. Hesperidin and naringein, are the major components of the citrus fruits. Intestinal microorganism are able to convert naringin into naringenin (an aglycone part). They established to have metal chelating effect, antioxidant, antidiabetic, antiviral, antiallergic, antiestrogenic, antimicrobial, ischemic heart disease adipolytic activity, anti-inflammatory, antiobesity, hypoxia, anti-cancer and hepatoprotective activity. Because of all these pharmacological action, both naringenin and naringin are assumed to be useful as a food supplement [41-47]. The accelerated death could be related to the interactions of Citrus reticulata components (which were mainly polyphenolic components) with snake venom which is not consistent with the previous studies reporting that secondary metabolites polyphenol are competent to inhibit PLA2 [48]. In the literature, it has been reported that naringin which is a flavonoid that is contained in grapefruit and recognized for its various biochemical activities and pharmacological effects on a secretory phospholipase A (sPLA2 ) of Crotalus durissus cascavella, is concerned in the releasing of arachidonic acid in phospholipid membranes [48]. sPLA2 was incubated with naringin in a ratio of 1:1 mole at 37 °C and a distinct decrease in the ultraviolet absorption signal and a changes of the circular dichroism spectra suggesting a significant effect of PLA2 structure and function [48]. The obtained results are for the whole extract of Citrus reticulate and not for naringin or naringenin and this could be explained for the lack of association between pharmacological and enzymatic activities in which the chemical modification of some amino acids induced by naringin, in particular aromatic amino acids and histidines, affected the toxin’s ability to interact with the pharmacological receptor, but did not lead to eliminate of this function. Our results and those described by Cardoso et al. expressed that enzymatic activity of sPLA2 is not crucial for pharmacological activities of this sPLA2 which was isolated from C. d. cascavella venom [49].

Conclusion

The present study confirmed that the aqueous extract of peeled Citrus reticulate accelerate the onset of toxicity of Cerastes cerastes venomis in a dose-dependent effect.

Read More About Lupine Publishers Journal of Drug Designing & Intellectual Properties Please Click on Below Link: https://lupine-publishers-drug-designing.blogspot.com/

Tuesday 18 October 2022

Lupine Publishers| Role of Family Support & Technical Training in Women Empowerment

 Lupine Publishers| Journal of Textile and Fashion Designing


Abstract

Purpose: The purpose of this research is to explore the role of family support through the support of TVET towards women empowerment and socio-economic growth. This research has highlighted the challenges being faced by women and the recommendations to overcome those challenges and getting the required targets positively.

Design/Methodology/Approach: This is a quantitative study. The target population for the study is the women getting technical training from different readymade garment training institute Lahore. Total number of respondents are 130. A questionnaire was developed in close consultation with industry and academia experts and was used for the data collection. Data is collected using convenience approach. The questionnaire was based on the seven-point Likert scale. Reliability and Validity was checked through factor loading, composite reliability, average variance extracted etc. ADANCO software was used to test the hypothesis through regression analysis.

Findings: The findings showed that family support has significant impact on TVET. TVET has significant impact on Women Empowerment and Women Empowerment has significant impact on socio-economic growth.

Research Limitations/Implications: The research is limited to Lahore, whereas the same can be expanded to all over Pakistan for a deeper insight to understand the importance of TVET sector towards economic growth.

Practical Implications: This research can help understand the different aspects of empowering women and how it will support the socio-economic growth of a country. It will also help in understanding the weak areas to be considered and settle down.

Originality/Value: There are extensive research done on women empowerment, but there is little research done on the women empowerment with the mediating effect of family support and TVET sector in context of Pakistan. The model used in the research are original and designed by researchers themselves.

Keywords: Socio Economic Growth; Family Support; TVET Sector; Women Empowerment

Introduction

When basic necessities of life are not full filled than it develops socio economic problems in a country. Basic needs are basically food, clothing and shelter. Pakistan is the developing country and facing such kind of socio-economic challenges. The actual issue is not these problems, but the week policies been implemented presently [1]. The literacy rate of Pakistan remains static at 58 percent with 70 percent of males and 48 percent of females in it [2].

Pakistan is facing high level of unemployment in different sectors due to significant skill gap despite of the massive growth of the growth of TVET sectors in Pakistan. Industry is facing major hindrances due to non-availability of skilled workers. TVET sector has huge potential in reducing skill gap. Annual growth rate of 1.8% the proportion of (15-29) year population is around 28% with Male 51% and female 49%. It is reported that 3581 (vocational: 2,647 & technical: 934) public & private TVET institutions are found in Pakistan with annual supply of skilled labor force of 314,176 to labor market. This is relevant to mention that private institutions are contributing 11% in technical skills while 55% are share of vocational trade in skilled workforce [3].

Technical and vocational education has been defined as practically demonstrated occupational skill for different fields of technical and vocational training in fields like business, agriculture, cooperate and services sectors, health, marketing, trade etc. [4]. In order to attain sustainable economic growth, the key element is the TVET education in any developing countries. The importance of TVET sector recognized in terms of skill development. It helps to overcome the socio-economic challenges faced by women in their life. Skill development is not only improving the standards of person but also contribute in the growth of economy [5]. The role of industries is essential in producing quality people for job market. The government alone can’t produce needed workers for job market without the help of industry. The skills are not enough for the development but there is a need of place to show the results of that skills [3].

The major hurdle in solving these challenges are lack of education and the family support towards getting education. Major researches revealed that family support plays a major role in getting education and skills for both males and females equally. Many families are not in favor of technical education and not considered it suitable to work in industries especially for females [6]. Parents support and influence considered as important factor towards technical education. Research revealed that females having family support and encouragement are more successful their career [7].

Empowerment means the expansion in people’s ability to make strategic life choices in a context where this ability was previously not available to them. The term ‘Empower’ means to give legal power or authority to act” [8]. Women empowerment means equal opportunity in education, employment, rights and giving secure working environment. It means giving them enough confidence to participate and give suggestions to any discussion relating to them [8]. It has been explained that technical & vocational education and training in women empowerment process specifically in local level not only provide self-employment opportunity to the women but also trigger capability to exercise control over their personal and family life, make choices to improve well beings and take active role in decision making [4]. For economic development of a country, education and skill development play a vital role. TVET is basically a technique for overcoming socio economic challenges and promoting economic growth [9].

Research Objectives

The objective of this research is to analyze the women empowerment from different dominations.

a) Skill development is a powerful and short-term way towards women empowerment.

b) To analyze family support as major variable towards approval of female’s education.

c) Skilled women can financially support herself but also family.

d) Technical education and women empowerment contribute towards socioeconomic growth.

Research Questions

There are three research questions

a) Does Family support has a positive impact on TVET Sector towards skill development?

b) Does TVET sector has a positive association with women empowerment?

c) Does Women Empowerment has a positive impact on Socio economic growth?

Literature Review

Women Empowerment

When women has the capability to prosper and develop economically and the confidence to make decisions for benefits of the economy are known as empowering women economically. Women empowerment is important to understand their rights and increase the standard of their household/family and also for the growth of the economy. Empowering women is also helpful in attaining development goals like poverty reduction, unemployment, increasing productivity and efficiency, health, education and growth of economy [10].

To prosper the economy and increase the growth of economy, development programs put more focus on women empowerment. Economically strong is considered as one of the most influential tools to achieve their targets. When women have the skills, they can avail opportunities equally and contribute more towards their families and nation. Basically, women have good business sense and by their skill development they can contribute towards market and business growth for sustainable economic development [11].

TVET Sector

The research revealed that for sustainable economic development the education and vocational training are major pillars. Technical training plays a key role to meet the new challenges of developing economy and achieving the development goals essential for prosperity of nation. TVET sector contributes a lot by producing quality skilled workforce to meet the demands of industry by working effectively and efficiently. In era of globalization, development is also helpful in achieving goals regarding advancement of technology [12].

The research report revealed two main reasons of the technical and vocational skills towards its contribution in economic growth. Profitability and growth are two main purposes of any organization and for enhancement of both technical and vocational training are becoming core requirement of any company. Growth of enterprise is basically the development of economy. So, the first reason is the demand of skilled workforce due to competition in markets, technology advancement and change in working structure. The second reason for skill development is growth and prosperity of the individual herself. Technical training means direct entry in the job market or upgrading the career and bring increase in earning which help one’s to improve their standard of living by overcoming the challenges faced by them in daily life [13].

Family Support

Result of this research revealed that one of the demotivated factors towards technical education is lack of family support. All because is of the lack of knowledge and interest regarding technical education. Family support have shown significant impact towards economic growth. Empowering women leads towards economic growth by giving women the self-employment opportunities. All this is possible through technical and vocational training as TVET means direct and upgraded entry in to the job market [7].

Women Empowerment, TVET Sector and Economic Growth

To empower women with the skills to participate fully in the development process technical training and basic education are most important techniques. Technical education is fast track entry route towards availing opportunities and economic growth. If they women are educated, they can be aware of the opportunities around them, take care of their health and can change the standards of themselves and of family. The paper stated that in developing countries empowering women means minimizing socio economic challenges and bring major change in growth of economy [14].

Women are energetic and potentially human resourced and with skills they become more efficient in productivity and become driving force for social growth and economic development of country. This paper revealed that TVET sector is best opportunity to empower women which helps them to overcome the socioeconomic challenges, improving their standards of living and contribute towards sustainable socio-economic growth [15].

Operational Definitions

Table 1: Definitions.

Lupinepublishers-openaccess-journals-Textile-Fashiondesigning

Conceptual Model

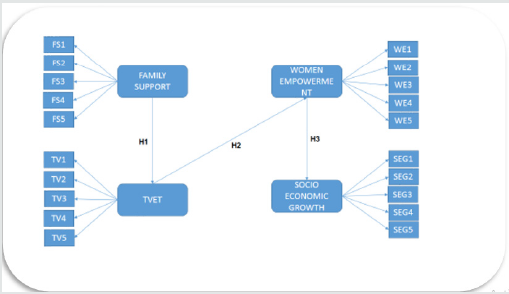
Figure 1 is presenting the conceptual Model adopted [16] and amended. It shows that family support has positive association with TEVT. TEVT has positive association with women empowerment and women empowerment has positive association with socioeconomic growth. Table 2 is presenting the hypotheses. There are three hypotheses which have been tested in the research study.

Figure 1: Conceptual Framework.

Lupinepublishers-openaccess-journals-Textile-Fashiondesigning

Table 2: Research Hypothesis.

Lupinepublishers-openaccess-journals-Textile-Fashiondesigning

Research Methodology

This paper performs a quantitative study. The population of this study is females’ students of a technical training institutes. Convenience sampling method is used for data collection and has been gathered from sample selected from the area specified for the research.

The research is comprised of Technical education in Garment sector and is conducted covering the area of Lahore, Punjab Pakistan. It takes almost two months to complete the study. Total number of respondents are 130. Data is collected from female students of technical institutes of Garment Sector through survey by using closed ended questionnaire based on 7-point likert scale included 20 items with a 7 points likert-scale of strongly disagree to strongly agree.

130 sets of questionnaires were distributed out of which 116 received and 15 were incomplete. Total response received was 102 and are analyzed using ADANCO [17]. The research includes four latent variables Women Empowerment (WE), Socio Economic Growth (SEG), Family Support (FS) and TVET Sector (TEV). To check the internal consistency of model, the Cronbach’s alpha is used, where Cronbach’s alpha ranged from 0.9274 to 0.7515 above the acceptable value of 0.7 which shows that instrument used in this research is highly reliable and suitable for analysis.

Read More About Lupine Publishers Journal of Textile and Fashion Designing Please Click on Below Link: https://fashion-technology-lupine-publishers.blogspot.com/

Monday 17 October 2022

Lupine Publishers| Thermodynamic, HOMO-LUMO, MEP and ADMET Studies of Metronidazole and its Modified Derivatives Based on DFT

 Lupine Publishers| Journal of Biomedical Engineering and Biosciences


Abstract

In this study, Metronidazole (Met) and it’s modified derivatives are optimized by employing density functional theory with B3LYP/6-31g (d,p) level theory to explore their structural and thermodynamical properties. Molecular electrostatic potential (MEP) calculation has performed to calculate their possible electrophilic and nucleophilic attack. ADMET prediction was performed to search the absorption, metabolism and toxic level. Finally, this study can be helpful to design a potent candidate.

Keywords: Metronidazole; Density functional theory; HOMO-LUMO; MEP; ADMET

Abbrevations:Met: Metronidazole; DFT: Density functional theory; HOMO: Highest occupied molecular orbital; LUMO: Lowest unoccupied molecular orbital; MEP: Molecular electrostatic potential; ADMET: Absorption, distribution, metabolism, excretion, and toxicity

Introduction

Metronidazole (Met) is an antibiotic [1] and antiprotozoal drug [2]. It is widely used in the treatment of amoebiasis, trichomoniasis and giardiasis [3,4]. It has some demerits depending on the type and nature of unusual physical condition and on the limit of dose. High and long term dose can cause of leucopenia, neutropenia and peripheral neuropathy diseases [5]. Adverse effect and resistance of drugs indicate the importance of the discovery of new potential candidate. In computer aided drug design system, physicochemical, molecular docking, nonbonding interactions, and ADMET predictions are important criteria to evaluate newly designed molecules [6]. Drug modification is another alternative way to search better agent, which can increase the selective action of drug and reduce the side effect. Recently, it has been seen the trait of modifying drugs using halogens and alkyl group play important role in improving drug performance [7].

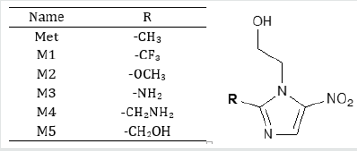
Herein, I report the optimization of Metronidazole (Met) and its modified derivatives to investigate their biochemical behavior on the basis of quantum mechanical approach. The free energy, electronic energy, enthalpy, dipole moment, HOMO-LUMO gap, hardness, softness, chemical potential and electrostatic potential have been calculated. All the newly designed derivatives show better thermodynamic properties, and some of them exhibit better chemical reactivity than parent drug. From the regarding quantum chemical studies, it’s assuming that, some of the designed compounds may have profound effect as drug.

Methods and Materials

Computational Details

In computer aided drug design, quantum mechanical methods are widely used to predict thermal, molecular orbital, and molecular electrostatic potential properties [8]. Initial geometry of Metronidazole (Met) was taken from the online structure database named ChemSpider [9]. Geometry optimization and further modification of all structures carried out using Gaussian 09 program [10]. Density functional theory (DFT) with Becke’s (B) [11] threeparameter hybrid model, Lee, Yang and Parr’s (LYP) correlation functional [12] under Pople’s 6-31g (d,p) basis set has been employed to optimize and elucidate their thermal and molecular orbital properties [13]. Initial optimization of all compounds was performed in the gas phase. Dipole moment, electronic energy, enthalpy, free energy and electrostatic potential are calculated for all the compounds (Figure 1).

Figure 1: Chemical structure of Metronidazole (Met) and its modified analogues.

lupinepublishers-openaccess-journal-environmental-soil-sciences

Frontier molecular orbital features HOMO (highest occupied molecular orbital), LUMO (lowest unoccupied molecular orbital) were calculated at the same level of theory. For each of the drugs, HOMO-LUMO energy gap, hardness (η), softness (S) and chemical potential were calculated from the energies of frontier HOMO and LUMO as reported considering Parr and Pearson interpretation [14,15] of DFT and Koopmans theorem [16] on the correlation of ionization potential and electron affinities with HOMO and LUMO energy (𝜀). The following equations are used to calculate hardness (η), softness (S) and chemical potential (μ);

In computer aided drug discovery system, computational predictions are using to explore absorption, distribution, metabolism, excretion, and toxicity (ADMET) which saves on time and investment. AdmetSAR online database was utilized to predict ADMET properties of Metronidazole and its analogues [17].

Result and Discussion

Thermodynamic Analysis

Simple modifications of molecular structure significantly influence the structural properties including thermal and molecular orbital parameters. From the free energy, and enthalpy values, spontaneity of a reaction and stability of a product can be predicted [18]. In drug design, hydrogen bond formation and nonbonded interactions also influenced by dipole moment. Increased dipole moment can improve the binding property [19]. From thermodynamic data (Table 1), the free energy of Metronidazole is -623.7600 Hartree, where M1 shows the highest negative value (-921.4882 Hartree). The –F substitution (M1) influence the free energy significantly. Highly negative free energy is favourable for stable configuration. Again, the dipole moment of Metronidazole is 4.1174 Debye where M3 shows the maximum dipole moment (5.3559 Debye) due to substitution of –NH2 group (Figure 2).

Table 1: The stoichiometry, molecular weight, electronic energy, enthalpy, free energy in Hartree and dipole moment (Debye) of Metronidazole (Met) and its analogues.

lupinepublishers-openaccess-journal-environmental-soil-sciences

Figure 2: Most stable optimized structures of Metronidazole (Met) and newly designed analogues. Optimized with B3LYP/6- 31g (d, p) level theory.

lupinepublishers-openaccess-journal-environmental-soil-sciences

Molecular Orbital Properties

Table 2: Energy (eV) of HOMO, LUMO, gap, hardness, softness and chemical potential of the designed drugs.

lupinepublishers-openaccess-journal-environmental-soil-sciences

The HOMO-LUMO energies, hardness, softness, chemical potential of all compounds is presented in Table 2. The electronic absorption relates to the transition from the ground state to the first excited state and mainly described by one electron excitation from HOMO to LUMO [20]. The chemical hardness, softness, and potential values depend on the energy gap of HOMO-LUMO [21,22]. Kinetic stability decreases with the decrease of HOMO-LUMO gap. As a result, removal of electrons from ground state HOMO to excited state LUMO requires less energy. In our studies, Metronidazole shows the HOMO-LUMO gap 4.6124 eV, where M3 have the lowest energy gap (4.1783 eV) with highest softness (0.4787 eV) which may contribute higher chemical reactivity (Figure 3).

Figure 3: Frontier molecular orbital (HOMO-LUMO) and related energy of Metronidazole (Met) and M3.

lupinepublishers-openaccess-journal-environmental-soil-sciences

Molecular Electrostatic Potential Analysis

Molecular electrostatic potential (MEP) was calculated at B3LYP/6-31G (d,p) level of theory to forecast the reactive sites for electrophilic and nucleophilic attack of all optimized structures [23]. Red color represents maximum negative area which favorable site for electrophilic attack, blue color indicates the maximum positive area which favorable site for nucleophilic attack and green color represent zero potential area. MEP displays molecular size, shape as well as positive, negative and neutral electrostatic potential regions simultaneously in terms of color grading. It is seen from MEP map, region having the negative potential are over electronegative atom (oxygen atoms) and having positive potential are over hydrogen atoms. Here, the maximum negative potentiality is found for M3 is -0.3497 a.u (deepest red) for oxygen atoms and the highest positive potentiality of M1 is +0.3903 a.u (deepest blue) of hydrogen atoms.

Read More About Lupine Publishers Journal of Biomedical Engineering and Biosciences Please Click on Below Link: https://biomedical-sciences-lupine-publishers.blogspot.com/

Friday 14 October 2022

Lupine Publishers | Evaluating the Potential of Narrow-Band Indices to Predict Soybean (Glycine Max L. Merr) Grain Yield in The Free State and Mpumalanga of South Africa

 Lupine Publishers | Journal of Environmental & Soil Sciences


Abstract

Yield predictions allow for decision making regarding management of agricultural yield before and after harvest by government and decision-makers. Traditional approaches to collect yield statistics such as manual field surveys and physical computation of yield are costly and take a long time for information to be available. Remote sensing platforms such as hyperspectral data provide real-time, fast, and reliable statistics that can be used to derive yield information. Vegetation indices are ratios used to combine multiple band observations of the hyperspectral data into one index and applied to derive soybean grain yield. The objective of this study was to evaluate the potential of vegetation indices derived from hyperspectral data to predict soybean grain yield. Soybean hyperspectral data was acquired using a handheld spectroradiometer with a spectral range of 350 to 2500 nm in March and April of the summer season of 2017. The random forest regression algorithm was used to predict the soybean grain yield. NDVI, SR and EVI were calculated from the hyperspectral data for all probable bands situated in the 400 nm and 2399 regions. The results showed that relevant wavelengths in predicting soybean were combinations situated in the red-edge (680-750 nm), NIR and the MIR (1300 to 2399 nm) of the electromagnetic spectrum. Furthermore, regression results showed that SR better predicted the soybean grain yield (R2 = 0.843) compared to NDVI (R2 = 0.841) and EVI (R2 = 0.537). In overall, the results of this study suggest that narrow-band indices have the potential to predict soybean grain yield.

Keywords: Soybean Yield; Hyperspectral Data; Vegetation Indices

Abbreviations: NDVI: Normalised Difference Vegetation Index; SR: Simple Ratio; EVI: Enhanced Vegetation Index; RF: Random Forest; RMSE: Root Mean Square Error; FS: Free State; MP: Mpumalanga

Introduction

South Africa is the third dominant consumer of soybean in the world [1]. Mpumalanga, KwaZulu Natal and Free State provinces are the largest soybean producers in the country [2]. Over the last decade, soybean production and consumption in South Africa has increased [1,3]. Currently, soybean production does not meet South African local demands [3]. As a result, South Africa imports large quantities of soybean products [3]. Attaining higher yields entails increasing the area planted and/or use of more fertilisers [4]. Production in both approaches requires constant crop monitoring using reliable techniques that can provide real-time statistics. Constant monitoring of crops can enhance chances of attaining higher yield through early detection of problems that can potentially affect yield. Soybean yield information in the hands of farmers and policy makers is important for decisions such as planning for harvesting, yield management and market related decisions [5]. Thus, there is a need for an efficient real-time monitoring system to provide the status, growth and development of soybean information consistently that can enable yield predictions.

Various methods have been used to predict grain crop yields and these include the use of agricultural censuses, field surveys [6] and physical computation of yields by visiting numerous sample areas [7]. In South Africa, current yield predictions are based upon field surveys conducted telephonically, via emails, and or by post FAO [8]. However prediction methods based on traditional crop yields surveys are frequently subjective, susceptible to large inaccuracies and take a long time for information to be available for the benefit of food security and early planning before and during harvests [5]. In addition, yield predictions obtained influence the pricing of agricultural commodities and the decisions to be taken regarding imports and exports [8]. This therefore validates the need for crop monitoring initiatives that involve the use of reliable techniques such as remote sensing to ensure fair pricing of agricultural commodities and objective decision-making. Remote sensing methods are suitable; they include the acquisition of crop canopy measurements [9], and can deliver immediate, reliable, measurable evaluations of the ability of plants to capture radiation and photosynthesize [10]. These canopy spectral measurements are beneficial for estimating crop yield [9]. Research shows that remote sensing spectral bands have strong relationships with vegetation biomass [11].

Many researchers have used broadband multispectral data to predict yield of various crops such as maize [12], rice [5], soybean [10] and wheat [13,14]. Broadband multispectral data have advantages as it is applicable to regional areas and also because of numerous revisits of the same area as well as capturing data at large spatial scales in real-time [15]. In addition, multispectral data is available at low or no cost, which can be beneficial to countries with limited resources [15]. Despite these advantages, broadband data has drawbacks for vegetation observation such as exhibiting excessive spectral differences and shadows due to the above-ground coverage and landscape [11]. The latter can be a hindrance in producing precise biomass prediction models with the ability to distinguish between soil background and vegetation [11]. Precise biomass predictions are essential for effective monitoring and management of vegetation [11]. Furthermore, broadband data does not have specific narrow-bands that precisely focus on biochemical and biophysical factors of crops [16,17]. This suggests that multispectral broadband data exhibit difficulties in monitoring

crops with high biomass such as soybean. Although multispectral broadband data have these disadvantages, research has shown that these disadvantages can be overcome by the use of vegetation indices [18]. Vegetation indices eliminate differences caused by soil background, above-ground geometry, sun view angles as well as the influence of atmospheric circumstances when assessing biophysical characteristics of vegetation at aboveground scale [18]. Widely used vegetation indices for vegetation monitoring and modelling are calculated using the red and the near infrared (NIR) bands [19]. The red and NIR bands respond to the biochemical and biophysical properties of crops [16,19]. These spectral bands are sensitive to the rate of photosynthetic activity in green vegetation [20]. The Normalised Difference Vegetation Index (NDVI) [21] and Simple Ratio (SR) [22] are commonly utilised indices that are calculated using the NIR and the red bands [20] with applications for crop monitoring. Soybean has been monitored using NDVI modelled from broadband data sets such as AVHRR/NOAA [23,24] and ADAR 5500 4 band digital camera with a broadband width of 450 nm to 90 nm [25]. [26] used SR, NDVI, Soil Adjusted Vegetation Index (SAVI) and Transformed SAVI (TSAVI) to evaluate soybean biophysical properties such as yield, photosynthetically active radiation (PAR), leaf area index (LAI) and biomass [26]. Also, the SR index is known to be able to decrease the effect of soil background on the spectral reflectance and is also sensitive to changes occurring at prime developmental phases of vegetation [27]. The Enhanced Vegetation Index (EVI) is another widely used vegetation index in agricultural forecasting computed using the red and NIR bands with an addition of the blue band [28]. However, the EVI is insensitive to saturation when faced with high biomass vegetation [29]. Despite the usefulness of these spectral bands, broadband data is unresponsive to the variation in plant features [15].

Due to disadvantages encountered by broadband data, researchers promote the use of hyperspectral data that covers the whole range of the electromagnetic spectrum instead of just two or three bands [18]. Hyperspectral data provide advantages of handiness, flexibility, controllability and high temporal resolution, which are greatly beneficial in precision agriculture applications as opposed to satellite based platforms [30]. Also, hyperspectral data contains other important spectral bands such as the red edge bands that are useful in the study of vegetation [18]. The red edge band is highly responsive to variations in biomass of green vegetation [18]. Narrow bands are important for supplying more information with substantial enhancements compared to broad bands in enumerating biophysical properties of agricultural crops [17,31]. Also, hyperspectral data is important for modelling yield features of agricultural crops [17] such as chlorophyll content, photosynthetic activities and leaf structure [32]. Numerous researchers have used hyperspectral data for vegetation monitoring such as [17,18,31] with positive results. Mutanga and Skidmore [18] calculated NDVI from hyperspectral data and obtained that regular NDVI including strong chlorophyll absorption bands in the red region and NIR region inadequately predicted biomass (R2 =0.26). Whereas, the modified NDVI (MNDVI) that included bands in the range (700- 750 nm) and narrow-bands in the red-edge region (750-780 nm) showed a high predictive ability for biomass (R2 =0.77). Mariotto et al. [18] identified that important bands when modelling biophysical

properties of maize, wheat, cotton, rice and alfafa, (about 74% of them) are situated in the 1051-2331 nm regions. The remaining 30% of these bands are in the 970 nm region (10%), red-edge region (6%) and the visible region (10%) (Blue region (400-500nm), green region (501-600 nm) and NIR region (760-900 nm). Thenkabail et al. [31] concluded that stronger correlations with crop biophysical characteristics were situated in the red region (650-700 nm), shorter wavelengths of the green region (500-550 nm), the NIR region (900-940nm) and in the moisture sensitive area centred at 982 nm. Similarly, many researchers have used hyperspectral data to predict yield of agricultural crops such as lint [33], wheat [34], maize [35] and soybean [21]. However, for soybean [21] utilised spectral data acquired using a multispectral hand-held radiometer with a fewer number of bands. They obtained positive correlation between NDVI and soybean grain yield (R2 = 0.80). Research has shown that hyperspectral data has enabled estimation of yield of various crops and biomass of several vegetation types. However, soybean grain yield has not been predicted comprehensively using hyperspectral data in the spectral range of 400-2399 nm.

Hyperspectral data has however some limitations, such as those related to high dimensionality and redundancy [36] and the problem of multicollinearity [37]. As a result, identifying suitable bands for modelling is a challenging process. To overcome this problem researchers encourage the use of advanced statistical methods such as random forest (RF) regression algorithm [11]. Random forest is a regression algorithm that applies bootstrapping aggregation to create a group of trees based on the randomness of samples taken from the training data [38]. The random forest algorithm is known to be able to handle the high dimensionality of hyperspectral data and reduce data redundancy [37]. Also, random forest has been noted to perform better than other machine learning algorithms such as support vector machine and neural network because of its robustness against overfitting [11, 38-41]. The aim of this study was to evaluate the performance of narrow-band vegetation indices NDVI, SR and EVI derived from hyperspectral data in predicting soybean grain yield. The vegetation indices selected for the study are those frequently used for biomass or agricultural crop and ecological vegetation studies [18] and have been applied successfully in predicting other crops. The main objective of this study is to assess the relationships of narrow-band NDVI, SR and EVI to soybean grain yield. The second objective was to identify suitable narrow-band indices to predict soybean grain yield. The third objective was to compare the performance of NDVI, SR and EVI random forest models developed from narrow bands (400 nm to 2399 nm) in predicting soybean grain yield.

Materials and Methods

Study Sites

The research was conducted on two experimental farms located in the Free State Province of South Africa in Phuthaditjhaba (28°25’26”S and 28°56’12”E) and in the Mpumalanga province in Ermelo (26° 45’18” S and 30° 13’55” E) (Figure 1). The Free State and Mpumalanga provinces experience warm summers with high rainfall and cold winters. Both these areas receive approximately 625 mm of precipitation annually with most precipitation occurring in summer (October - March). The soil in Phuthaditjhaba can be characterised as “rich loam” type of soil [42] while the soil in Ermelo can be characterised as “low clay” [43] and sandy soil.

Figure 1: Map showing the location of the study sites in Free State (FS) and Mpumalanga (MP) provinces.

lupinepublishers-openaccess-journal-environmental-soil-sciences

Experimental Setup

The experiment on both sites followed a split plot Randomized Complete Block Design (RCBD) method. In the two study sites, 72 experimental plots each with a size of 7 m length and 3 m width were used. The plots consisted of 7 rows with 60 cm row spacing. Three soybean cultivars from Pannar seeds (PANN 1500 R, PANN 1614 R and PANN 1664 R) were sown from the 13th to 15th December 2016 in the MP and from 19th to 21st of December 2016 in FS site. Fertilizer treatments of 0 kg, 30 kg and 60 kg of phosphorus (P) were applied to the plots to provide more nutrients and enhance the health of the soybean plants. The experiment consisted of three replicates and the soybean relied on rainwater for irrigation.

Field Spectral Measurements

The first set of field spectral measurements in Mpumalanga and Free State were taken in March 2017 and the second set of spectral measurements were taken in April 2017. During this period, the soybean had reached maximum canopy cover whereby the soil background could have little effect on the spectral measurements. Due to differences in planting date, the soybean in Mpumalanga was in the pod formation stage during the first visit while in the Free State site it was still flowering. Canopy spectral measurements were acquired during flowering, pod formation and seed filling stages randomly plot by plot across fertilizer treatments of 0 kg, 30 kg and 60 kg. An Analytical Spectral Device (ASD) Field Spec®3 optical sensor (Analytical Spectral Devices, Inc., Boulder, CO, USA) was used to take spectral measurements from 10:00 am to 14:00 pm local time (GMT+2). The spectroradiometer records wavelength ranging from 350 to 2500 nm, measuring radiation at 1.4 nm bandwidths for the spectral region of 350-1000 nm and registers 2 nm intervals for the spectral region of 1001-2500 nm [44]. The spectral measurements

were taken under cloud free conditions. In each plot, 5 spectral measurements were taken with the optical cable connected to the spectroradiometer held at about 30 cm above the soybean canopy. Every 10 to 15 minutes a white reference spectralon calibration panel was used to balance any changes in the atmosphere and irradiance of the sun. The spectral measurements were added together to obtain the medial spectral measurements for each plot. Figure 2 shows average spectral reflectance of soybean at flowering, pod formation and seed filling stages. The spectral reflectance curve indicates the amount of radiation absorbed and reflected by the soybean at different regions of the spectrum. For soybean, the flowering and pod formation stages are critical stages in which the soybean utilises the absorbed radiation to photosynthesise and form grains [45]. A higher spectral signature is an indicator of a healthy crop in which higher yield can be expected whereas a low spectral signature indicates a lower yield [45].

Figure 2: Average spectral curves of soybean canopies at flowering, pod formation and seed filling stages.
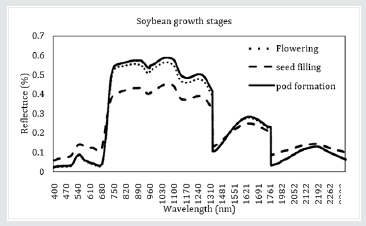
lupinepublishers-openaccess-journal-environmental-soil-sciences

Soybean Yield Data

To obtain soybean grain yield data, the soybean pods were harvested from the middle 3 rows of each plot at the end of the growing season of May and June 2017. The soybean pods were then crushed to obtain the soybean grains. The soybean grains obtained from each plot were weighed using the LBK1 weighing scale from ADAM Equipment [46]. The grains measurements of specific plots for each site were added to obtain the total yield of the soybean of each site.

Data analysiss

448 Bands allocated from 350 to 399 nm, 1350 to 1450 nm, 1800 to 1950 nm and 2400 to 2500 nm were omitted from the analysis due to atmospheric water absorption and the effect of noise in the reflectance spectra following techniques outlined in [11,36]. The remaining 1702 narrow-bands situated between 400 nm and 2399 nm were used to compute the narrow-band indices.The NDVI, SR and EVI indices were calculated using the standard indices equations [22, 28,47] (Table 1). These indices were calculated from all probable two-bands combinations including 1702 narrow bands situated between 400 and 2399 nm [11,18,19]. The narrow bands are presented as λ₁ (400-2399 nm) and λ₂ (400-2399 nm) combinations following approaches outlined in [18]. The calculated vegetation indices were correlated to the soybean yield using the Spearman’s correlation coefficient [2]. The correlations between vegetation indices and soybean grain yield were calculated to assess their relationship.

Table 1: Vegetation indices computed from the λ1 (400-2399 nm) and λ2 (400-2399 nm) combinations.
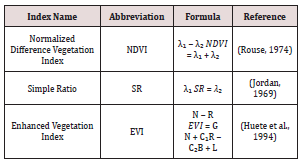
lupinepublishers-openaccess-journal-environmental-soil-sciences

Assessing the Differences in Yields between Study Sites and Fertilizer Treatments

Exploratory data analysis was performed to understand the data before any statistical analysis was done. The statistical analysis was performed in STATISTICA 13 software testing for normalcy of the data using Lilliefors test [48]. Furthermore, an analysis of variance was performed to determine if there were differences in soybean grain yield means between the two study sites and between the three fertilizer treatments.

Statistical Analysis Using the Random forest (RF) Regression

The random forest regression technique was used to predict the soybean grain yield. RF is a machine learning algorithm developed by Breiman [49] that applies a bootstrap aggregation method in which an ensemble of trees (ntree) are developed on the basis of the randomness of samples extracted from the training data. For regression, the random forest permits trees to grow to the highest magnitude without trimming, depending on the bootstrap sample from the training data [49]. At every tree, the RF grows a randomized subgroup of predictors (mtry) to identify the optimum split at every node of the tree [41]. At the end, the RF averages the outcome of the overall sum of trees in order to obtain the overall estimation [50]. From the bootstrap samples of the training data (2/3), each tree grows randomly and selected independently. The residual original data (1/3) of the excluded samples (called outof-bag (OOB)) are then used to validate the model and predict variables of importance [51,52].

RF requires two parameters to be tuned that are (i) (ntree) the number of trees to grow and (ii) (mtry) the number of variables that are split at each node [41]. The ntree and the mtry parameters (vegetation indices) were then optimized for the random forest model using the top 20 NDVI, SR and EVI data sets to determine the best index that can be used to predict soybean grain yield. The mtry was calculated for all probable band combinations while the ntree was evaluated at 500, 1000, 1500, 2000, 2500, 3000, 3500, 4000, 4500, and 5000 trees. The random forest model was developed from 70% (2/3) of the training data to build a model that can predict soybean grain yield (g/m2 ) and 30% (1/3) of the test data was used to validate the model (OOB). Important indices at predicting soybean grain yield were selected by the RF using the permutation variable importance measures (mean decrease in accuracy). The RF algorithm was implemented using the R statistical software using the random Forest built in package to predict the soybean grain yield (Liaw and Wiener, 2002).

Variable Importance Selection

Random forest calculates variable importance using the Gini index and the permutation variable importance measures [53]. The permutation variable importance measure is defined as the variation between the OOB error from the data set acquired by random selection of the predictor variables and the OOB error from the original data set [53]. While the Gini index variable importance is a measure used in a classification when growing trees in the random forest [54]. The permutation variable importance measure is the most preferred measure of importance as it assesses importance of variables using the mean decrease in accuracy in the OOB predictions as forests are being assembled [53]. Permutation variable importance predicts the importance of a variable by determining how much prediction error rises when a variable is selected while others remain the same [55,56]. For this study, the permutation variable importance was used to determine the combination of indices that were powerful than the others in predicting soybean grain yield. From the ranking of the mean decrease in accuracy, the top 3 important combinations of indices were selected.

Accuracy Assessment

When using the random forest, research has shown that there is no need for a different test data for validation because the random forest uses an OOB error prediction built internally [37,38,50,57,58]. This is particularly remarkable in situations where data acquisition is highly dependent on oscillating weather conditions. The random forest computes the OOB error as a result of variance between the estimation made using the training data set and the OOB data set [41,59]. OOB error produces an unbiased evaluation of the prediction accuracy of the model [40]. The coefficient of determination (R2 ) and root mean square error (RMSE) were reported on the assessment of the accuracy of the random forest models. RMSE was calculated using the formula below:

lupinepublishers-openaccess-journal-environmental-soil-sciences

where Ŷ and Y are measured and predicted soybean grain yield respectively.

Results

Assessing the Differences in Soybean Yields between Study Sites and Fertilizer Treatments

Exploratory statistics showed that soybean grain yield data does not significantly deviate away from a normal distribution for both sites (Figure 3) and thus meets the assumptions of ANOVA. Analysis of variance results showed that there were significant differences between the soybean grain yield in Free State and

Figure 3: Descriptive statistics of soybean grain yields for FS (a) and MP (b) sites.
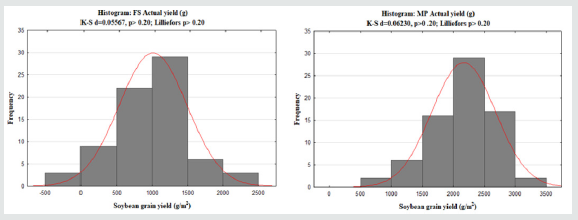
lupinepublishers-openaccess-journal-environmental-soil-sciences

Mpumalanga provinces (p≤0.05). However, the results showed no significant differences in soybean grain yield between fertilizer treatments on the study sites (p≥0.05). The total soybean grain yield obtained in FS was 72816 g/m2 with an average of 1011.3 g/m2 per field while the total soybean grain yield in MP was 156060 g/m2 with an average of 2167.5 g/m2 per field. In total, the soybean grain yield of both sites was 228876 g/m2 with an average of 1589.4 g/m2.

Narrow-Band NDVI and SR Relationship to Soybean Grain Yield

Table 2: Top 20 narrow band NDVI indices (λ=30 nm) that produced the highest correlation coefficients with soybean grain yield.
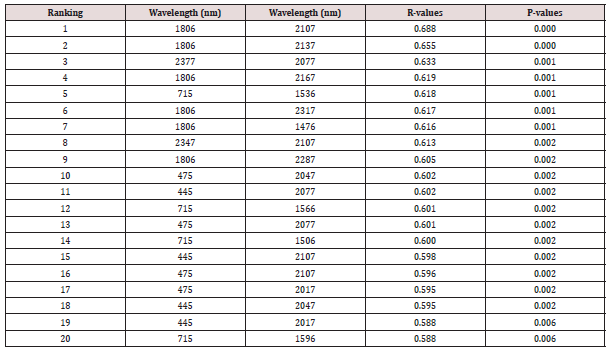
lupinepublishers-openaccess-journal-environmental-soil-sciences

Narrow-band NDVI and SR were computed for all probable two-band combinations in the spectral range 400 nm to 2399 nm. Spearman’s correlation coefficients were applied to assess the relationships of the narrow-band NDVI and SR to soybean yields. The NDVI and SR obtained identical results of the correlations to the soybean grain yield (Tables 2 & 3). The correlation coefficients (R) results obtained between NDVI/SR and soybean grain yield ranged from 0.00 to 0.68 shown in Tables 2 & 3.

Table 3: Top 20 narrow band SR indices (λ=30 nm) that produced the highest correlation coefficients with soybean grain yield.
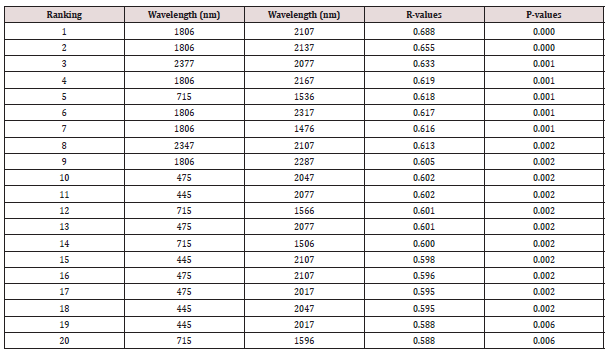
lupinepublishers-openaccess-journal-environmental-soil-sciences

Figures 4 & 5 depict a graphical presentation of the R-values for the relationship between soybean grain yield and NDVI and SR. These results show a moderate to strong relationship between NDVI/SR and the soybean grain yield (R-values from 0.588 to 0.688). In addition, the p-vales obtained for these results indicate that the relationships between soybean grain yield and the derived vegetation indices are significant as they are less that 0.05. Correlation coefficients of NDVI and SR were arranged in the order of the highest to the lowest and the top 20 R-values. The top 20 best NDVI/SR indices are situated in the blue (445 nm - 475 nm), rededge (715 nm) and in the MIR regions (1506 nm – 2377 nm) of the electromagnetic spectrum (Figures 4 & 5).

Figure 4: Heat map showing the correlation coefficients (R) between soybean grain yield and narrow band NDV acquired from all probable band combinations from the spectral range of 400 nm to 2399 nm.
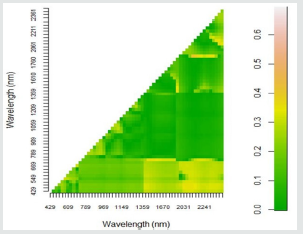
lupinepublishers-openaccess-journal-environmental-soil-sciences

Figure 5: Heat map showing the correlation coefficients (R) between soybean grain yield and narrow band SR acquired from all probable band combinations from the spectral range of 400 nm to 2399 nm.
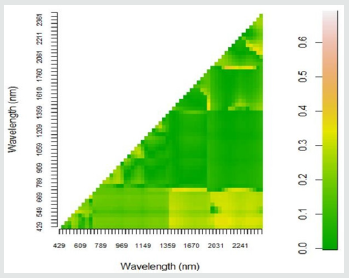
lupinepublishers-openaccess-journal-environmental-soil-sciences

Narrow-Band EVI Relationship to Soybean Grain Yield

Narrow-band EVI was computed from all probable band combinations in the spectral range of 400 to 2399 nm of the electromagnetic spectrum. Spearman’s correlation coefficients were calculated to assess the relationship between the EVI indices and the soybean grain yields. The correlation coefficient results of EVI indices ranged from 0.00 and 0.761. The relationship between soybean grain yield and the derived narrow- band EVI are significant as shown by the p-values less than 0.05 in Table 4. Correlation coefficients of the narrow-band EVI were ranked from the highest to the lowest and the top 20 best indices were selected and shown in Table 4. The best 20 EVIs are situated in the blue region (405 nm – 425 nm), red region (695 nm), red-edge ((705 nm- 735 nm) NIR (1245 nm) and the MIR (2357 nm– 2397 nm) regions of the electromagnetic spectrum.

Table 4: Top 20 narrow-band EVI indices (λ= 10 nm) that produced the highest correlation coefficients with soybean grain yield.
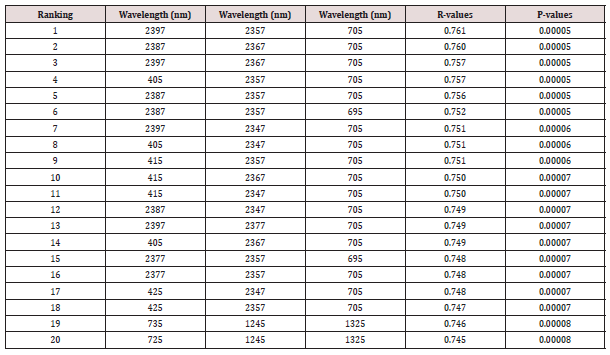
lupinepublishers-openaccess-journal-environmental-soil-sciences

Optimization of the Random Forest Regression Models

For the three indices (NDVI, SR and EVI), the ntree and mtry values were optimized using the training dataset to identify values that best predicted soybean grain yield. For each index, ntree values from 500 to 5000 were tested and mtry was tested from 1 to 20 (Figure 6). The mtry and ntree values that produced the best RMSE were selected. According to the results (Figure 2), the best mtry for the NDVI and SR models were 10 and 5 and their ntree was 500 respectively. For EVI, the best mtry was 7 and the ntree was 1000.

Figure 6: Optimization of random forest parameters (ntree (N) and mtry) using RMSE.
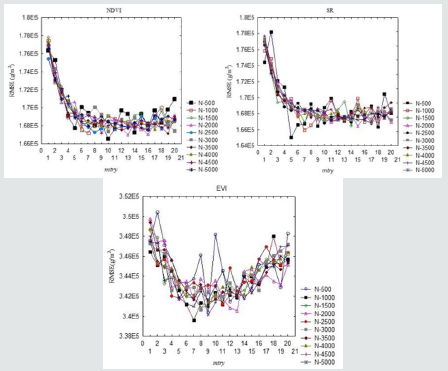
lupinepublishers-openaccess-journal-environmental-soil-sciences

Variable Importance of Narrow-Band Indices in Predicting Soybean Grain Yield Using the RF

From the best 20 selected indices that were highly correlated with the soybean grain yield, it was essential to categorize narrowband indices of NDVI, SR and EVI that would highly perform when predicting soybean grain yield (g/m2 ). The RF calculated variable importance using the mean decrease in accuracy to measure the importance of NDVI, SR and EVI at predicting soybean grain yield (g/m2 ). The RF algorithm was capable of ranking the NDVI (Figure 7a), SR (Figure 7b) and EVI (Figure 7c) indices according to their importance in predicting soybean grain yield.

Using the mean decrease in accuracy arrangement, top 3 wavelength combinations that had significant importance in predicting the soybean grain yield were selected. For NDVI, top 3 band combinations included:

(i) 2197 nm and 1806 nm,

(ii) 2137 nm and 1806 nm and

(iii) 1506 nm and 715 nm. similarly,

SR top 3 important wavelength combinations include

(i) 1806 nm and 2107 nm,

(ii) 1806 nm and 2137 nm and

(iii) 1806 nm and 2167 nm. In addition,

EVI top three significant wavelengths included

(i) 1245 nm, 735 nm and 1325 nm,

(ii) 2377 nm, 2397 nm and 705 nm and

(iii) 1245 nm, 725 nm and 1325 nm.

Figure 7: Mean Decrease in Accuracy (%) of NDVI (a), SR (b) and EVI (c) concluded by the random forest algorithm. Important variables ranked are those with the highest mean decrease accuracy.
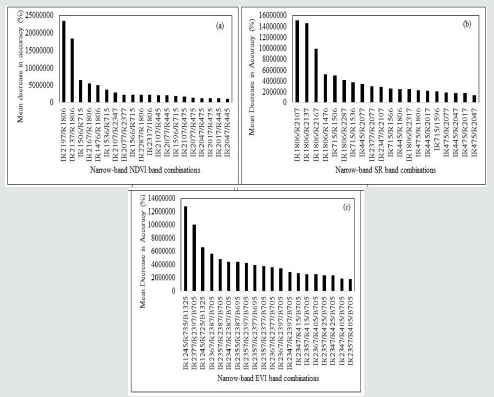
lupinepublishers-openaccess-journal-environmental-soil-sciences

Accuracy Assessment

Figure 8: Random Forest models (NDVI (a), SR (b) and EVI (c)) showing sensitivity of ntree to the OOB error.
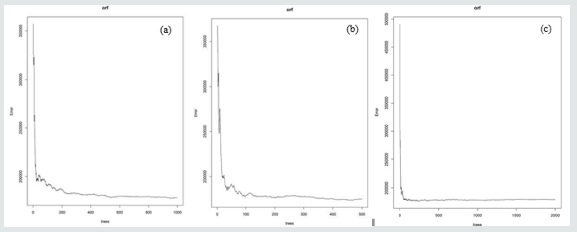
lupinepublishers-openaccess-journal-environmental-soil-sciences

Figure 8 shows the best ntree results of the RF models for NDVI (a), SR (b) and EVI (c). This indicates that for NDVI and SR, the models obtained accuracy at 500 trees and at 1000 trees for EVI. The coefficient of determination (R2 ) and Root Mean Square Error (RMSE) were statistical measures that were used to evaluate the predictive performance and accuracy of the random forest regression models (NDVI, SR and EVI). Table 5, shows the performance results of the random forest prediction models. The results show that SR obtained the highest R2 of 0.843 with a RMSE of SR= 423.94 and RMSE of NDVI=422.84 (26.11% of the average soybean grain yield) compared to NDVI that obtained R2 =0.841 with an RMSE of 423.94 (26.04% of the average soybean grain yield) and EVI (R2 = 0.578) (37.04% of the average soybean grain yield) and RMSE of 615.94. These results suggest that SR can better predict soybean, however NDVI obtained better accuracy in the prediction in comparison to SR and EVI.

Table 5: Predictive performance of the NDVI, SR and EVI random forest prediction models using top 20 best indices.

lupinepublishers-openaccess-journal-environmental-soil-sciences

Discussion

The aim of the study was to evaluate the potential of narrowband indices (NDVI, SR and EVI) in predicting soybean grain yield (g/m2 ). Broadly, the results of this study demonstrated that narrowband situated in the blue, red, red edge and MIR regions have a potential to predict soybean grain yield. The objectives were to assess the relationships of the narrow-band indices to the soybean grain yield, identify suitable narrow- band indices to predict soybean and to compare the accuracy of the prediction models. The study further showed that important bands in predicting soybean grain yield are not only bands in the NIR and red regions but also bands situated in the MIR region.

Assessment of the Relationships of Narrow-Band Indices to Soybean Grain Yield

The R-values obtained for NDVI (0.00-0.688), SR (0.00-0.688) and EVI (0.00-0.761) showed that different combinations of bands respond differently to variations in soybean grain yield. As shown in Tables 2-4, strong correlations to the soybean grain yield did not only consist of combinations of bands in the red and NIR regions. Strongly correlated indices of NDVI, SR and EVI to soybean consisted of combinations of bands in the blue region (405 nm - 475 nm), red region (695 nm), red edge (705-735 nm), NIR (1245 nm) and the MIR regions (1325 nm -2397 nm). These results correspond with those reported by Mutanga and Skidmore [18], which suggested that information on vegetation biomass is not only limited in the red and NIR bands. As a result, NDVI, SR and EVI highest correlations mainly consisted of combinations of bands in the MIR (1300-2399 nm) and combinations of the blue (400- 500 nm) bands and red-edge (700-729 nm) bands. The MIR region is known to be sensitive to water content of leaves and has low reflectance [32]. However, for this study, most MIR bands showed strong sensitivity to biochemical factors found in soybean such as nitrogen, protein as well as oil [32]. Similarly, wavelengths in the blue region are highly sensitive to chlorophyll a and b since plants absorb the violet-blue light for photosynthesis [32]. Based on these results it is understandable that combinations of these bands would obtain the highest correlation to the soybean grain yield. These results also concur with those reported by Darvishzadeh et al. [60,17]. Darvishzadeh et al. [60], showed that bands in the MIR had the strongest relationship to leaf area index (LAI) compared to the red and NIR bands. Mariotto et al. [17], reported that about 74% of bands sensitive to biophysical properties were situated in the MIR (1051 to 2331 nm). Additionally, the red-edge band is characterised by high reflectance and is linked to differences in the chlorophyll content that is associated with biomass of vegetation [18,32]. It is reasonable that combinations of wavelengths including the red- edge would obtain a strong relationship to soybean grain yield. Generally, these results provided more understanding of the relationship of the soybean grain yield and its significant wavelength regions. Furthermore, the results showed that important information on soybean yield is mostly contained in the MIR (1300 to 2399 nm) and indicate that narrow-bands have the potential to predict soybean grain yield.

Variable Importance and Assessment of the Predictive Performance of the NDVI, SR and EVI Random Forest Models

In the top 20 selected indices that had a strong relationship to soybean grain yield, it was necessary to identify which of those were significant in the prediction of soybean grain yield. The random forest used the mean decrease in accuracy measures to identify combinations of bands that are most significant in the prediction of soybean grain yield. The results of the optimization of the random forest showed that 10, 5, and 7 indices (NDVI, SR and EVI) out of 20 indices (predictors) at 500 and 1000 ntrees were significant at predicting soybean grain yield. These results further demonstrated that accuracy of the prediction was obtained with a smaller number of trees (ntree=500) compared to a larger number of trees (ntree = 1000). These results were validated by the differences in RMSE of 423.94 at 500 ntree compared to the RMSE = 615.69 at 1000 ntree. The obtained results concur with those of Abdel-Rahman et al. [41] who suggested that fewer number of trees (ntree) results in lower RMSE, which indicates better accuracy. The R2 results of the NDVI, SR and EVI random forest models showed that SR obtained the highest R2 in predicting soybean grain yield. These results indicate that, compared to the NDVI and EVI, SR is a better index at predicting soybean grain yield. These findings are similar to those obtained by Mutanga and Skidmore [18] who in their study concluded that SR (R2 =0.80) was a better index at predicting biomass in dense canopies than NDVI and Transformed Vegetation Index (TVI). Higher performance of SR could be because of its high sensitivity to high biomass as compared to NDVI which saturates when faced with high biomass [61,62]. Although the SR obtained the highest R2 , the NDVI obtained the lowest RMSE of 422.84 compared to SR (RMSE=423.94) and EVI (RMSE=615.69). These findings indicate that NDVI has better accuracy at predicting soybean yield since a lower RMSE indicates better accuracy. In conclusion, these results suggest that both the SR and NDVI can accurately predict soybean grain yield.

Conclusion

This study shows the success of narrow-band indices in predicting soybean grain yield. The results have shown that important narrow-bands in predicting soybean grain yield are not only combinations of bands situated in the red (695 nm) and the NIR (1245 nm) regions but are also combinations of bands found in the blue region (405 nm - 475 nm), red edge (705 nm -735 nm) and the MIR regions (1325 nm -2397) nm. Furthermore, the SR index (R2 = 0.843) proved to be a better index in predicting soybean grain yield compared to the NDVI (R2 = 0.841) and EVI (R2 = 0.578).

Acknowledgement

We acknowledge the Agricultural Research Council (ARC), the National Research Foundation (NRF) and the University of the Free State for the financial support for this study. We thank the Soil Science division in ARC that allowed us to collect soybean reflectance data from their experimental farms. Thank you to Dr Solomon Newete and Eric Economon for their assistance in acquiring spectral reflectance data.

Read More About Lupine Publishers Journal of Environmental & Soil Sciences Please Click on Below Link:
https://lupine-environmental-soil-sciences.blogspot.com/