Saturday 30 January 2021

Lupine Publishers | An Actual Statistical Problem with Model Selection My Solution

 Lupine Publishers | Journal of Otolaryngology


Introduction

This manuscript is a follow-up of my last one in SJO where I promised to show you my solution of a client problem. This case has been transformed such, that the logic of the problem remained unchanged and the confidentiality of my client’s data is warranted, however. In the last manuscript the results of the commonly found methods of modelling were shown and discussed. Now we will show my results and a discussion of them. Mathematically speaking the mainstream models already shown could be summarized as two univariate approximations by straight lines or a two-dimensional fit of a plane, describing the dependent variable by an approximation based simultaneously by a constant and two linear terms. I was fully aware of the limitations of the very small sample size of the mainstream models and I hope to successfully use this example to convince my readers about the economic benefits of discussions with professional mathematicians/statisticians instead of users of statistical software as I have classified them.

Methods

As I was blinded to the actual meaning of the variables X1, X2 and Y my experience indicated that I should try a second order polynomial fit as this would be the simplest possible model extension as compared to the mainstream linear models. The similarity to the considerations of Occam’s razor (see Wikipedia) are also well based on my personal professional experience. My model equation used is displayed below:

Y (X1; X2) =a0 + a1. X1 + a2. X2 + a3. X12 + a4. X1. X2 + a5 .X22 + error term (equ 1)

The above equation contains prior regression analysis the coefficients a0, a1 and a2 for the linear terms and a3, a4 and a5 for second order polynomial terms which must be estimated from the data by means of linear regression based on the method of least squares. The error term must fulfil the assumption that the data points represent statistically independent observations with constant variance in the domain of data points and an approximate Gaussian distribution. The most important data requirement is a continuous and metric measurement scale of the data and based on my long- term experience in medicine and other statistical applications, if fulfilled, the basis for a highly robust behavior of the regression analyses based on least squares. Finally, enough data points must be available. This is a problem in the determination of the sample size, which, in my opinion, requires professional statistical assessment.

Result

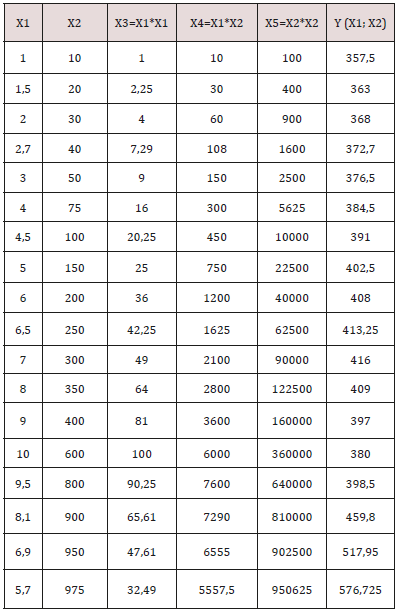
The numerical details are shown in Table 1 below with additional information necessary in the Excel data analysis software as the input for Excel’s regression routine:

a) Note 1: X1 and X2 and Y refer to the client provided original data. The author intended to look at a standard polynomial of degree 2 and the calculated data columns indicate all second order terms necessary from Excel logic for that purpose. The contents after the provided Y in the brackets are a help to understand that Y (as provided from my client) is the dependent variable of X1 and X2 in this very model. For physicians unfamiliar with exponential floating-point formatted numbers reading of the Excel online documentation is recommended.

b) Note 2: There are three lines in Table 2. The descriptions in column one show regression in the first, residual in the second and total in the third line. The total in line 3 displays the SS of all data against the grand mean. The residual in line 2 shows the sum of squares of the differences between data and calculated Y values using the coefficients a0, a1, …, a5 and the line 1 described as regression provides us with the information of the explained variation by the calculated regression coefficients. In view of the raw Y data shown in Table 1 we observed therefore a residual variance - in the magnitude of 9,0403. 10-28 which – for practical purposes – might be judged as zero. The mathematical interpretation in everyday language is there is an interpolation problem or a perfect fit between the raw Y data and the regression equation with the calculated coefficients shown in

Table 1:

lupinepublishers-openaccess-otolaryngology-journal

Table 2: ANOVA analysis of variance table

lupinepublishers-openaccess-otolaryngology-journal

df: degrees of freedom

SS: sum of squares

MS: mean squares (represent the variances which are the squared

standard deviations).

c) Note 3: The coefficients ai refer to the equation (1). Please note that i = 0, 1, 2, …, 5 in column one and a0 is frequently assigned the name intercept. We follow the frequently engaged standard statistical practice of setting not statistically significant coefficients to zero and have the solution of our model (from equation (1)) in equation (2) below:

Y (X1; X2) = 350 + 3. X1 + 0,5. X2 - 0,05. X1. X2 (equ 2)

The inevitable rounding errors which are present in all common computers are reflected in the Excel documentation which states that about ten to twelve digits in decimal results should be reliably exact. Therefore, it seems not to be a problem that 95% confidence intervals cover zero and actual numbers of digits of the raw data in Table 3 justify this decision. We analyzed in addition the model of equation 2 and for practical purposes we concluded that there were perfectly consistent results (data on file but not shown here). You might consider this fact as a simple way to be on the safe side with our conclusions about this data set. Our verbal comment to equation (2) is that the available data set very strongly indicates that a perfect functional relationship between X1, X2 and Y exists. In view of the relatively small sample size of the evaluated data here, it is strongly recommended to collect substantially larger data sets in the next future and only if results could be reproduced within the sampling error limits then an application for the Nobel Price could be envisaged in case our data originated from medical data.

Table 3:

lupinepublishers-openaccess-otolaryngology-journal

Conclusion/Discussion

The reader should consider several aspects of our example: First, finding practical interpolation from data sets could have apart from chances for a successful Nobel price application and small sample sizes other causes, e. g. that the Y-data is already a derived data item calculated from X1 and X2 actually. The originator of the data set could be consulted, and this issue might sometimes be clarified quickly. Second, a review of the selection criteria might shed additional aspects and one of the most likely finding might be that the data were collected from young, healthy volunteering soldiers instead of a larger sample with males and females in about 1:1 relation. Many other explanations for such a result might be presented here, but I think that an experienced statistician would likely be a valuable contributor to such – admittedly very rare – events. I think under all circumstances the plan for a follow-up study could be quite a challenge for the responsible physician as well. I’d like to emphasize that from a mathematical viewpoint a real and strong and simple functional relationship (interpolation) is likely to be considered as a very strong scientific revelation, finally. Another important consideration was in the results’ section mentioned and I’d like to address it here: In case of a polynomial of degree k with a sample n=k+1 there will be always an interpolation solution, which is just due to lack of sample size and as such not informative at all. My personal experience indicates very strongly that in cases where n-k coefficients are estimated and two k is at least contained in n-k several times then degenerate interpolation could safely be excluded, however.

In my early professional work life I was once confronted to a study to assess the effect of a substance on the blood pressure and heart rate which did not contain blood pressure as a selection criterion. It seemed to everybody as highly representative for the selected patients. Based on some 150 patients the baseline data showed certain, quite considerably big percentages of hypotonic, normotonic and hypertonic patients. The evaluation of baseline to end of treatment differences showed only a very weak linear trend for the changes of systolic, diastolic blood pressure and heart rate. A second order polynomial showed a clear, statistically highly significant quadratic trend: The hypotonic patients showed increased blood pressure data, normotonic had just data varying around zero and hypertonic patients showed statistically highly significant blood pressure reductions. Sponsor’s headquarter asked me to provide the average blood pressures from the full sample and as I assume - the international medical director - decided not to pursue this substance as the pooled average across hypotensive, normotensive and hypertensive patients was medically relatively small compared to the established hypertensive drugs of this pharmaceutical giant. It is no surprise at all, that a subgroup evaluation of the three blood pressure subgroups clearly indicated that young and middle-aged patients revealed quite small shares of hypertensive patients and patients aged over 60 years had considerable shares of hypertensive patients consistent with published literature of epidemiology. Today, I still judge this as a mistake based on the omnipresent linear thinking of the very company’s headquarter. Finally, I think the examples discussed here are at least some evidence that non-linearity can be present in medical data and the consequences could cause major detrimental damages to financial operations of corporations and by withholding potentially interesting drugs from patients’ unnecessary burden of disease(s).

Read More Lupine Publishers Otolaryngology Journal Articles:
https://lupine-publishers-otolaryngology.blogspot.com/

Friday 29 January 2021

Lupine Publishers | The Effects of Breastfeeding on the Process of Tooth and Jaw’s Development

 Lupine Publishers | Journal of Otolaryngology

Abstract

From the nutritional point of view, it has been proven that breast milk has many benefits for the baby, and it is advisable for all mothers to give their baby milk, and if possible do not replace that with the bottle. In other words, we can say that the sucking mechanism used during bottle-feeding is markedly different from that used during breast-feeding. The Federation of Orthodontists of France announced in a report that breastfeeding not only prevents allergies and gastrointestinal infections and overweight, it also promotes the regular growth of the baby’s face. Some of the researches prove this hypothesis.

Keywords: Bottle Feeding; Breast Feeding; Sucking Mechanism; Growth of Baby Face; Allergies; Gastro Intestinal Infections; Overweight

Introduction

After birth, the baby learns how to suck on her mother’s breast. She instinctively brings forward her lower jaw and tongue; then starts sucking with full power so that all the muscles of her tongue, cheeks, lips, and jaw are involved. In all infants, since jaws are not fully developed at birth, sucking breast milk helps the jaw to grow as well as the teeth in the future [1-3]. Breast-feeding has been indicated as one of the main factors which are responsible for the correct growth and formation of dentofacial structures during the infancy [1-3]. Breastfeeding is a useful action for developing and growing teeth and jaws of infants [1-4]. The mechanism used in for the time of bottle-feeding is markedly different from that used during breast-feeding [5-7]. In the course of sucking mother’s milk, more muscles are activated to get milk than to drink milk from the bottles. During this action, the baby inserts more of the nipple into his mouth, consequently, moves the jaw up and down, and sucks the breast with all force to release the milk. To achieve this, the facial and oral muscles of the baby are involved in milking activities. This improves the shape of the jaws, and healthy teeth are expected to be in the correct eruption direction without any deviation and abnormalities [1-4].

The Main Cause of Abnormal Tooth Formation During Infancy

One of the factors leading to abnormal teeth and also leading children to orthodontic or speech therapies [8] is the abnormal orofacial muscular imbalance pattern of the tongue [9-11] known as tongue thrust. This problem is more common among children who are fed through the bottle and is often not seen among those who are breastfed. In other words, the breast-fed baby has more forceful gums and mandibles to extract the milk from the mother’s breast while a baby who is fed with a bottle, does not have to use extra jaws force because by a simple sucking a rapid flow of milk will be obtained. Of course, it should not be taken for granted that all children who use the milk bottle suffer from jaw problems, but it should be remembered that breastfeeding give better evolution to the jaws and teeth than the nourishment from the bottle.

Overview of Some Researches

The early transition from breastfeeding to bottle-feeding may contribute to inadequate mandibular development which can be a dominant and deleterious factor in the development of occolusofacial problems. In this part, we look at some research which may point out this strong hypothesis. Some studies have cited that breastfeeding is a protective factor against malocclusion: Labbok and Hendershot have suggested that increased bottlefeeding duration may contribute to the prevalence of malocclusions [12].

Viggiano et al. and Karjalainen et al. have indicated that breastfeeding can be a positive factor to prevent the development of posterior cross bite in the primary dentition [6,13]. Warren et al. reported that breastfeeding promotes normal palate development and weakens the formation of a deep and high-arched palate [14]. Several studies agree that bottle-feeding may be responsible for the development of sucking habits which may lead to some forms of malocclusion [6,14,15].

Conclusion

Breastfeeding acts on the process of sucking which are influencing the development of facial bones and muscles. Infants who are breastfed have greater facial muscle activities compare to those who are bottle-fed. In other words, breast feeders present an excellent orofacial muscle work out which helps to develop good their bony jaw structures. Moreover, breastfeeding prevents against orthodontic problems and malocclusions (for instance: overbite, posterior crossbite, tongue thrust, oral habits and etc.) that are cited in some researches.

Read More Lupine Publishers Pediatric Dentistry Journal Articles: 
https://lupine-publishers-pediatric-dentistry.blogspot.com/


Thursday 28 January 2021

Lupine Publishers | Review of Ten Years’ Experience of Endoscopic Skull Base Surgery in A Regional Hospital ENT Department - Queen Elizabeth Hospital

 Lupine Publishers | Journal of Otolaryngology


Abstract

Endoscopic skull base surgery is a relative new approach in ENT specialty. ENT Department of Queen Elizabeth Hospital started to do some ten years ago. It is a review of the types and experience of that endoscopic transnasal approach to manage skull base disease. 63 procedures in four types of surgery is recorded in a ten years period in that regional hospital in Hong Kong. The largest number being done is endoscopic nasopharyngectomy which is more common in southern part of China.

Introduction

The endonasal and endoscopic approach to the skull base provides a minimally invasive way to remove tumors that would otherwise require either a large cranial opening and brain retraction or disfiguring facial scars. Instead, an endoscope is advanced through the natural opening of the nasal cavity. A variety of tumors can be removed in this fashion, in various locations, with different maneuver of the endoscope to the desired location. This approach was first developed by endoscopic sinus surgeons but is now being used as minimally invasive skull base surgery to treat tumors as well. A ten years review of the cases being done in a regional hospital in Hong Kong gives some information about the possible future development of this field of surgery.

Method

Cases review of hospital notes and operative records from 2010 to 2019 in ENT Department of Queen Elizabeth Hospital. Different surgery involved skull base lesion done with endoscopic endonasal approach were studied.

Result

Four types of endoscopic endonasal skull base surgery were being done

a) Endoscopic nasopharyngectomy about 54 procedures done for recurrent NPC and result like open surgery.

b) Five procedures done for CSF leak & one is repeat procedure.

c) Two intranasal neuroblastoma & 1 sphenoid sinus procedures done for inverted papilloma.

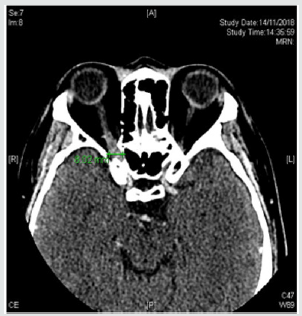
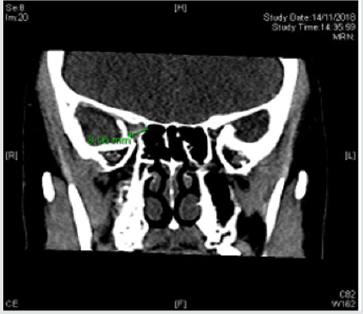
d) Two intraorbital and intraconal haemangioma removal procedures.

Discussion

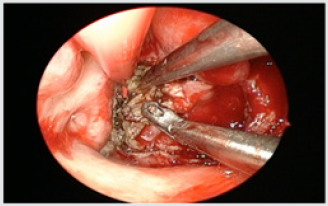
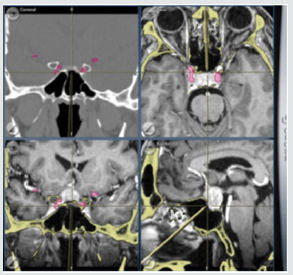
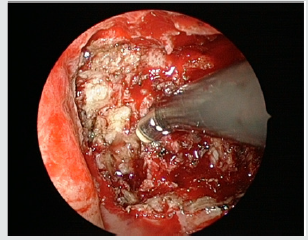
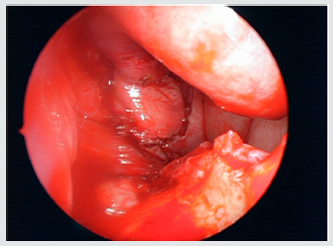
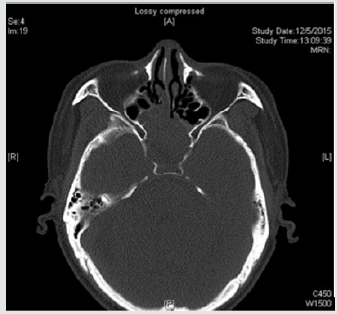
The development of navigation system and other power instrument used endoscopically helped the development of endoscopic skull base surgery to be done more safely and effectively. Example of endoscopic nasopharyngectomy was done first in ENT department QEH in 2010 for a post radiotherapy nasopharyngeal carcinoma patient with primary adenocarcinoma. It was done with two surgery four hands technique (Figure 1) and a complete excision was achieved. Subsequent endoscopic nasopharyngectomy were done for recurrent NPC patients with aid of power instrument of coblator which give a thin cut layer by layer when approaching the dangerous area of carotid and skull base (Figures 2&3) A nasoseptal flap were created to cover the nasopharyngectomy wound and help patient recovery faster (Figure 4). The overall longterm result is about the same as open surgery. The second types of surgery done for skull base lesion is cerebrospinal fluid leak which either resulted from iatrogenic causes or spontaneous causes or from meningocele. Dura seal and fibrin glue and cauterization of meningocele were used to stop the CSF leak. Lumbar drain was used by neurosurgeon in these cases when two specialty worked together (Figures 6 & 7).

Figure 1: Two surgeon four hands technique.

lupinepublishers-openaccess-journal-otolaryngology

Figure 2: Navigation system.

lupinepublishers-openaccess-journal-otolaryngology

Figure 3: Use of coblator.

lupinepublishers-openaccess-journal-otolaryngology

Figure 4: Nasoseptal flap covering nasopharyngectomy wound.

lupinepublishers-openaccess-journal-otolaryngology

Figure 5: Meningocele.

lupinepublishers-openaccess-journal-otolaryngology

Figure 6:

lupinepublishers-openaccess-journal-otolaryngology

Figure 7: Extracranial neuroblastoma.

lupinepublishers-openaccess-journal-otolaryngology

Figure 8: Sphenoid sinus inverted papillom

lupinepublishers-openaccess-journal-otolaryngology

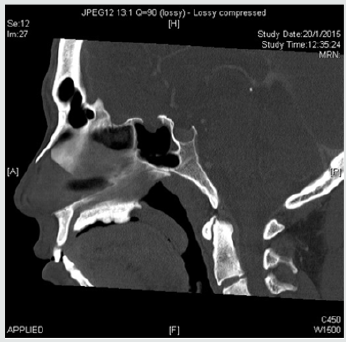
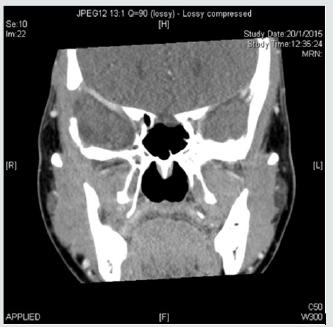
The third type of surgery is for tumor of neuroblastoma and inverted papilloma involving skull base. Endoscopic approach with post operation radiotherapy is used for a complete control of two cases of neuroblastoma with no intracranial extension. One inverted papilloma occupied and expands the sphenoid sinus and removed endoscopically (Figures 8 & 9). The last type of surgery is endoscopic removal of intraconal intraorbital tumor. It was done together with eye doctor to debulk and excise one cavernous haemangioma and one schwannoma (Figure 10). Lastly the degree of difficulty of endoscopic skull base surgery can be classified into different ladder according to some expert (e.g. Prof. Richard Carrau) It starts with level 1 to level 5. Level include sinonasal surgery, level 2 Pituitary gland surgery, CSF leak. Level 3 is extradural surgery of transcribriform to transodontoid etc. Level 4 is intradural and level 6 in cerebrovascular surgery. It takes a great effort to learn the technique in advanced level and a high-risk surgery. A teamwork with neurosurgeon is essential when intradural pathology is managed and therefore not every center even with neurosurgery support can do these surgeries especially with inadequate caseload experience.

Figure 9:

lupinepublishers-openaccess-journal-otolaryngology

Figure 10:

lupinepublishers-openaccess-journal-otolaryngology


Wednesday 27 January 2021

Lupine Publishers | Performance of West African Dwarf (Wad) Goats Fed Dietary Levels of Boiled Rubber Seed Meal (Hevea Brasiliensis)

   Lupine Publishers | Current Investigations in Agriculture and Current Research


Abstract

Effect of boiled rubber seed meal (BRSM) based diets on the performance of West African Dwarf (WAD) bucks was investigated. Four groups of WADS were randomly fed with the 4 experimental diets (A–D) formulated to contain 0, 10, 20 and 30% BRSM. The experiment lasted for 56 days. Average daily feed intake (g) were 417.90; 428.93; 322.00 and 288.10 for diets A, B, C, D, and the corresponding average daily weight gain was 31.69, 53.92, 46.62, and 34.64 respectively. Feed/gain ratio was 6.90 for goats fed diet C and 7.95 for those fed with diet B. Feed cost per Kg weight gain was N 115.29 for diet C and N 120.42 for diet B. The warm carcass and dressing % were insignificant among the 4 treatment groups, but goats fed diet C showed superiority. Legs, shoulder, sets and bone to lean ratio differed significantly between the treatment groups.

Keywords: Conventional; Non-Conventional; Rubber Seed; West African Dwarf Goats

Introduction

The economic depression of nations has greatly reduced meat availability, and the inadequacy of meat supply has been aggravated by a combination of environment, feed and management factors Wikipedia, [1], Udo [2]. In recent years many categories of Nigerian farmers tend to invest in ruminant livestock farming Hoffmann [3] yet cost of conventional feeds still posed big challenge Hassan [4]. Feed as reported by Akpodiete and Inoni [5], accounts for 60 – 70% of total cost of livestock production and that it’s inadequacy in quality and quantity could lead to a situation of low nutritional status, poor weight gain, poor reproductive ability, poor production, poor health condition and poor conversion ratio Fajemisin [6]. It therefore, becomes important to supply adequate feed in quantity and quality for optimal performance by livestock. Goats’ farming offers ample opportunity for meat inclement and availability. They are easy to keep, require smaller capital investment, play significant role in socio-economic life of the people as they contribute about 35% Nigerian meat supply Oloche [7], and provides income to farmers Peacock [8]. West African dwarf goats are the prevalent and trypono-tolerant breed in the derived and guinea savannah zones Eroarome [9], Udo [10]. But it is worrisome that lack of government legislation for the multiplication of this hardy breed, nutritional constraint particularly during the dry season coupled with the extensive mode of production posed serious problem to their production in the tropic Ahamefule [11] and Ahamefule and Udo [12]. To address the nutritional need of goats, it is therefore, important to supplement their diet with concentrate. As a result of high cost conventional feedstuff and in attempt to reduce competition between man and livestock, nutritionists are in search for alternative non-conventional feedstuff that are cheap and readily available Ahamefule and Udo [12]. There are huge naturally occurring non-conventional feedstuffs that can profitably be used to stimulate small ruminant production Udo [2], Udo [10]. Prominent among them is rubber seed which has no feed value for human Udo [10]. The Humid tropics has large acreage of rubber plantation, and in Nigeria it is cultivated on estimated 185,000 hectares with seed collection of about 10,175 tonnes/year Udo [2], with crude protein content range of 21 – 28%, Crude fibre range of 4.47 – 8% (Udo [2], Udo [10], Njwe [13] and energy range of 2.32 – 2.58 MJ/Kg Udo [2]. Several works on rubber seed have been reported for some breeds animal: pigs Babatunde [14], poultry Nouke and Endeley, 2001, sheep Njwe [13]; but there is paucity of information on the feeding of rubber seed to West African Dwarf Goats. This work however, was designed to evaluate the performance of West African dwarf goat fed dietary levels of rubber seed meal based diet.

Materials and Methods

Experimental Site

The study was conducted at the Goat unit of the Teaching and Research farm, Akwa Ibom State University, Obio Akpa campus, Akwa Ibom State, Nigeria. Obio Akpa is located between longitudes 7° 27’ E and 7° 58’ E. It is located within 3500 – 5000mm annual rainfall with average monthly temperature of 25 °C

Animal Management

Sixteen (16) weaners West African Dwarf (WAD) bucks of 6-7 months old were procured from farmers in the University environment and used for the investigation. On the fifth day of arrival, these animals were all dewormed using albendazole thiabendazole. They were subsequently given acaricide birth using asuntol solution and after that quarantined for 21 days and fed forage and supplements of the test diet for acclimatization. They were vaccinated against Pestes des petite ruminant (PPR) using Rinder pest Tissue culture vaccine. The goats were randomly divided into four groups of four goats per treatment and housed individually in well ventilated cement floored pens equipped with feeders and drinkers.

Experimental Design/Procedures

Four diets were formulated to contain 0 – 30% boiled rubber seed meal (BRSM) and designated as A, B, C and D. These diets were assigned randomly to the four animal groups in a completely randomised design. Each goat received 1kg of designated diet in addition to 2Kg of guinea grass (Panicum maximum). Daily feed intake was determined by subtracting daily feed refusal from the 1kg given the previous day. These were used to calculate the average daily feed intake, average daily weight gain feed conversion ratio, and feed economics of production for each treatment group.

Experimental Diets

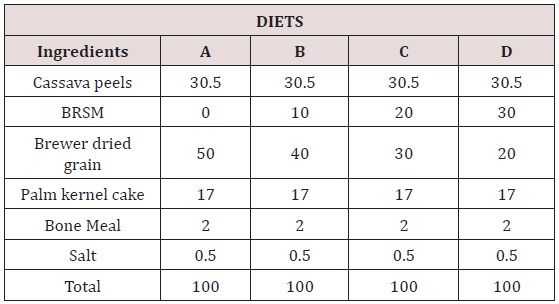
Four (4) experimental diets (A-D) were formulated to contain various inclusion levels (0-30%) of boiled rubber seed meal (BRSM) with other conventional ingredients as shown in (Table 1).

Processing of Rubber Seed

Twenty (20) kilogrammes of raw rubber seeds were introduced into cooking pot (in batches) whose water has attained boiling temperature (100 °C) and allowed to boil for 30 minutes after which the seeds were decanted. The boiled seeds were sun-dried for seven (7) days, then dehulled and nuts milled, pressed using garri processing machine to remove oil and the products used to formulate boiled rubber seed meal-based diet (BRSM).

Slaughter Technique

At the end of the feeding trail, three goats per treatment group were starved for 24 hours prior to slaughter. Each goat was weighed before slaughter, after bleeding and after dressing. Dressing percentages were calculated as the weight of dressed warm carcass in relation to the live weight before slaughter. The dressed warm carcass is defined as the weight of the goat after the removal of the head, skin, content of the thoracic, limbs, distal to the carpal and tarsal joints and pelvic cavities (including the diaphragm and kidney). The lungs, head, heart, liver, limb (four feet) and skin were weighed also.

Carcass Evaluation

Three animals per treatment group were slaughtered for carcass evaluation. Jointing of carcass (meat cut) was done following the method adopted by Ahamefule [11]. Each dressed warm carcass was divided down the spinal cord by means of meat saws into two (2) equal half and weighed individually. The left half was subsequently divided into various cuts consisting of thigh, shoulder, loin, sets and ends. Each of the cuts was weighed and the weight doubled in each case before expressing it as percentage of the dressed carcass. The leg (thigh) was severed at the attachment of the femur to the acetabulium; the loin consists of the lumber region plus a pair of ribs, the ends (spare ribs plus belly) consist of six (6) abdominal ribs, the shoulder consist of the scapular, and the sets made up of the breast and the neck. The loin cuts were then dissected into muscles and bone with ligament to obtain the meat to bone ratio.

tatistical Analysis

The experiment was laid out as completely Randomized design. All data were analysed in a one –way analysis of variance (ANOVA) using SPSS [15] package. Duncan’s Multiple Range Test Duncan [16] was used to separate significant means.

Chemical Analysis

All feed samples were analysed for proximate composition using AOAC (2007).

Results and Discussion

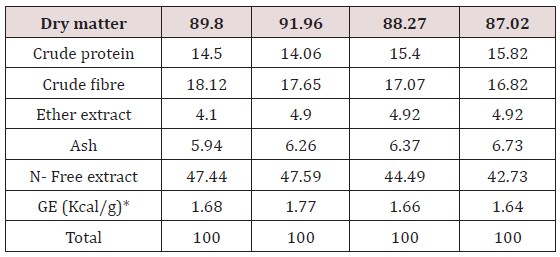
The composition and proximate assay of the experimental diets formulated to contain 0-30% boiled rubber seed meal (BRSM) are presented in (Table 1). The dry matter (DM) content of the diets, save for ration B (10% BRS), were fairly comparable (Table 2). The crude protein (CP) ranged from 14.06 – 15.82% and increased as inclusion levels of BRSM increased from B-D. Crude fibre (%) (CF) followed a reverse trend of the CP values. The ether extract (EE) composition (%) increased from diets A-D and stabilized in C and D. the ash contents (%) of the diets followed similar pattern as the EE, rising and stabilizing as the case was. Nitrogen free extract (NFE) values (%) rose from A-B and subsequently decline in diets C and D. The energy values (Kcal/g) followed similar trend as NFE. CP and energy content of the four diets were all above what is required by WAD goats as reported by Ahamefule [11], Akinsonyinu [17].

Table 1: Proximate composition of experimental diets containing various levels of boiled rubber (Hevea brasiliensis) seed meal.

Lupinepublishers-openaccess-Agriculture

Table 2: Chemical assay of experimental diets containing various levels of boiled rubber (Hevea brasiliensis) seed meal (%DM).

Lupinepublishers-openaccess-Agriculture

*Calculated, BRSM= Boiled rubber seed meal.

Response of West African Dwarf (WAD) Goats

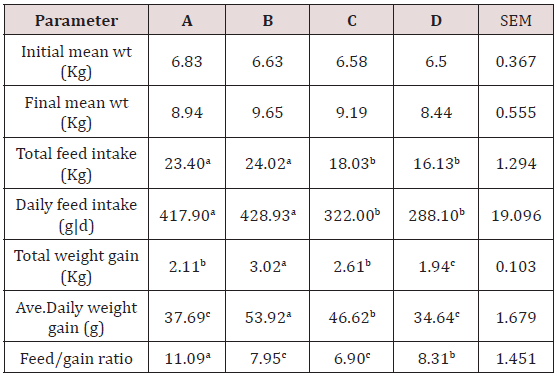
The performance of WAD goats fed various inclusion level of boiled rubber seed meal (BRSM) is shown in Table 3. Goats fed 10% BRSM consumed significantly (P<0.05) more feed (428.93g/d) than goats fed diets containing 0% (417.90 g/d), 20% (322.00g/d) and 30% (288.04g/d) BRSM. Goats fed diet A (Control) had similar intake (P>0.05) with goats fed 10% BRSM diet; their values were significantly different (P<0.05) with the feed intake of goats fed diets C and D. This may be due to the increasing levels of rubber seed meal from B-D which Gohl [18] reported that rubber seed is not quite palatable and appetizing to ruminant. However, the values obtained in this report is in consonance with previous reports by Spring [19] that feed intake and growth decreased as rubber seed meal (RSM) incorporation levels increased in poultry rations. Njwe [13] also reported that rubber seed is not quite appetizing to sheep and that RSM should not exceed 20% level incorporation and not more than 10% for poultry Babatunde [19] while Devendra [20] considered 20% as optimal inclusion level for pigs. The trend of intake in this study agrees with the report by Rajan [21] that weight gain was not affected when fed diet containing 20% BRSM, but subsequently, a linear decrease in feed intake and daily weight gain occurred as the incorporation of BRSM exceeds 20%. The feed gain ratio for goats fed 20% BRSM was least (6.90) and apparently best and was in line with the reports Njwe [13], Rajan [21] that small ruminants can utilize up to 20% rubber seed without adverse effect on performance. The average daily weight gain range of 34.64 – 53.92g obtained in this study compared favourably with the range reported for WAD goats within the first 12 months of life Nuru [22], Anya [23].

Table 3: Performance of WAD Goats Fed Experimental Diets Containing Various Levels of Boiled Rubber (Hevea brasiliensis) Seed Meal.

Lupinepublishers-openaccess-Agriculture

a,b,cMeans on the same row with superscripts differ significantly (P<0.05).

Feed Economy

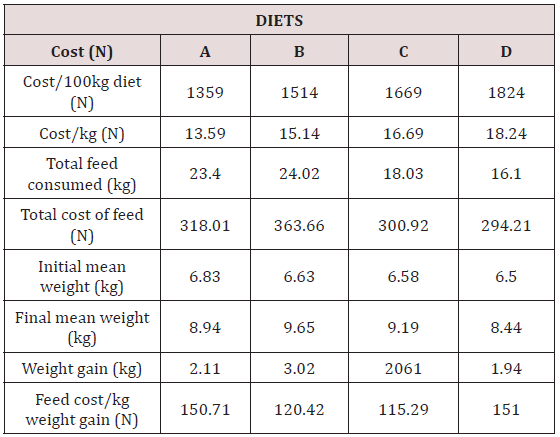
Table 4: Feed economies of WAD goats fed various inclusion levels of boiled rubber seed meal-based diets.

Lupinepublishers-openaccess-Agriculture

The economy of feeding WAD goats with various inclusion levels of boiled rubber seed meal (BRSM) is presented in Table 4. Daily feed consumed by animals in treatment A and B were similar, but the two groups differed significantly (P<0.05) from animals fed diets C and D that were also similar in their feed intake. Goats fed diet B (10% BRSM) supported highest daily weight gain followed by 20% and 30% respectively. The daily weight gain range (34.64 – 53.92g/d) reported in this study is lower than the range (35 – 65 g/d) reported by Nuru [22] for WAD goats. The feed cost per kilogram weight gain was N150.71 for goats fed diets A of 0% BRSM. The corresponding values for animals fed diets B, C and D were N120.42, N115.29 and N151.65 respectively. The result obtained in this study followed the findings trend of similar investigations by Ahamefule [11] and Anya [23]. They also reported superior feed cost per kilogramme weight gain for WAD goats fed diets containing 20% Pigeon pea and African yam bean respectively. For best yield returns on investment, incorporation of 20% BRSM in WAD goat’s diet is advisable.

Carcass Characteristics

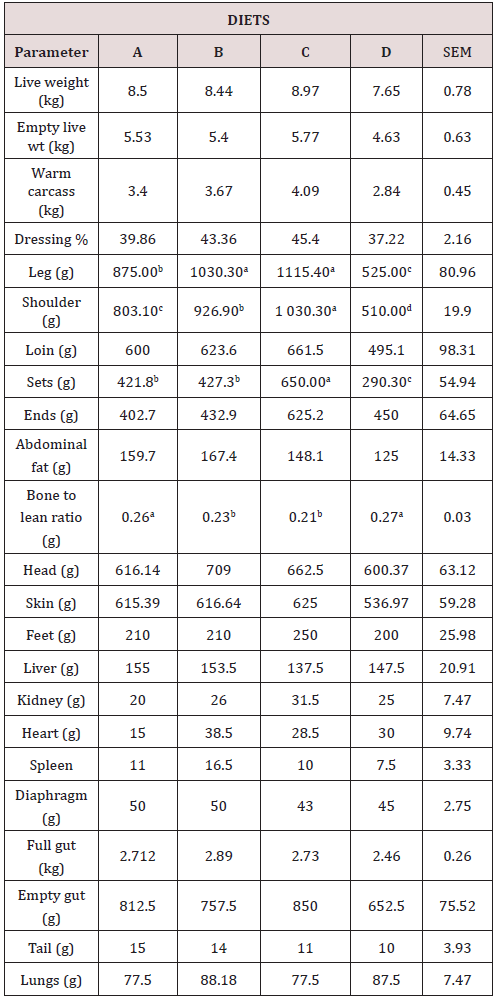
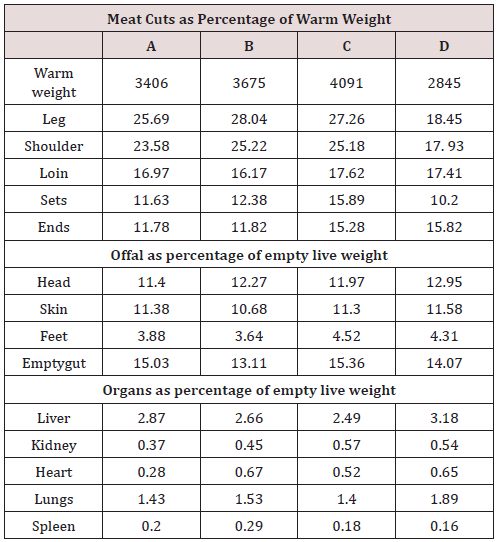
Table 5 shows the carcass yield of WAD goats fed graded levels of diets. The superior warm carcass value (4.09Kg) obtained for goats fed 20% BRSM was not significantly (P<0.05) different from the values of 3.40Kg, 3.67Kg and 2.84Kg recorded for goats fed 0%, 10% and 30% BRSM respectively. More so, there was no significant different (P<0.05) in their dressing percent, though goats fed diet C (20% BRSM) has a superior value of 45.40. The range of dressing percent (DP) obtained in this study (37.22 – 45.40) was comparable with the values (33.05 – 58.07) reported by Udo and Nuru (1985) 45 – 52% for WAD goats in different feeding trials. In Table 6 significant differences (P<0.005) only occur among treatment groups for leg, shoulder, sets and bone to lean ratio. The leg meat cut (g) was best for goats fed diet C (1115.40) and was not significantly different (P<0.05) from goats fed diet B (1030.30), but however differed (P<0.05) significantly from values for goats fed diets A (875.00) and D (525.00). In the shoulder cut (g), goats fed diet C had best cut (1030.30) which also differed (P<0.05) significantly from corresponding values obtained for goats fed diets A (803.10), B (926.90) and D (510.00) Goats fed 20% BRSM (C) diet had sets value (650.00g) which was superior (P<0.05) to other treatment groups. In all parameters investigated goats fed BRSM yielded superior meat cuts relative to other treatment groups indicating that it was best utilized of all the diets. The relatively high but comparable bone to lean ratio obtained for goats fed 0% and 30% BRSM diets in this study is an indication of high feed conversion efficiency by goats in group C (20% BRSM). This is also confirmed by the superior dressing percent (45.40%) and lowest (6.90) feed conversion ratio of goats fed 20% BRSM diet. The mean organ weight for the different group of goats fed the BRSM diets in Table 4-6 shows that all the organs (Liver, Kidney, Heart, Lungs and Spleens) weights were similar (P<0.05); they were not affected by the dietary treatments. Proving that all the inclusion levels of BRSM were safe as dietary concentrate for WAD goats but 20% BRSM diet gave outstanding performance in feed gain ratio, daily weight gain, dressing percent, meat cuts (leg, Shoulder, loin, sets, ends) and bone to lean ratio of WAD goats. Therefore for goat’s production/ fattening programmes, 20% inclusion level of boiled rubber seed meal is recommended as it also produced the cheapest cost per. kilogramme weight gain. This study has shown that if WAD goats are given right nutrition, sixty days could be used to fatten them to market weight, therefore making it possible for a farmer to carry out fattening programmes up to 6 times in a year. Thus generating good income for the farmer.

Table 5: Carcass yield of West Africa dwarf goats fed various levels of boiled rubber (Hevea brasiliensis) seed meal-based diets.

Lupinepublishers-openaccess-Agriculture

abcdMeans in the same row with different superscripts differ significantly (P<0.05).

Table 6: Average weight of meat cuts, organs and offal weights expressed as percentages of warm carcass or empty live weight.

Lupinepublishers-openaccess-Agriculture

Conclusion

This study revealed that boiled rubber seed meal generally enhanced performance at different level (10-30% BRSM) with all the inclusion levels being safe as dietary supplement for WAD goats. However, 20% BRSM inclusion level gave the best performance, and is therefore recommended for goat’s production/fattening programme as it also produced the cheapest cost per kilogramme weight gain.

Read More Lupine Publishers Agriculture Journal Article:

Tuesday 26 January 2021

Lupine Publishers| Impact of Some Fertilization Treatments on Crop and It’s Atrebuites on “Fuerte” Avocado Trees

  Lupine Publishers | Current Investigations in Agriculture and Current Research


Abstract

This study was carried out throughout two successive seasons 2015 and 2016 at Horticulture Research Station at El-Kanater El-Khayria, Qalyubeia Governorate on 20-year-old avocado trees (Persea americana Mill.) “Fuerte” cultivar grafted on Dayouk rootstock and irrigated with through farrow (surface) irrigation system. In this sequence (N1) as the control or untreated trees and other trees were treated with four treatments of different addition times of nitrogen soil fertilization (N2, N3, N4 and N5) all only once and once with boron and zinc as foliar spraying in concentrations (1, 2 and 3 g/L) beside combination between them. Nitrogen fertilization rated 1200g /tree in 3 times as (NH4No3) 33. 5%. Boron was used as sulaphate boron (17, 5%) and zinc was used as sulphate zinc (34%) each treatment was sprayed independently or in combination three times during (October, January, April). Pollen germination, fruit set as well as yield, fruit weight, flesh weight, oil content percentage and vitamin C were determined to assess the effect of the treatments. The obtained results showed that nitrogen soil application time and boron and zinc foliar spraying were significantly affected on improving all the tested parameters compared with control trees. The study also showed that, nitrogen soil application time N2 with boron and zinc combination at 1g/L/tree was more effective than the other treatments and gave significantly the highest values in comparison of other testes treatments in both seasons of study.

Keywords: Avocado; Fuerte; Nitrogen; Boron; Zinc, Foliar spraying; Application time; Fruit set; Fruit quality and oil content

Introduction

The avocado Persea Americana, Mill belongs to the family Lauraceae. It has developed into three horticultural races (West Indian, Guatemalan and Mexican [1], which are adaptable to a wide range of soil and climatic conditions. Avocado which has been referred to as the most nutritious of all fruits [2], has gained worldwide recognition and significant volume in international trade. Although relatively new in international commerce, this unique fruit has been appreciated and utilized for at least 9000 years in and near its center of origin in Meso-America [3]. Avocado is a relatively new crop in areas of the world outside its native range in the American tropics. In 2013, world production of avocados was 4.7 million tons, with Mexico alone accounting for 32% (1.47 million tons) of the total production. Other major producers include Dominican Republic, Colombia, Peru and Indonesia, together totaling 1.26 million tons or 28% of world production (FAOSTAT of the United Nations 2013). “Fuerte” is one of the most common avocado cultivars in the international market. “Fuerte” accounts for about 55% of the production in Mexico and California and is important in other countries [4] and [5]. In Egypt, the avocado was grown in limited areas in El-Delta, in 50s and 60s of the previous centuries. Only Fuertre and Dayouk were grown in these areas until recent were new areas as El-Nubaria, Ismailia and El-Khatatba started to be grown with avocado.

“Fuerte” the most spread cultivar is a Mexican _ Guatemalan hybrid, Trees are large, with spreading crowns; leaves have aniseed smell when crushed, red flecking on wood of new shoots; flower Group B, fruit pyriform with distinct neck but variable ranging from elongated with long narrow neck to dumpy with short broad neck, medium to large size weighing 170–500 g, skin thin, green, medium gloss, supple leathery texture, pimpled surface, seed size is Medium to large, conical with pointed apex, early maturing with pale yellow flesh, 75–77% recovery, excellent quality with flavoursome, nutty after-taste, good on-tree storage, but short shelf-life when ripe. The chemical composition of avocado depends on the cultivar and stage of ripening [6]. In Egypt, “Fuerte” is harvested all year round but its’ main season is from October to December. Main problems facing avocado plantations are slow to reach production, low yields in cooler climates with a marked tendency for erratic cropping and sensitivity to low temperatures during flowering and fruit set [7].

Nitrogen seems to be the most important element in avocado nutrition. Deficiencies of nitrogen in avocado result in small, pale leaves, early leaf drop, and smaller and fewer fruits [8]. In addition, nitrogen deficient trees were found to be more susceptible to frost damage [9]. Boron is essential for pollen germination, for successful growth of the pollen tube through the stigma, style and ovary to the ovule [10]. On worldwide basis zinc (Zn) is a very critical microelement because the avocado is very susceptible to their deficiency. Symptoms of Zn deficiency are observed in acid soils from which it is easily leached at a low pH and in calcareous soils in which it is fixed in unavailable forms. Early deficiency symptoms are mottled, narrow, disproportionately small leaves at the terminals, usually light green or chlorotic in color. Leaf margins are necrotic, and internodes are shortened in advanced cases [11].

Numerous fertilization regimes were proposed by several scientists to overcome cropping problems [12] studied the effect of nitrogen fertilizer application times and rates on “Hass” avocado to increase total yield without reducing fruit size and found that application time proved to be an important determinant of total yield lower annual N would reduce fertilizer expense and protect the environment. Boron sprays applied either during fall or spring on trees not deficient in boron (based on leaf analyses) have been effective in increasing fruit set in a number of deciduous tree fruit, nut crops and in avocado [13]. [14] on avocado trees proved that B and Zn were significantly improved pollen germination; fruit set number as well as yield per tree and increased fruit weight, length and breadth of fruits. They showed that the combination of B+Zn had positive synergistic effect and gave the highest values in the tested parameters. According to [15] Zn level at (0.5 %) improved fruit set wheras levels (0.25, 0.5 %) were more effective on fruit drop number and enhanced production of piryform fruits with more elongation. The scope of the present study was to illustrate the impact of nitrogen fertilization regimes with or without foliar sprays of both zinc and boron on the performance of Fuerte avocado trees.

Materials and Methods

This investigation was carried out through the two successive seasons of 2015 and 2016 on 20-year-old avocado trees (Persea Americana, Mill.) “Fuerte” cultivar grown in the experimental orchard of the Horticulture Research Station located in El-Qanater El-Khayreia, Qalubia Governorate, Egypt. Trees were planted at 7x7 meters (86 trees/ feddan (. One hundred and fifty Feurte cultivar trees grafted on Dayouk rootstock were chosen for this study. The chosen trees for the investigation were uniform in their vigor, size, shape and disease free, grown on loamy clay soil and irrigated with a farrow (surface) irrigation system. Trees were subjected to normal cultural practices recommended by the Ministry of Agriculture except for the treatments of this investigation. Experimental design followed the complete randomized block design. The following regimes were conducted each on three separate trees (each acting as a replicate).

Considered fertilization regimes

Nitrogen fertilization regimes: All trees used in this investigation were fertilized by broadcast with 1200 gm N as the recommendation of ministry of Agriculture (the fertilizer ammonium sulfate 20% N was used). Five regimes were considered based on percentage and time of application. The considered regimes were:

N1: Control as farm’s regime. Fertilizer was split into 3 doses i.e. November 400 g/tree (33.3%), 400 g/tree (33.3%) in January and 400 g/tree (33.3%) in May.

N2: Fertilizer was split into 3 doses 240g/tree (20%) in (January), 600 g/tree (50%) in (May) and 360 g/tree (30%) in (August).

N3: 600 g/tree (50%) in (January), 360 g/tree (30%) in (May) and 240 g/tree (20%) in (August).

N4: 600 g/tree (50%) in (January) and 600 g/tree (50%) in (May).

N5: 600 g/tree (50%) in (May) and 600 g/ tree (50%) in (August).

Boron and zinc regimes

B: boron the product boron sulphate (17. 5% B) was used in three concentrations (1, 2, 3 g/L) / tree i.e. (175, 350, 525 ppm) respectively as B1, B2 and B3.

Zn: zinc the product zinc sulphate (34.5% Zn) was used in the same concentrations (1, 2, 3 g/L) / tree (345, 690, 1035 ppm) respectively as Zn1, Zn2 and Zn3.

B+Zn: combination between them as (B1+Zn1, B2+Zn2 and B3+Zn3) in (1, 2, 3 g/L) / tree.

Treatments were sprayed with a mechanical sprayer until runoff each for three times, the first at the beginning of flower bud induction in (October), the second spray was at bud burst during (January) and the last and third one was at anthesis in (April). Fifty treatments were performed each on 3 separate trees as follows: N1, N1+B1, N1+B2, N1+B3, N1+Zn1, N1+Zn2, N1+Zn3, N1+B1+ Zn1, N1+B2+ Zn2 and N1+B3+ Zn3 and the same way with the treatments N2, N3, N4 and N5.

The following parameters were assessed to evaluate the comparative effects of the conducted treatments.

a) Pollen grains germination percentage

Five inflorescences were chosen randomly on each of the considered trees to assess comparative effects of conducted treatments on this parameter and the fruiting parameters. Pollen germination (%), Pollen grains were collected during anthesis stage. Flower in the male stage of the reproductive cycle were collected in paper bags then transferred to the laboratory. After anther dehiscence when pollen shed they were collected and incubated in Petri dishes on a medium containing 15% sucrose and 0.8% agar according to [16]. Pollen germination was recorded after 6 hours as the percentage of germinated pollen in a total of 500 grains from different areas of plat. Each pollen sample was replicated three times. Pollen was considered to have germinated if pollen tube length was at least twice as long as the diameters of grain, samples were observed by Optical microscope.

b) Yielding Parameters

In both seasons, fruit set was determined by marking five flowering branch ends around the circumference of each treated trees two weeks after full bloom and fruit set percentage was calculated. On the last week of August just at harvest time the number of fruit/ branches was counted to estimate the final fruit set (number of fruits per branch/number of initial flowers *100). At harvest, fruits of each tree were picked, counted and weighed with a digital balance in Kgs. The yield (Kg) was determined as total number of fruit / tree *Average fruit weight (gm)/1000).

c) Fruit quality Parameters

Mature Fuerte fruits were harvested at the 3rd week of September maturity according to [17]. Samples of five representing fruits from each considered tree are harvested, cleaned packed in carton boxes in one layer and transferred to laboratory then both of physical and chemical parameters were assessed.

i. Physical Parameters

The following parameters were determined: fruit weight (g) and flesh weight (g) by using a digital balance.

ii. Chemical Parameters

Free fatty acids were determined by comparison of retention time of the gas chromatographic peaks with these of commercial free fatty acid methyl ester standards, then automatically computed as a percentage by the data processor (Chrom card) from the ratio of individual peak area to the total peaks area of fatty acids. Vitamin C as mg ascorbic acid/100 gm fruit weight was determined and estimated/ 100 ml fruit juice, according to [18].

d) Statistical design and data analysis

Experimental design followed the complete randomized block design. The obtained data was subjected to factorial analysis according to [19]. Attained means were compared by using New LSD method at 5%.

Results and Discussion

Fruit set parameters

Table 1: Effect of nitrogen soil application time, boron and zinc foliar spraying on pollen germination percentage per tree.

Lupinepublishers-openaccess-Agriculture

Pollen grains germination (%): Data presented in Table 1 showed that pollen germination percentage significantly varied with adopt treatments. With respect to nitrogen regimes, on the average the highest significant percentage attained was dedicated to (N2) treatment amounting to (77.36 &77.74 %) for both seasons respectively whereas, the significantly the lowest percentage was due to (N1) treatment (control) amounting to (59.04 & 59.23 %) for both seasons respectively. With respect to the foliar spray treatments on the average the applied treatments increased this parameter in the first season significantly compared with control except for (B3, Zn3 & B3+Zn3) treatments whose effects were statistically equal to control. In the second season however, treatments (B1, Zn2, Zn3 & B3+Zn3) did not induce any significant effect compared with control. The other treatments resulted in significantly higher percentages. Highest significant germination percentage was attributed to (B1+Zn1) treatment in both seasons amounting to (76.59 & 77.55 %) in both seasons respectively.

Interaction between the two main factors was significant. The highest values of pollen germination percentage (84.33 & 86.13 %) and (84.50 & 84.17 %) in both of seasons respectively were dedicated to (N2+ B1+ Zn1) and (N3+ B1+ Zn1). While the lowest percentage (553.57 & 55.27%) were due to (N1) and (N1+B3) treatments respectively in the first season. While in the 2nd season they were (53.27 & 54.63%) for both with (N1+Zn3) and (N1+B3) respectively. The obtained results are in line with the finding of [20] who proved that effect of combination of these nutrients positively affected pollen germination. [21] reported that boron plays an important role in pollen germination and pollen tube growth.

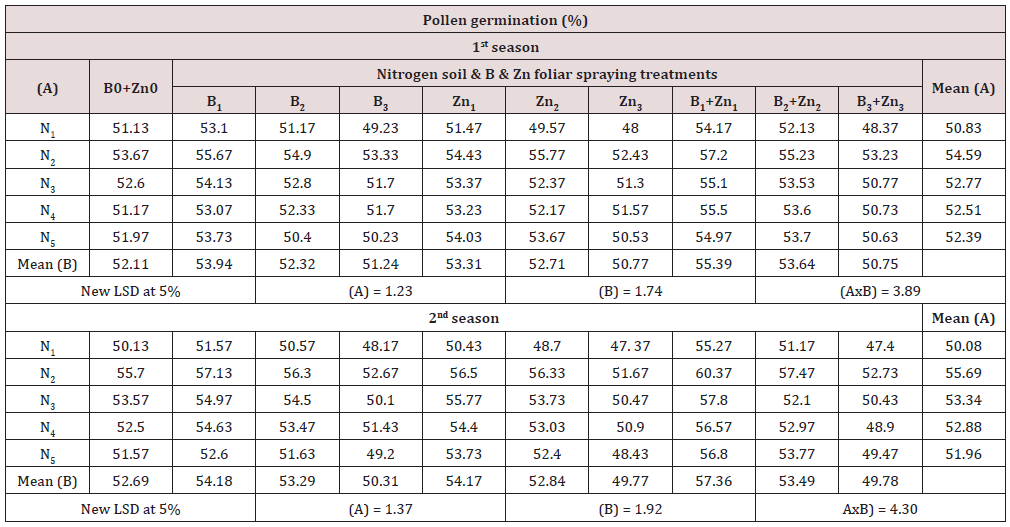
Fruit set (%): Table 2 showed that the on the average the applied nitrogen regimes in the both seasons were more effective significantly than control with (N1) which resulted in the lowest percentages (50.183 & 50.08 %) respectively whereas, (N2) treatment recorded the highest significant percentage (54.59 & 55.69 %) for both seasons respectively. With respect to foliar treatments, on the average their effects varied. Highest significant percentage in both seasons were attributed to B1Zn1 in both seasons amounting to 55.39 & 57.36 respectively and B1 treatment in the first season (53.94%) while (B3+Zn3) and (Zn3) recorded the lowest values (50.75 & 49.87 %) and (49.87 & 49.77 %) for both seasons respectively.

Table 2: Effect of nitrogen soil application time, boron and zinc foliar spraying on fruit set percentage per tree.
Lupinepublishers-openaccess-Agriculture

Furthermore, interaction between nitrogen soil application regimes and boron and zinc foliar spraying application during both seasons was significant. Data showed that the combined (N2+B1+Zn1) induced the highest fruit set percentage amounting to (57.2 & 60.37 %) in both seasons respectively. These findings are in agreement with [22] who found that increase in fruit set due to boron might be attributed to its role in maintaining high pollen viability and germination. also, it seems that the improvement in fruit set percentage could be explained as a result of increase pollen tube elongation due to boron treatments [23]. [24] on date palm found that (N, P, K and Zn) spray application can improve fruit set, yield and fruit size without thinning. In addition, zinc is involved in protein synthesis, influence on electron transfer reaction including those in the Kreb’s cycle and subsequently on energy production in the plant and also directly involved in the synthesis of indole acetic acid [11].

Yield (Kg)/tree: It is obvious from data in Table 3 that in both seasons of study on the average yield significantly varied in response to nitrogen soil application regimes. The highest significant yield (106.60 & 107.33 kg) in both seasons respectively was attributed to (N2), while significantly the lowest yield (74.49 & 75.42 kg) was obtained from (N1) treatment as control in both of seasons. On the other hand, yield of avocado varied on the average due to foliar treatments. Supreme crop was attributed to the (B1+Zn1) treatment in both seasons (102.66 & 104.59 kg). Whereas both (Zn3) and (B3+Zn3) resulted in statistically the least crop in both seasons amounting to (87.82 & 89.01 kg) and (82.58 & 84.71 kg) respectively.

Table 3: Effect of nitrogen soil application time, boron and zinc foliar spraying on fruit weight (g) /tree.

Lupinepublishers-openaccess-Agriculture

Interaction between the studied factors was statistically significant which referred to that nitrogen soil application and boron, zinc foliar spraying act dependently in this concern. The highest yield (113.9 & 116.1 kg) was attributed to from (N2+B1+Zn1) treatment in both seasons respectively, while the lowest yield (69.2 & 64.4 kg) and (68.1 & 65.7 kg) were obtained from (N1+B3+ Zn3) and (Zn3 treated in both seasons, respectively. Enhancements in crop due to the afore mentioned treatments are basically due to their effects on increasing both the pollen grain germination percentage and fruit set percentage .The available reports concerning the effect of nitrogen application time, boron and zinc foliar spraying on avocado yield are in agreement with the results of [14] on avocado and [15] on guava, they found that foliar sprays either boron or zinc increased tree yield.

Physical fruit parameters

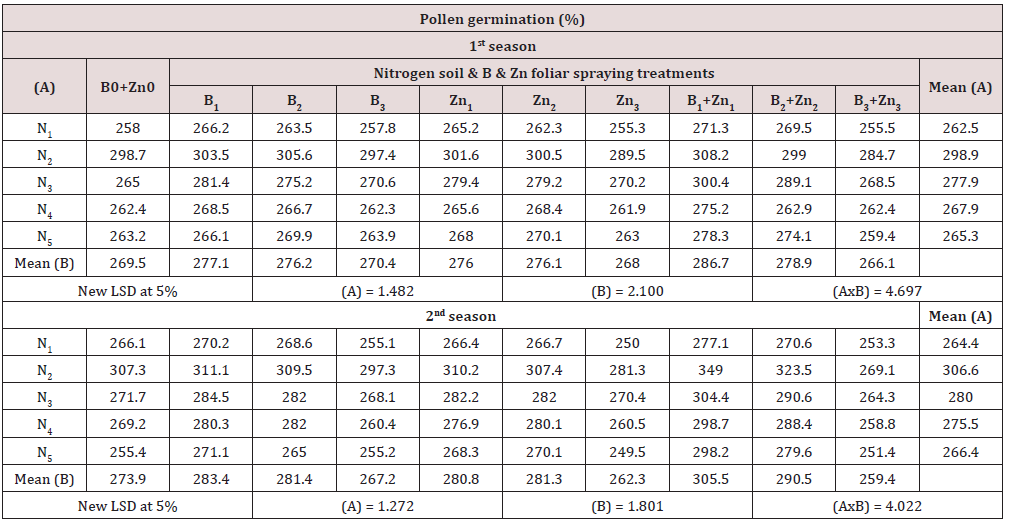
Table 4: Effect of nitrogen soil application time, boron and zinc foliar spraying on flesh weight (g)/tree.
Lupinepublishers-openaccess-Agriculture

Fruit weight (g): Table 4 indicated that in both of seasons on the average all considered N regimes significantly increased the average fruit weight than control. Highest significant effect was due to (N2) treatment (298.9 & 306.6 g). While, (N1) control showed the lowest values (262.5 & 264.4 g) for both seasons respectively. With regards to boron and zinc foliar spraying treatments on the average, (B1+Zn1) induced the highest significant fruit weight in both seasons (286.7 & 305.5 g) respectively. While both (Zn3) and (B3+Zn3) treatments showed statistically the lowest values (268.0 & 266.1 g) and (262.3 & 259.4 g) respectively. On other hand, interaction between nitrogen soil application and foliar spraying of boron and zinc was significant. Data cleared that fruit weight also attained significantly the highest magnitude due to. (N2+B1+Zn1) treatment resulted (308.2 & 349.0 g) respectively in both tested seasons. Whereas control (N1) in both seasons with (Zn3) and (B3+Zn3) treatments induced the least fruit weight (255.3 & 250.0 g) and (255.5 & 253.3 g). These results are in general concurrence with [25] and [26,27].

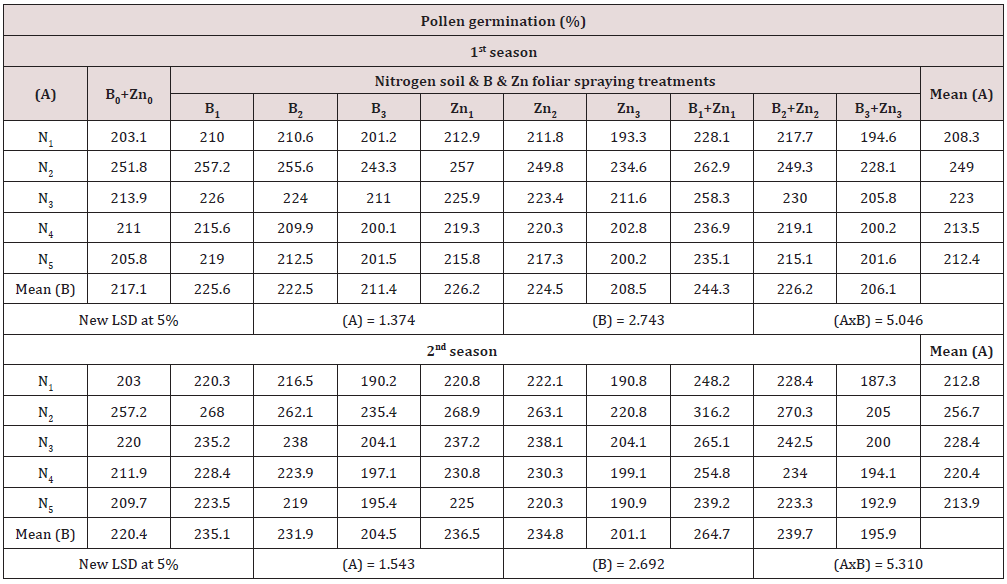
Flesh weight (g): Data in Table 5 showed that flesh weight was significantly affected by applied nitrogen regimes on the average. Significantly the heaviest flesh weight was attributed to (N2) treatment (249.0 & 256.7 g). Whereas, control in both seasons and (N5) treatment in the second one showed the lowest flesh weighted. Concerning boron and zinc foliar spraying treatments, on the average significantly the heaviest flesh weight recorded was (244.3 & 264.7 g) was due to (B1+Zn1). Whereas, (B3+Zn3) in both seasons (206.1 & 195.9 g) and (Zn3) (208.5 g) in the first season showed significantly the lowest values. Interaction between the two main factors was significant. The highest magnitude of flesh weight in both of seasons was dedicated to (N2+ B1+Zn1). The obtained results are in line with the finding of (Kumar and Verma 2004) on lichi.

Table 5: Effect of nitrogen soil application time, boron and zinc foliar spraying on flesh weight (g)/tree.
Lupinepublishers-openaccess-Agriculture

Chemical fruit characters

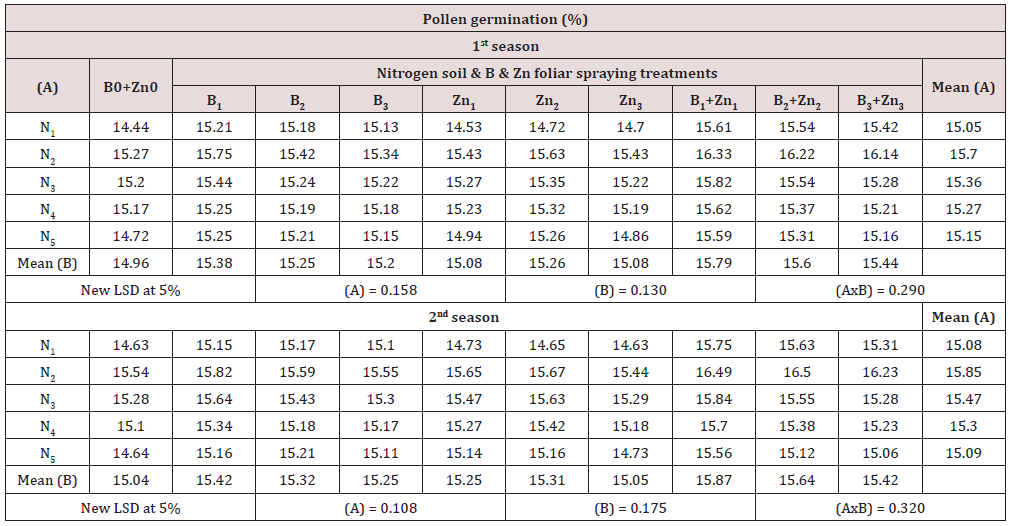
Oil content (%): Oil content as affected by conducted treatments is presented in Table 6. Data showed that on the average (N2) treatment resulted in the highest significant oil content (15.70 & 15.85 %) for both considered seasons respectively. On the contrary showed (N1) induced significantly the lowest content amounting to (15.05 & 15.08 %) for both seasons respectively with insignificant differences from (N5). As for average effect of foliar treatments, (B1+N1) treatment showed the highest significant oil content amounting to (15.79 & 15.87 %) for both seasons respectively. Whereas, unsprayed trees bore fruits with significantly the lowest oil content (14.96 & 15.04 %) for both considered seasons respectively). Differences from (Zn3) treatment were insignificant. Interaction data were significant. Data showed that highest oil content was attributed to (N2+B1+Zn1) and (N2+ B2+Zn2) treatments with insignificant differences between them. While the lowest content was attributed to N1& no spray treatment in both seasons. These results are in no agreement with those of [15] who illustrated that there was no significant different were observed in fat percentage, however this result in the line with agree with [28] and [29].

Table 6: Effect of nitrogen soil application time, boron and zinc foliar spraying on oil content percentage.
Lupinepublishers-openaccess-Agriculture

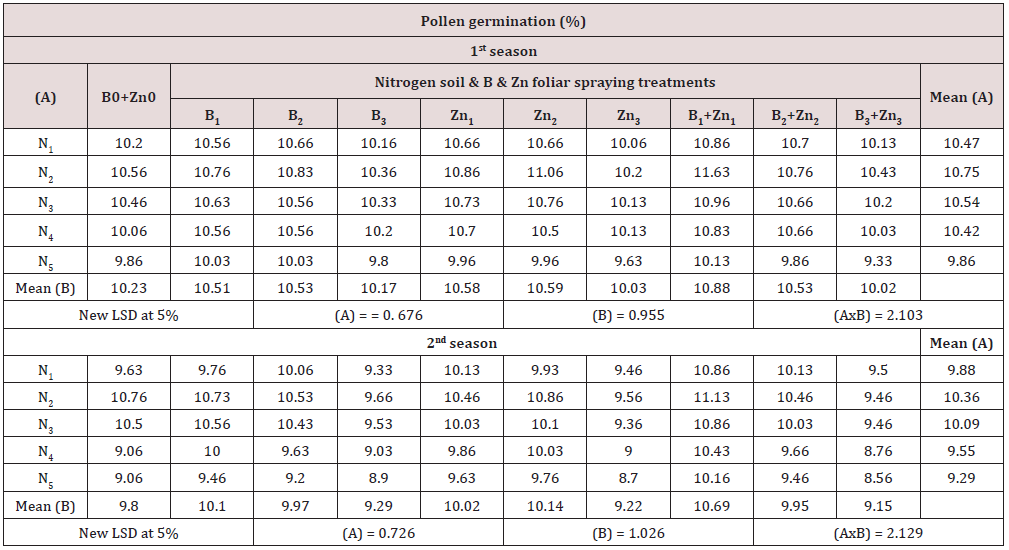
Vitamin C (mg/100g): It’s obvious from Table 7 that (N2) recorded the highest fruit vitamin C content in both of seasons (10.75 & 10.36 mg/100g). Whereas, (N5) treatment showed the lowest magnitudes. As for the average effects of spraying treatment, as (B1+Zn1) was the most effective treatment in this respect in vitamin C with values (10.88 & 10.69 %) respectively compared with the combination of boron and zinc at 3 g/L treatment. The combination of boron and zinc at 1g/L and nitrogen application time treatment (N2) as (N2+B1+Zn1) increased vitamin C fruit content (mg/100g) in both seasons (11.63 & 11.13), while the treatment (N5) with boron and zinc combination in concentration 3g/L as (N5+B3+Zn3) showed the lower values in both seasons with (9.33 and 8.56) respectively. [30] reported that B and Zn sprays enhanced ascorbic acid content in guava.

Table 7: Effect of nitrogen soil application time, boron and zinc foliar spraying on vitamin C (mg/100g).
Lupinepublishers-openaccess-Agriculture

In Conclusion the Present Study Clearly

Illustrate that nitrogen fertilization regimes clearly affect the cropping and its’ attributes in avocados. also, for foliar application of boron and zinc in combination, it showed clear enhancements in terms of increasing pollen grains germination percentage leading to increasing the crop. Also, their application showed enhancements in crop physical and chemical characteristics [31-33].

As a Recommendation

It is preferable to fertilize avocado trees cv. Feurte with nitrogen at 240g/tree during (January), 600g/tree during (May) and 360 g/ tree during (August) combined with 3 foliar application of boron and zinc at 1g/L at for three times, the first at the beginning of flower bud induction in (October), the second spray at bud burst during (January) and the last and third one was at anthesis in (April).


Read More Lupine Publishers Agriculture Journal Article:

Monday 25 January 2021

Lupine Publishers | Study on On-farm Dairy Cattle husbandry Practices in Walmera District of Oromia Regional State

    Lupine Publishers | Current Investigations in Agriculture and Current Research


Abstract

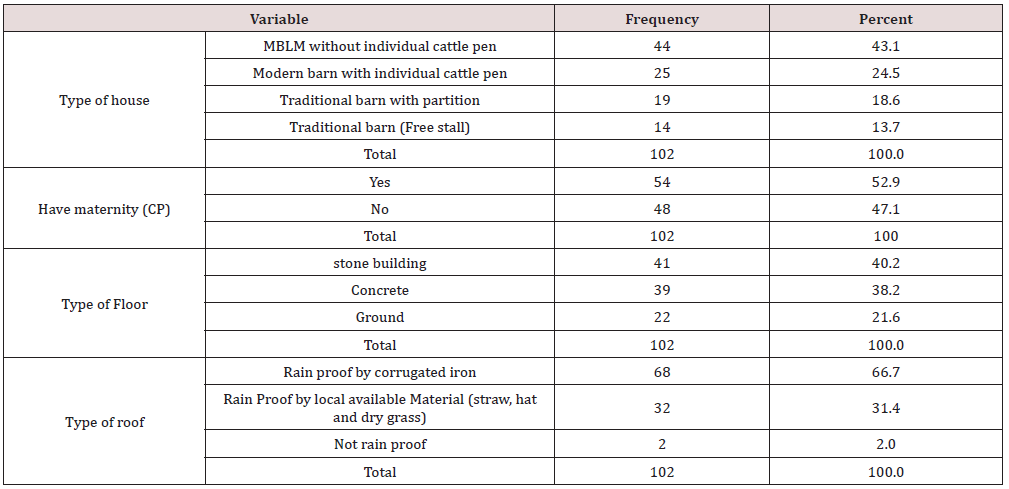
This study was carried out with the objective of studying on-fam dairy cattle husbandry practices in the Walmera district of Oromia regional state. The dairy cattle husbandry practices were based on field observation, questionnaire survey, focus group discussion and key informant interview. A total of 102 dairy producers were selected by using stratified random sampling technique from purposively eleven target kebeles. The survey result indicated that majorities 72.5% of household heads under investigation were male and the rest 27.5% were females. Majority of the respondents 40.2% had the family size of 7-9 members and about 23.5% had family size more than 10. Literacy wise, nearly half of the respondents (46.1%) were attended elementary education (1-8 grade), whereas 31.4% illiterate and unable to read and write. The breeding method preferred and perceived as more effective for conception by respondents were natural mating (65.7%), AI (20.6%) and others did not identify the difference between natural mating and AI (13.7%). Majority of respondents in the study area fed their dairy and other animals separately (80.4%) and 19.6% of them fed all animal together. Feeding of dairy cows based on the milk yield and separately practiced by 65.7% of the respondents, while the rest were not practiced. Grazing land was decreased from year to year mainly due to urbanization and land used for crop cultivation. However, 63.7% of the farmers did not have experience to establish improved forage but only 36.3% had grown improved forage. Even if, there was no accessibility of agro-industrial by-products because of high price, shortage of supply and far distance from the source agro-industrial center, 98% of respondents were supplementing their dairy animals with agro-industrial by-products and only 2% of respondent had reported unavailability of agro-industrial by-products in the market. Bloating (44.1%), emaciation and bloating (29.4%) and milk fever and bloating (9.8%) were among the most nutritional related diseases hampering dairy production in the study area. Majority (43.2%) of the respondents were used modern barn type constructed from local materials without cattle pen. It could be concluded from the study that in the study area on-farm dairy cattle husbandry practiced by dairy producers are encouraging for future dairy development as a whole with minor improvements.

Keywords: Dairy cattle; Husbandry practice; On-farm; Walmera district

Introduction

Ethiopia, with 59.5 million heads of genetically diverse cattle, has the largest population in Africa. Cattle production plays an important role in the economies and livelihoods of farmers and pastoralists through contributing products and by-products in the form of meat, milk, honey, eggs, cheese, and butter supply etc. that are essential sources of animal protein that contribute to the improvement of the nutritional status of the people. Cattle produce a total of 3.1 billion liters of milk annually [1]. Livestock are, therefore, closely linked with the economic, social and cultural lives of millions of resource-poor farmers for whom animal ownership ensures varying degrees of sustainable farming and economic stability. In spite of the existing enormous livestock resource, the contribution of the sub sector to the agricultural production, foreign currency earnings and total GDP is not up to expectations. The potentials for increased livestock production and the productivity is proportionally lowered by various poor livestock management problems, prevalence of major endemic diseases, poor feeding and high stocking rate on grazing lands, lack of support services such as extension services, veterinary services, insufficient data to plan improved services and inadequate information on how to improve animal breeding, marketing, and processing [2].

Assessment of the cattle husbandry practices is a pre-requisite to bring improvement in cattle productivity in the country in general and in the study area in particular. Understanding of dairy cattle husbandry practices also helps to design appropriate technologies, which are compatible with the existing system; and to plan development and research activities and bring improvements in productivity. So far, most of the studies were limited to overall livestock management systems and carried out mainly on station; and on-farm dairy cattle husbandry practices have not fully studied yet in the study area. Therefore, it is apparent that there is a need to study on-farm dairy cattle husbandry practices in the Walmera district as a system approach to design appropriate technologies compatible with the existing system and to plan development and research activities aimed at improving dairy cattle production. Moreover, this study was also furnished essential information and experience for future dairy development efforts. Therefore, this study was intended to amplify and characterize the overall on-farm dairy cattle husbandry practices in the study area.

Materials and Methods

Description of the Study Area

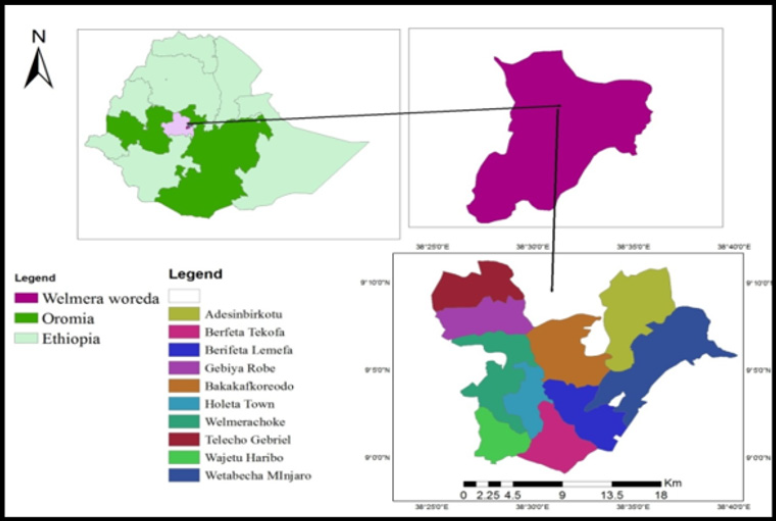
The study was carried out in Walmera District of West Shoa Zone of Oromia, which is located 30km to the west along the main road to Ambo. Geographically, the district is found 9o 0’ 0’’-9o 10’ 0’ N latitude and 38o 25’ 0’’- 38o 30’ 0’’ E longitudes. The study area has an altitude of 2400m. asl and receives an average annual rainfall of about 1000mm.The mean minimum and maximum temperatures are 6 and 22 oC, respectively [3]. The mean relative humidity is 59%. The study area obtains short rainy season (March to May), long rainy season (June to September) and dry season (October to February) [4]. The total human population of the district is 104,932 and cattle are the dominant livestock of the smallholder farmer in the area, although limited number of small ruminants and equines are kept [3]. Animals largely depend on natural grazing, which were supplemented with crop residues late in the dry season.

Research Design

Dairy cows raised under small scale production systems in the selected study sites constitute the study population. Cross-sectional type of study was conducted to collect data required for this study from 2016 to 2017 using questionnaire survey, observation and group discussion. The sampling units were defined as households keeping dairy cows.

Sampling Techniques and Sample size

Prior to conducting field survey research, discussion was conducted with the head of Walmera district livestock and fishery resource development office and dairy expert to select sites and respondents. Eleven target kebeles: two from urban area and nine kebeles from rural area were selected purposively based on the number of dairy cows that farmers own, availability of model farmers and ease of access. Sample of respondents from each selected kebeles were selected randomly using stratified random sampling technique. The numbers of respondents in each kebele was selected using proportional to size sampling approach. The sample size to collect data for this research was determined by using [5] formula:

Lupinepublishers-openaccess-Agriculture

Where;

n = designates the sample size of the researcher uses;

N = designates total number of households in eleven kebeles.

N = designates total number of households in eleven kebeles.

1= designates the probability of the event occurring.

During the study period, about 300 households in the randomly selected kebeles own dairy cows of any breeds and size.

Thus, which is the determined sample size for the study.
Methods of Data Collection and Analysis

Both primary and secondary data sources were used for this study. Primary data were collected from respondents by pre-tested semi-structured questionnaire, key informants’ interviews, focus group discussion and personal observation. Whereas, the secondary data were collected from various sources such as agricultural office, published and unpublished materials and CSA reports. The collected data from different sources were coded and recorded using Microsoft Excel spreadsheet 2007. Descriptive statistics such as frequency and percentage were used to analyze the quantitative data using SPPS version 23 software. Then the analyzed data were presented in the form of table and pie chart.

Results and Discussion

Demographic Characteristics of the Respondents

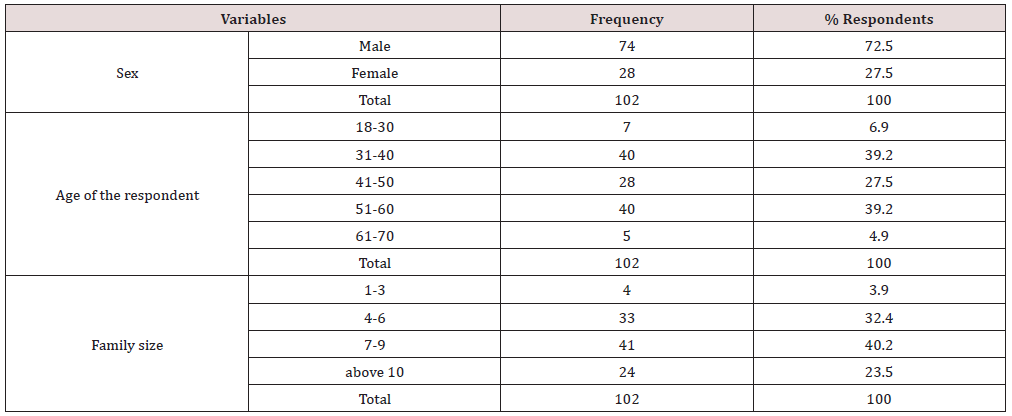
Sex, Age and Family Size: Majority of the respondents in the study area were male (72.5%) and the rest 27.5% were females (Table 1). The highest proportion of the respondents age were ranging from 31-40 years old which accounts about 39.2%, and the second highest proportion age was ranging from 41- 50 years old that accounts 27.5%. Thus, the study area had relatively better potential of economically active population who could participate in dairy cattle production. Majority of the respondents (40.2%) had the family size of 7-9 members and about 23.5% had family size more than 10 (Table 1). From this result, it clearly could elucidate that household with more family members tended to have more labor and to adopt dairy technology than household with less family members which in turn increased milk production and then milk market participation of the households.

Table 1: Respondent sex, age group and family size in study area.

Lupinepublishers-openaccess-Agriculture

Education Status and Source of Labor

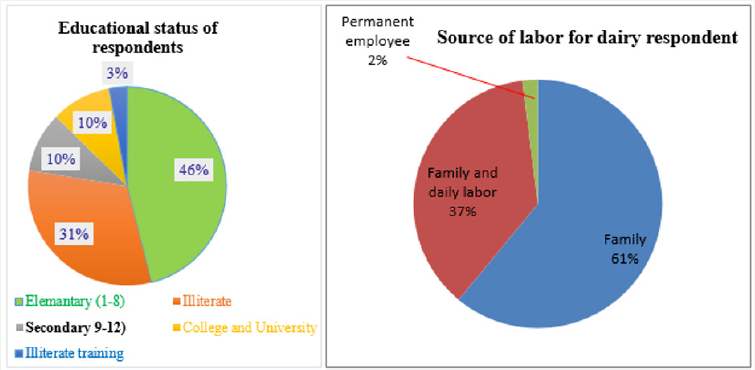
Literacy wise, nearly half of the respondents (46.1%) were attended elementary education (1-8 grade), whereas 31.4% illiterate and unable to read and write. Out of the total respondents, only 9.8% respondents had secondary education (Figure1). Education affects the production and management of improved dairy cows; most importantly improved dairy cows breed needs high management and husbandry practices. Majority of the respondents who have crossbred dairy cows were educated from elementary up to university and have training on dairy production. Like the current result, according to [6], education levels of household heads have impacts on potential of milk production. Therefore, uneducated farmers are challenge for adoption of new technology in the development of dairy sector such as uses of AI for breeding and synchronization. The majority of the labor source of the respondents were own family labor (60.7%), 37.3% own family and daily labor, and only 2% were permanent employee (Figure 2). The reason may to use money paid for labor and proper farm management. This was an indication that dairy cattle management requires the attention of family members since they have high value. In line with the current result, [7] reported the same result.

Figure 1: Map of the study area.

Lupinepublishers-openaccess-Agriculture

Figure 2: Educational status and source of labor of respondents for dairy in study.

Lupinepublishers-openaccess-Agriculture

General Dairy Husbandry Practices

Table 2: Source of cattle for herd establishment in the study area.

Lupinepublishers-openaccess-Agriculture

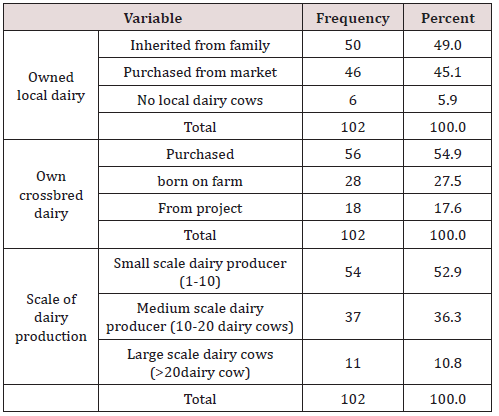
Source of cattle for herd establishment: Majority of respondents reported that first herd establishment was made using the herd of local dairy cow inherited from family and purchased from market (Table 2). The percentage of local dairy cows inherited from family was high because of dairy cows have many roles in the socio-cultural values, like marriage and in solving disagreements. However, more of the respondents owned first crossbred dairy cattle that were purchased from market (55.9%), born on farm (27.5%) and from project (16.7%). Educated farmer in study area were rearing upgraded and improved dairy cows that give high milk yield. According to the Ethiopian Standard Authority, the scale of dairy production has been set to cluster dairy producers in Ethiopia into small scale dairy producer (1-10 dairy cows) (52.9%), medium scale dairy producer (11 to 20 dairy cows) (36.3%) and large-scale dairy producer (>20 dairy cows) (10.8%) were dairy producer respondent interviewed.

Dairy Cows Breed Preference

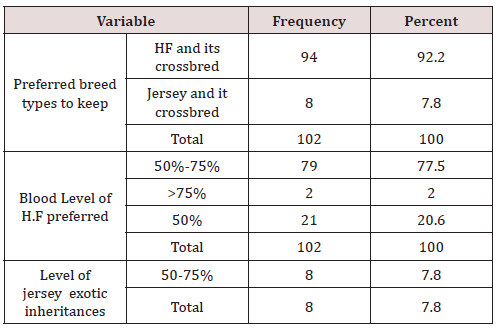
In the study area, almost all of the respondents (92.2%) preferred to keep Holstein Friesian and their cross due to their high milk production and fast growth. Whereas, 7.8% of the respondents prefer Jersey and their cross because of their higher butter yield and small body size (Table 3). In contrast, according to Sheki [13], there was no significance difference in the preference of dairy animals across Sinana by farmers. On the other hand, cattle keepers in Ethiopia prefer to select their herd based on marketable traits such as milk yield, growth rate and reproductive performances of the heifers/cows, steers/bulls. However, traits such as coat color and adaptability traditionally taken into account when selecting the dairy cattle [14] in western Oromia.

Table 3: Selection of exotic breed type and level exotic blood inheritances in the study area.

Lupinepublishers-openaccess-Agriculture

Majority of the respondent (77.5%) prefer 50-75% HF crossbred blood level (exotic blood inheritance), 20.6% prefer 50% HF crossbred and 2% prefer more than 75%HF. A similar finding was reported by Goshu [8] Chefa farm. The author concluded that Friesian blood levels in Ethiopian dairy cattle should stabilized at a maximum of 75%. In addition, in the study area for jersey breed all of the respondents prefer to keep 50-75% blood level of jersey. Almost all of the farmer in the study area have 50% exotic crossbred dairy cows (kilisi) (Dikala faranji) and above 50% (Hori Faranji). Additionally, in the study area, majority of the farmer practiced natural mating using bull with 75% exotic blood level for cross dairy cow (heifer blood level 50%) then the next generation of heifer F2 will be above 50% exotic blood inheritance. As the focus group discussion, KII, field observation and some document from Walmera district of Livestock Development and Fishery office indicated the bull used for natural mating were HF 75% and above exotic blood level. Most of the respondents managed high exotic blood level inheritance dairy cows (50%-75%) were more productive. Due to majority (68.6%) of the respondents were educated at list from short term training up to higher level and they were experienced on dairy production managing skill, knowledge, breeding methods, feeding practice, watering frequency, housing and health care practice for upgrades.

Breeding Methods, Types and Source of Bull

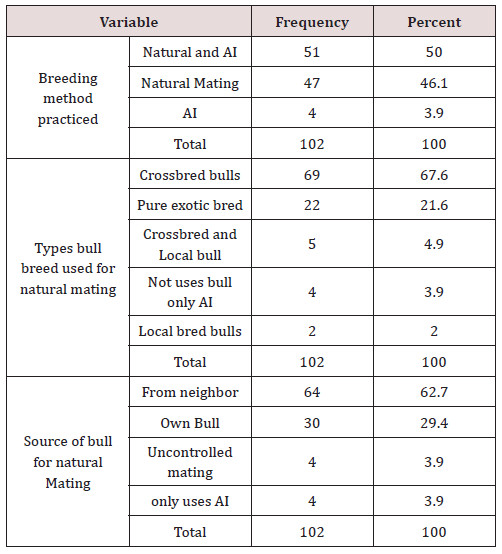
Table 4: Breeding method, types of bull and source of bull used for breeding in the study area.

Lupinepublishers-openaccess-Agriculture

Two types of breeding method, natural mating and AI were mainly practiced in the study area. Bulls used for two main types of natural mating either for uncontrolled mating (free mating) or controlled mating. In uncontrolled mating, the bull carries out heat detection and cows in heat were mated during each heat period. In controlled mating systems, the farmers carry out heat detection and timing of service, and each cow mated once or twice during each heat period. In addition, for AI the farmers carry out heat detection and timing of service and each cow inseminated once or twice during each heat period. Most of the farmers in the study area bred their dairy cows using natural mating and AI (50%), natural mating (46.1%) and only AI (3.9%) (Table 4). In contrast to this, Blen [9] reported dairy producers bred their animals using artificial insemination (89.0%) and few use natural method (bull) (11.0%) in Bishoftu. Besides, dairy producers were used crossbred bull (68.6%), pure exotic (21.5%), crossbred and local bull (4.9%), only AI service (3.9%) and local bull breed (2%) for breeding. The source of bulls was from neighbors (62.7%), uses own bull (29.4%), and uncontrolled mating (3.9%) (Table 5).

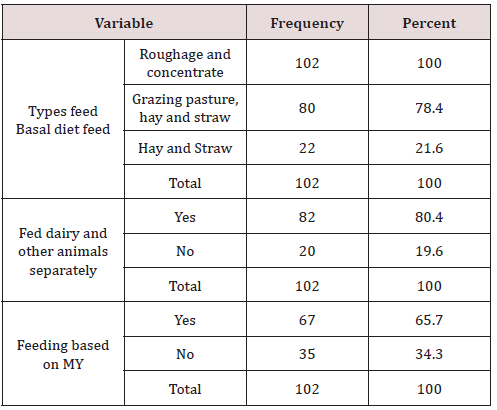
Table 5: Types of feeds and feeding practice of dairy cows in the study area.

Lupinepublishers-openaccess-Agriculture

MY=Milk Yield

Breeding Method Preference, Ai Service Provision and Accessibility in Study Area

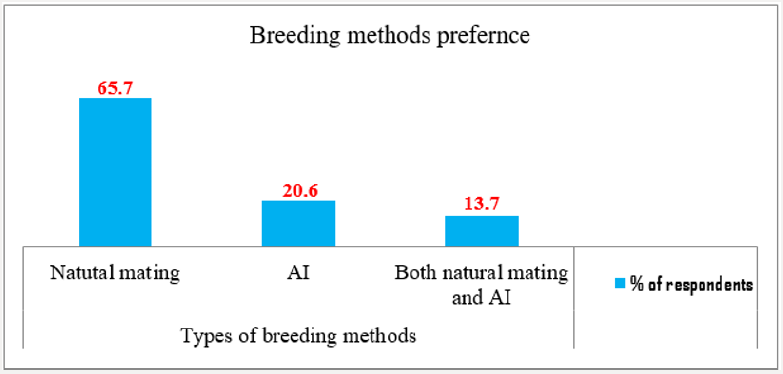
On-farm breeding methods preferred by small scale dairy producers in the study area were depicted in (Figure 3). Even if, AI offers several advantages over the natural service, it was not found to be as effective and efficient as that of natural mating. AI is a means of genetic improvement, cost effectiveness, disease control, safety breeding, flexibility, and fertility management [7]. However, AI includes poor conception rate due to poor heat detection and inefficiency of AI technicians, dissemination of reproductive diseases and poor fertility rates, if AI centers are not equipped with appropriate inputs and are not well managed [8]. In the study area, due to similar reason most of the respondents prefer natural mating. All the respondents repeatedly told that most of the AI service provided by the government technician was not easily accessible for the farmers. In the current study, only 24.5% of the respondents had easy access to AI service and the rest did not have easy access to AI service; hence government should design strategies to address the interest of the farmers [10].

Figure 3: Breeding methods preference by dairy producers in the study area.

Lupinepublishers-openaccess-Agriculture

Animal Feeds and Feeding Practice

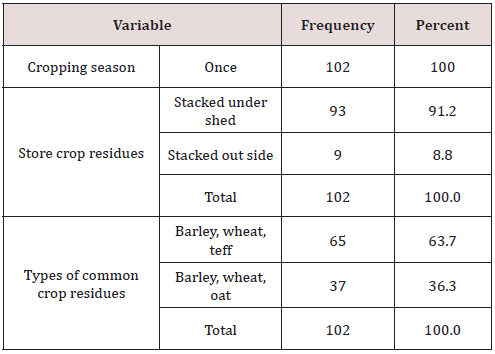
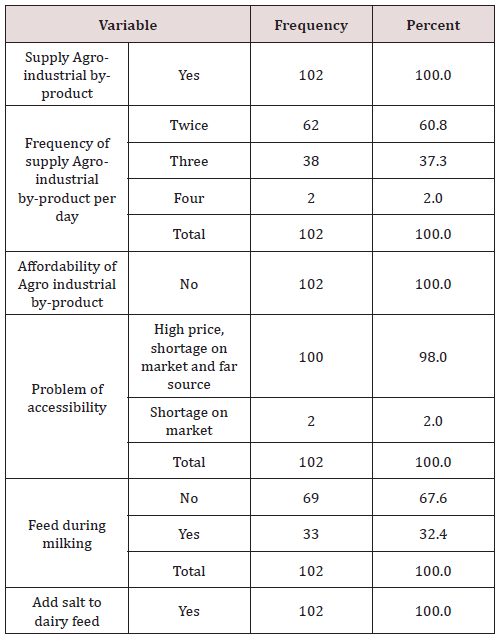
All of respondents feed their cows both roughage and agroindustrial by-products (concentrate) (Table 6). The respondents feed roughage like grazing pasture, hay and straw (78.4%) as basal diet for dairy cows. Similar finding was reported by Mustefa [11] in Sululta and Walmera districts. The major feed resources identified were native pasture, crop residues, agro- industrial by-products; few fodder crops (oats and vetch mixture). Majority of respondents in the study area fed their dairy and other animals separately (80.4%) and 19.6% of them fed all animal together. Feeding of dairy cows based on the milk yield and separately practiced by 65.7% of the respondents, while the rest were not feeding their dairy cows based on their milk yield.

Table 6: Grazing land status and establishment of improved animal forage in study area.

Lupinepublishers-openaccess-Agriculture

CCS= Cut and Carrying system.

Grazing Land and Establishment of Improved Animal Forage

In the present study, grazing land was decreased from year to year in the study areas. However, 63.7% of the farmers did not have experience to establish improved forage but only 36.3% had grown improved forage (Table 7). Majority of the respondents who had experience to grow improved forage, they utilize the forage through grazing the animal directly along with cut and carry system (21.6%) and cut and carrying system alone (14.7%).

Table 7: Cropping season, way of storing and the common crop residues in study area.

Lupinepublishers-openaccess-Agriculture

CCS= Cut and Carrying system.

Common Types of Crop Residues and Way of Storing

There was only one cropping season in study area and then the crop residues produced only once year. Almost all of the respondents (91.2%) in the study area properly store crop residues under shade while the few (8.8%) stored outside without shade (Table 8). The most common type of crop residues used for animal feed in the study area were barley, wheat and teff straw (63.7%), and barley, wheat and oat straws (36.3%). According to Mohammed [12] in Jimma Zone, crop residues were the second feed resources for livestock followed by wild browse/fodder trees and shrubs, crop thinning, weeds, and non-conventional feeds including household left over.

Table 8: Supply agro-industrial by product, feed during milking and add salt in the study area.

Lupinepublishers-openaccess-Agriculture

CCS= Cut and Carrying system.

Feeding Agro-Industrial by Products

As the survey result indicated in study area, all the respondents supply agro- industrial by-products for their animals (Table 9). Even if, there was no accessibility of agro-industrial by-products because of high price, shortage of supply and far distance from the source agro-industrial center, 98% of respondents were supplementing their dairy animals with agro-industrial by-products and only 2% of respondent had reported unavailability of agro-industrial byproducts in the market. In contrast to Mohammed [12] reported for Jimma zone, none of the household use agro-industrial by products as a potential concentrate for livestock feeds. About 88.15% of the respondent households reported high cost of agro-industrial byproducts as the main limiting factors not to use it as livestock feeds while lack of awareness on use of agro-industrial by-products as livestock feed was reported by 5.93% of the respondents. About 5.93% of the households reported that all agro-industrial byproducts were produced in a distant area. In study area, most of the respondents (60.8%) supply agro- industrial by product twice per day, 37.3% of the respondents supply three times per day, and 2% of them were supply four times day. In the study area, almost all of the respondents also provide table salt and bole (Amole) as minerals supplement. Similarly, Sheki [13] reported the findings in Sinana district of Bale zone.

Table 9: Respondent Health Care practice, Vaccinate, Deworm and Spray in the study area.

Lupinepublishers-openaccess-Agriculture

CCS= Cut and Carrying system.

Source of Water and Frequency of Watering Dairy Cows

In the study area, the sources of drinking water and frequency of watering were depicted in Figure 4. During the dry season 16.7% of farmers were get water from well. From the result, in the study area, it could understand that there was no problem of drinking water.

Health Care Practice

In the study area most, common nutritional related disease occur was bloating (44.1%) that the respondent facing on the farm, emaciation and bloating (29.4%), emaciation (9.8%), milk fiver and bloating (9.8%), milk fiver (3.9%) and 2.9% of the respondents reported that they were not face any nutrition related disease (Table 10). All of the respondents in the study area were vaccinate their animals for different types of disease. About 83.3% of the respondents vaccinate their animal for disease like CBPP, FMD, Pasteurellosis and black leg, and about 10.8% for black leg, anthrax and FMD and about 5.9% FMD. Almost all of the respondents dewarm their animal (98%) and the remaining 2% were not de-warm and those spray their animals were 48%. Most of the respondent spray their animal during prevalence of external parasites (90.2%) and 9.8% of the respondent practice spraying twice a year in the April and May. This health control practices in the study areas could contribute for effective dairy production. Market oriented smallholder dairy farms have access to veterinary services due to the income they get from the sale of milk that enable them to cover veterinary costs.

Figure 4: Source of water and frequency of watering dairy cows per day.

Lupinepublishers-openaccess-Agriculture

Table 10: Type of house and house comfort for dairy cows in Walmera district.

Lupinepublishers-openaccess-Agriculture

CCS= Cut and Carrying system.

Housing System

In the study area, all of the respondents house their animal in different types of houses. About 43.1% of the respondents were used modern barn type constructed from local material without individual cattle pen, 24.5% modern barn with individual cattle pen, 18.6% traditional barn with partition and 13.7% traditional barn (free stall). Similar results were reported by Mustefa [11] in Sululta and Walmera districts. Currently the types of roof the respondents in Walmera district had rain proof corrugated iron (66.7%), rain proof by local material covered (31.4%) and (2%) not rain proof barn. The floor types were built by stone (40.2%), concert (32.6%) and earthen floor (21.6%). This showed that there were many improvements in the dairy production system in the district [14].

Conclusion and Recommendation

It could be concluded from the study that in the study area on-farm dairy cattle husbandry practiced by dairy producers are encouraging for future dairy development as a whole with minor improvement on breeding strategies, identifying types of feeds along with types of dairy cows to be fed, and deep awareness and training on most nutritional related diseases. Therefore, appropriate intervention in nutritional related diseases and prevention activities, breed improvement strategies, deep and regular training on basic principle of animal feeds and feeding are highly recommended so as to improve sustain productivity of dairy cows and being benefited from the existing market and high demand of products.

Read More Lupine Publishers Agriculture Journal Article: