Friday, 30 April 2021

Lupine Publishers| How to Become a Manufacturing Cell Fully-Automated Without Robots: Case-Study in the Automotive Components Industry

 Lupine Publishers| Advances in Robotics & Mechanical Engineering (ARME)


Abstract

Productivity is a key factor for companies manufacturing parts and sets to the automotive industry. Automation plays an important role in this matter, allowing development of entire manufacturing cells without the direct need of workers. Even in countries where the labour cost is relatively low, it becomes necessary to improve the level of automation applied to manufacture cells and reduce the dependence of the human labour unpredictability, also increasing the quality and reducing the costs. This case study was developed based on an industrial request in order to improve a semi-automatic cell devoted to seat suspension mat manufacturing. The original cell allows several automatic operations but it needs two workers for two specific operations not considered in the initial design. Thus, new concepts of wire feeding and manipulation were developed in order to allow a better material flow throughout the cell. The new cell was designed and built with success, allowing obtain a fully-automated system, which leads to a better productivity and reliability of the manufacturing process.

Keywords: Fully-Automated Cells; Labour Reduction; Automation Without Robots; Seat Suspension-Mat; Automotive Industry; Mechanical Engineering

Introduction

The competitiveness that is inherent in the automotive industry has and always had a dynamic behaviour. However, there has been, over the last century, the adoption of different strategies, from craft production to mass production of Henry Ford, through the brand policy and the variety of Sloan products, the lean production (lean manufacturing) and more recently to build-to-order initiatives. These changes are not only common to the major producers of vehicles, but were also observed in luxury car producers, seen as artisan producers [1]. The car mass production was a strategy adopted in the automotive industry and started with Henry Ford, founder of “Fordism”, a working model that boiled down to mass produce cars at low cost [2,3]. Today’s consumer wants to influence and participate in the product design, which led to a new paradigm of production strategy. Therefore, at its early stages, the automotive industry had in the market unique models that had a small variety of features, such as the Ford T and Volkswagen Beetle, but in nowadays manufacturing, organizations must be flexible and be able to comprise a long product variety to remain competitive [4]. Indeed, companies must be able to adapt to the market constant changes [5,6].

The value chain related to the automotive industry presents a high degree of complexity [7,8]. A typical supply chain includes car manufacturer (OEM’s–Original Equipment Manufacturers), final components or subassemblies suppliers (Tier 1, 2 and 3), distributors, retailers and customers. The OEM’s are constantly looking for suppliers to whom they can delegate responsibilities in areas such development, sourcing and planning, and this constant search induces pressures in the suppliers to lower prices and make deliveries within the stipulated deadlines, without compromising the products quality assurance. Indeed, quality and delivery time are indicators that highly affect the evaluation of the preferred product supplier [7,9]. In the specific case of the car seat, the evolution from mass to a personalized production, according to customer needs can also be applied. Following the evolution of automobile production, the seat was traditionally produced as an integral part of the automobile, where the available possible configurations were limited or null. With the increasing requirements of customers, this behaviour has changed along the times. With these new realities, the seat became an important element, with different configurations and new component options. The driver can now benefit from a seat with more comfort, extra features or have the possibility of seat heating. Once again, companies must follow the trend of the product variety.

This variety of products can affect the delivery time, which plays an important role in competitiveness. The delivery time can be compromised if a product is standardized or customized, with a shorter time delivery for the first case and longer for the second. Companies thus have the option to choose to reduce the delivery time, engaging in standard products, but companies with customized products must be able to meet the delivery time by means of increased flexibility for customized products [10]. An example to optimize the delivery time was presented in the paint line of the Toyota Motor Manufacturing’s Georgetown plant, where an electronic signal is sent to seat supplier within the information of the customized seat of the car that is present in the assembly line. The seat supplier should manufacture and deliver the seat exactly where it is installed at the Toyota assembly line [11].

A number of industries have been found to be clearly capitalintensive and a number of others clearly labour-intensive [12]. In the last thirty years, many companies located in industrialized countries have been centralized their efforts by upgrading the technological level of their production lines to keep in competition with countries where the production costs are lower, due to low labour costs (non-industrialized countries). This resulted in companies in industrialized countries to migrate from the labour to the capital-intensive model [13]. In some way, a company can be rated in accordance with the amount of capital or labour. If, in one hand, a company with a capital-intensive model has high levels of automation in detriment of hand labour, on the other hand, a labour intensive model usually uses a high amount of hand labour [14].

The automotive industry is not an exception of this classification model and neither of this behaviour. Although the automotive sector involves a high number of hand labour operations [15], and at the same time high automation rates, some companies in less developed countries, is fairly automated and use an intensive hand labour to decrease production costs, although in the industrialized world the manufacturing companies use highly automated and robotized systems. Thus, in general, the automotive sector adopts a capital-intensive model, due to the constant seek for an automated production process. Furthermore, manual assembly lines usually congregate in a complex number of relationships often difficult to study and understand [16,17].

As described before, the customer is an important player in the value chain, and wants his requirements fulfilled. As a consequence, the companies must be in constant changes due to market variations, and to adopt new processes and production technologies using mainly automation [18,19]. Independently of the technologies involved in this process, must of the times companies use automation and robotics systems to increase their competitiveness and productivity, ensuring as well as high levels of quality and repeatability [20]. Automation and robotics, apart from playing an important role in ergonomic problems [21], also help companies to increase productivity and flexibility, despite of some conflicts between these features. Indeed, production and assembly line with high levels of productivity tend to be dedicated and not a flexible system. The automotive industry is endowed with very similar products that can be assembled in the same production line with minor adjustments they adapt their lines. With automation a company is able to reduce the setup time, increase the productivity, improve assembly accuracy, and reduce the human operations [22].

Case Study

Scope

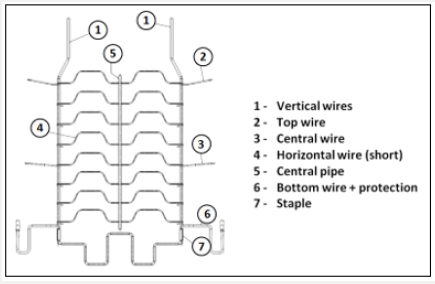
Figure 1: Suspension mat-main components.

Lupinepublishers-openaccess-robotics-mechanical-engineering-journal

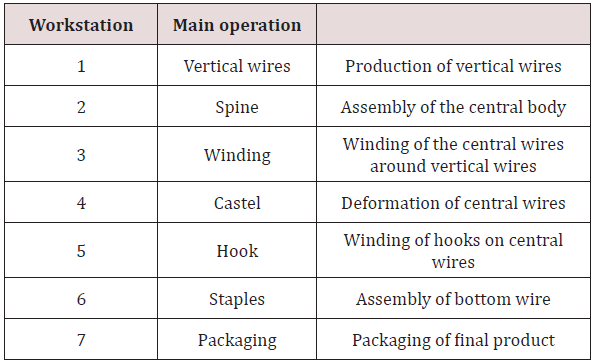
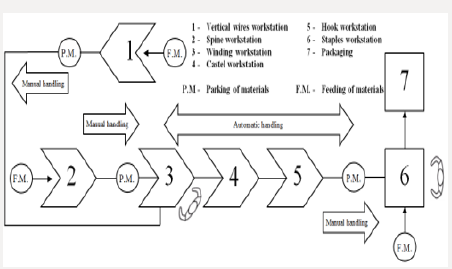
Among various elements that comprise the car configuration, the seat is seen as a key element in the safety and comfort of the driver and remaining passengers. The seat is the element that connects the occupants to the vehicle and plays a key role in security in the event of an accident or sudden manoeuvres, keeping the driver attached to the vehicle frame [23]. This case study was performed on a production line that manufactures a specific component for car seats. The company where the line is installed is dedicated to the production of automobile systems and components. The line is responsible for the manufacturing and assembly of one of several products of the same family, the “Suspension Mat”. Suspension mat is composed by several components obtained by spring steel wire, which vary their geometry and size (Figure 1). Suspension mat support foams either the seat or backrest and is a component that gives the desirable flexibility to the car seat, being as well an element that helps the vibrations absorption from the vehicle structure to the occupants. These features work together aiming to increase the comfort. A brief introduction to the main operations present in the product original process is made in Table 1. Therefore, in order to understand the configuration of the original suspension mat production line, a process layout is presented in Figure 2. A brief overview of process layout is made

Table 1: Main operations of suspension line production line.

Lupinepublishers-openaccess-robotics-mechanical-engineering-journal

Figure 2: Initial process layout of the suspension mat production line.

Lupinepublishers-openaccess-robotics-mechanical-engineering-journal

a) Seven workstations - two of them require human labour to accomplish the final operations (winding and staples workstations), the others five workstations are fully automated.

b) Handling operations - manual handling between several workstations (vertical wires and winding workstation; spine and winding workstation; hook and staples workstation), automatic handling between the winding, castle and hook workstations

Regarding the initial scenario, the suspension mat production line has an inefficient configuration. If, on one hand, the spine and vertical workstation are located in a less favourable area, on the other hand, the cycle time highly varies due to the manual operations (assembly and handling). Apart from this, the layout line configuration is inappropriate to the flow of the suspension mat assembly as well. Although the line has automatic operations, it requires, besides manual handling and assembly between some workstations to complete components, feeding operations of raw materials. Due to these facts, the suspension mat assembly cycle time has an irregular behaviour that affect the process flow. The continuous intervention of manual operations consolidates the assumption: the line is semi-automatic and must be upgraded to a fully automatic line. Indeed, at the original stage, the line has a certain degree of automation that requires a compromise between manual and automatic operations.

The Problem

Companies adopt strategies to raise their production rates while reducing the costs. One of the ways to perform that is to reduce labour costs, especially whose who have repetitive tasks. Unlike the general opinion, cost reduction with employees does not mean the dismissal of the worker, but somehow a growth possibility for the worker, assuming new tasks with higher added-value through adequate formation plans. A lot of advantages are available both for the company and worker.

In order to increase the production rate a strategy for this line migration, which can be defined as semi-automatic, to a fully automated line, was made. At the same time, a zero worker dependency and a standardization of the cycle time should be achieved, in order to reduce the cycle time of product assembly. The implementation of automatic systems where manual intervention exists to complete some tasks is proposed to perform this optimization. Manual feeding of components and the packaging of the final product do not make part of the proposed migration process. To perform the migration process to a fully automated line, it was imperative to execute a survey around the main requirements. As a result of this analysis, several requirements were accounted for. Despite the identification of many detailed requirements, only the main ones were listed:

a) Automatic handling of the vertical wires to the winding station;

b) Automatic handling of the spine to the winding station;

c) Automatic handling of the spine after the previous workstation (hook workstation);

d) Automatic feeding and handling of the lower wire;

e) Final station / Automatic transfer between all stations.

Solutions

To meet all requirements mentioned before, a strategy was defined for the optimization to be possible. As said before, the line is characterized by having two workers that complete the unfinished tasks of the line and, thus, the design strategy focused on the respective stations. Therefore, the optimization process was divided in two different moments: one in the winding workstation, where the first worker is located and at the staples workstation, where the second worker operates.

Phase 1-Winding Workstation

At this station, the worker assembles two components: the vertical wires (vertical workstation) and the central spine (spine workstation). The handling of the two components is also performed by the worker.

Before these two phases and leading to support the manual handling elimination between some workstations, a new layout was set. The spine and vertical wires workstation, which was located outside of the suspension mat assembly process flow is now in a position to improve concepts for handling the components without manual operations.

a) Vertical Wires Automatic Handling to the Winding Station

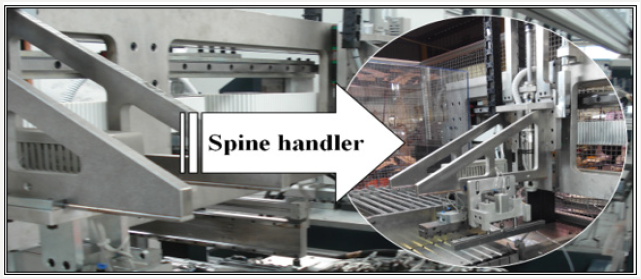
A handler was designed between the spine and the winding workstation, aiming to copy the manual handling movements of the suspension mat spine performed by the worker. Indeed, all systems and concepts idealized in the production line to help the optimization of a fully automated line were applied to replicate the same operations performed by the worker. To proceed with the idealized handler concept, it was necessary a study about the best movement sequence between workstations. Special care has been taken to avoid collisions. If in one hand the handler must fulfil the movement sequence, on the other hand it cannot compromise the workstations operation. To complete the task, the handler was assembled in the existing transfer which, in this stage, transfers the product to one more workstation (Figure 3). It is important to remember that, at the beginning, this transfer only carried out the handling between three workstations.

Figure 3: Spine handler assembled in transfer - handler was implemented in the main transfer in order to simplify the number of movements.
Lupinepublishers-openaccess-robotics-mechanical-engineering-journal

b) Spine Automatic Handling to the Winding Station

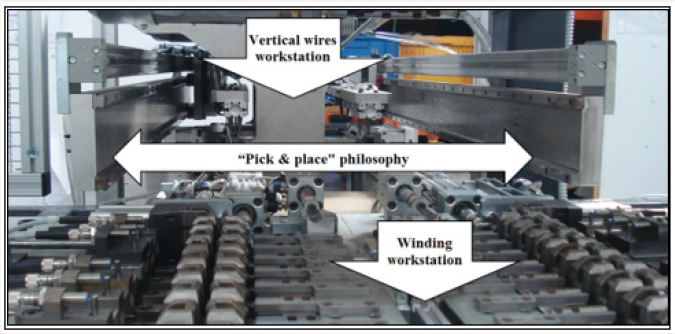
Similar attention in handling the vertical wires to the winding workstation was taken. A simple handling system was considered, which follows a “pick & place” philosophy. This system executes a movement at the same alignment and only has to transport the wire from one location to another. A study was carried out to make the alignment possible and to avoid collisions, aiming to keep the system as simple as possible. Changes in the vertical wires workstation had to be made because the position of the vertical wire is not equal between the two workstations, so this difference could comprise the “pick & place” philosophy. Changes in the workstation and the automatic handling system of the vertical wires were successfully implemented (Figure 4).

Figure 4: Implemented “Pick & place” philosophy - it was possible to develop a compact system to connect two workstations with this philosophy (vertical wires and winding workstations).
Lupinepublishers-openaccess-robotics-mechanical-engineering-journal

Phase 2-Staples Workstation

After the conclusion of the first phase, attention was focused on the second phase. The worker assembles two components in this workstation: the subassembly of the suspension mat arriving from the hook workstation and the lower wire. As in the first phase the manual operations carried out by the worker were studied to complete the migration to a fully automated line.

a) Automatic Handling of the Spine after the Previous Workstation (Hook Workstation)

The communication between the hook and staples workstations was studied in detail. The existing space between the two workstations was eliminated, and an optimized layout was achieved with the removal of this useless area in the line. The staples workstation was moved closer to the hook workstation, and the handling is now made by the main transfer.

b) Automatic Feeding and Handling of the Lower Wire

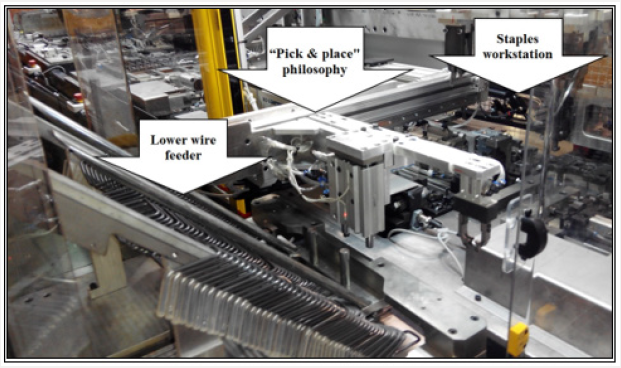
At this point, the necessary conditions for the automatic feeding and handling of the lower wire were created. The idealized structure to allocate and feed the lower wire to the line allows the continuity of the line as long as possible. The feeding control is assumed by a system that only provides one lower wire when it is requested. To take the lower wire outside of the feeder area, a table was created below the feeder, which creates the proposed conditions, receiving and moving the lower wire with a linear motion, waiting for its removal. To perform the removal and the transport of the lower wire between the feeder and the final position at the workstation, a handler was idealized. Once again, a “pick & place” philosophy was adopted, which is the simplest and fastest solution to perform this operation (Figure 5).

Figure 5: Communication system between workstations - once again “Pick & place” philosophy was adopted.
Lupinepublishers-openaccess-robotics-mechanical-engineering-journal

At the same time, and to complete the implementation of the lower wire feeding, it was necessary to define the best position for the feeder and handler set. As in the vertical wire workstation, the feeding of the lower wire is perpendicular to the process flow of the suspension mat, hereupon the only decision to be made was to move the feeder and handler to the front or to the back of staples workstation. Trying to avoid collisions with a pair of automatic staplers existing in the station, and to keep the system as simple as possible, the feeder and handler set was placed at the front of the workstation.

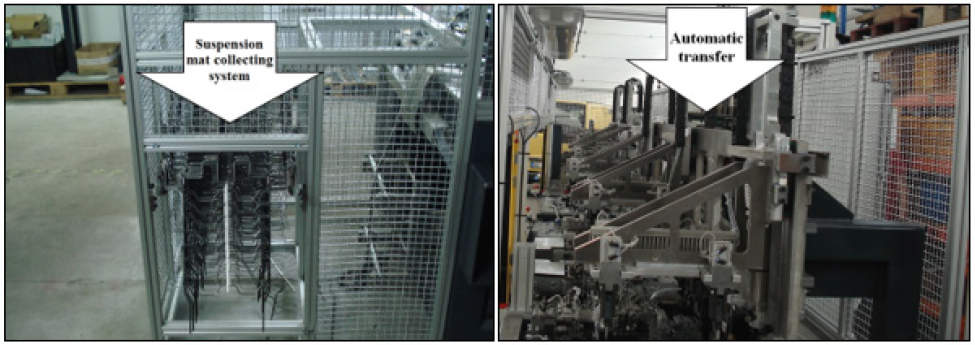
Figure 6: Applied concepts in the final station: a) Suspension mat collecting system at the final workstation; b) Automatic transfer between workstations.
Lupinepublishers-openaccess-robotics-mechanical-engineering-journal

c) Final Station / Automatic Transfer Between All Stations

At the final of the suspension mat assembly, necessary conditions to remove the final set were created. After the staples workstation, a new station was implanted aiming to receive and collect a number of final suspension mat (Figure 6). In order to avoid mechanical or pneumatic support and using only gravity to move the suspension mat, a simple structure was designed. To handle the complete suspension mat to the final station a handler was used as the existing ones in the transfer. The transfer is now able to handle the suspension mat between all workstations. Indeed, the line was successfully migrated to a fully-automated line with the idealized solutions.

Conclusion

The idealized concepts described in the case study have been useful to achieve the proposed goals and helped the complete migration for a fully-automatic line. The proposed solutions were based on careful studies on the worker movements, especially in the handling operations. At the same time, the studies executed before the improvements of the final solutions avoid situations like collisions that could compromise the project implementation. Besides the automation be an area with relative complexity, it was possible to prove that with simple concepts it is possible to solve problems that originally seemed complicated. Indeed, was possible to improve the level of automation and increased the productivity of the line using low cost and simple solutions. The cost/benefit ratio of the solutions is quite important for the final decision. With the replacement of the manual operations by simple and automatic systems, it was possible to transform an inadequate behaviour on the flow process registered in the initial production line scenario in a stable and fluid process, eliminating, among others, possible stops due to lack of materials.

As every automatic migration process, a strategy must be chosen and one of the key points that are questioned is the elimination of the human resources. The elimination of manual stations and the replacement of manual by automatic operations do not imply the dismissal of the worker from the company. Actually, this is an opportunity for both the workers and the company. The worker assumes new functions with higher value and the company benefits by keeping the worker away from repetitive tasks and movements that could be easily replaced by automatic systems. Regarding the new production system now developed, it is expected an increase in the production rate of about 18%, a completely cut of the human labour costs and an increase in the quality level of around 15%. The payback time was estimated in 21 months, i.e., clearly shorter than the expected lifetime expected of the product (about 60 months for this model).

Read More Lupine Publishers Advances in Robotics & Mechanical Engineering (ARME) Click on Below Link https://robotics-engineering-lupine-journal.blogspot.com/


Thursday, 29 April 2021

Lupine Publishers| Role of Visco-Supplementation Following Micro- Fracture in Focal Chondral Lesions

 Lupine Publishers| Orthopedics and Sports Medicine Open Access Journal (OSMOAJ)


Abstract

Introduction: Cartilage lesions pose a significant problem to surgeons, at best being replaced by poorer quality fibrocartilage post micro-fracture. Hyaluronic acid has shown to inhibit joint degeneration and reduce joint inflammation. This study wishes to evaluate the outcome of visco-supplementation following micro-fracture.

Material & Method: Twenty one consecutive patients with chondral lesion less than 2 sq cm were treated with micro-fracture and post operatively randomly divide into two groups. One group was supplemented with intra-articular hyaluronic acid at 3 weeks post surgery. The patients were followed up at 3, 6 & 12 months for WOMAC score and IKDC score.

Results: The WOMAC score and IKDC score in the visco-supplementation group were significantly better than those of the non visco-supplementation group at 6 months (p=0.0001). At 12 months although the scores were significantly better than at 6 months, there was no significant difference between the two groups (WOMAC p=0.86, IKDC p=0.347).

Conclusion: Hyaluronic supplementations following micro-fracture ensure an early improvement in functional scores following micro-fracture. A longer follow up is necessary to evaluate its role in preventing further joint degeneration.

Keywords: Micro-fracture; Visco-supplementation; Hyaluronic acid

Introduction

Athletic injuries often lead to full-thickness chondral defects, which have limited intrinsic healing potential [1,2]. These lesions if not managed adequately predisposes to joint degeneration [2]. Symptomatic lesions are often managed with micro-fracture to attempt cartilage repair [3]. Bleeding from the sub-chondral bone within the defect and subsequent clot formation covers the exposed bone. Also, mesenchymal stem cells that migrate into the clot promote formation of fibrocartilagenous repair tissue [4]. This filling of the defect restores the congruity of the joint leading to symptomatic relief [5]. The viscoelastic property of the synovial fluid is credited to Hyaluronic acid, which is often used in the non operative treatment of early osteo-arthritis [6]. Hyaluronic acid has been shown to inhibit degenerative changes within chondrocytes, reduce synovial inflammation and enhance cartilage proteoglycan content along with inducing chondrogenic differentiation from mesenchymal cells [7,8]. This study aims to compare the functional outcome of micro-fracture with and without visco-supplementation.

Materials and Method

In a prospective level II study, patients with chondral lesions of ICRS grade III-IV measuring less than 2sq cm were managed with micro-fracture and randomly divided into two groups. One group was supplemented with a single shot intra-articular Hyaluronic acid at 3 weeks post surgery in the form of 6ml hylan G-F 20, [9] the other group did not receive any visco-supplementation. Patients more than 45 years of age and having generalised chondral changes were excluded from the study. Multi-ligament injured patients and those with unmanaged single ligament injury or unmanaged meniscus injuries were also excluded from the study. There was no sex restriction. All the patients were put on continuous passive motion from the first post operative day unless they had under gone an associated PCL reconstruction or meniscus repair surgery, in which case PCL and meniscus rehabilitation protocols were followed. The patients were kept non weight bearing for 6 weeks followed by full weight bearing. WOMAC score and IKDC score were evaluated at 3, 6 and 12 months post surgery.

Results

The Visco-supplementation group (Group A) had 9 patients and the group with no supplementation (Group B) had 12 patients. All our patients were between 21-40 years of age (Mean: 29.3 years) with 14 males. Two had associated PCL reconstruction surgery, 17 underwent ACL reconstruction of which five underwent partial medial menisectomy and two partial lateral menisectomy. Five patients underwent a meniscus repair procedure. Eight of group A had grade 3-4 ICRS lesion on the weight bearing area of medial femoral condyle while one had involvement of the lateral femoral condyle. In group B 8 had involvement of the medial femoral condyle. Eight had injured their knee in a game of football, five while dancing, six while playing cricket and another two due to fall on stairs. None were lost to follow up. None of the patients reported any re-injury between the surgery and latest follow up. There were no complication in any of the patients and no one required any additional surgical intervention.

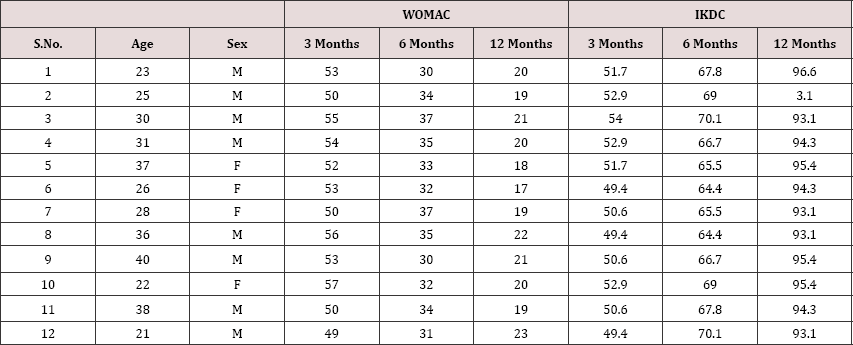
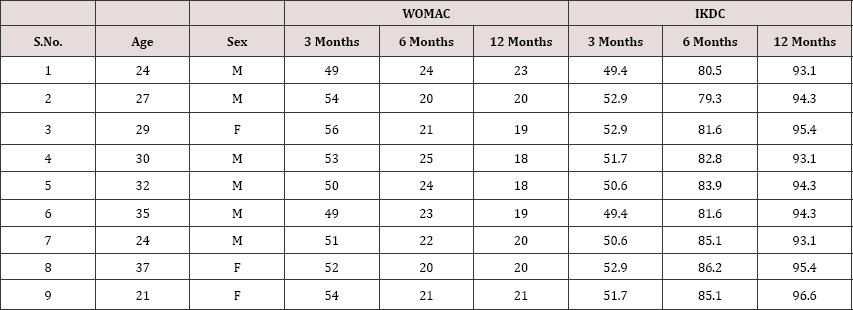
The WOMAC score in group A ranged from 54-49 (mean- 52) at 3 months, which improved to (mean-22.2) at 6 months. The WOMAC score at 12 months showed significant improvement from the 6 month follow up score (p=0.024), however there was no significant difference between group A and B at 12 months (p= 0.86). In group B the WOMAC score at 6 months was better than that at 3 months (P=0.0001) (Table 1). But comparing with group A, group B showed significantly poorer results at 6 months (p=0.0001).

Table 1: WOMAC and IKDC scores of individual patients of group B at 3 months, 6 months and 12 months.

Comparing the IKDC scores, the group A patients showed supplementation however seemed to wane away by 12 months significantly better results compared to group B at 6 months with no significant difference in IKDC scores between the two follow up (p=0.0001) (Table 2). The beneficial effect of visco- groups (p=0.347).

Table 2: WOMAC and IKDC scores of individual patients of group A at 3 months, 6 months and 12 months.

Discussion

Joint degeneration and poor healing potential of chondral lesions pose a challenge to surgeons managing these lesions. Various techniques have been described aiming to fill the defect and obtain a congruent joint. Micro-fracture is one of such procedures in which the sub-chondral bone plate is penetrated to cause fibrin clot formation and later conversion to fibrocartilage [10]. Variable outcomes of micro-fracture have been described in literature with almost 70%-90% of patients showing improvement in function [11]. The durability of the fibrocartilage has however been put to question with mid-term results showing a decline in the functional scores [12,13]. Augmentation of micro-fracture to improve the quality and durability of the repair tissue and ensuring a more hyaline like tissue is the current interest topic of various researchers. Strauss E et al. [10] showed a positive effect of hyaluronic acid supplementation on repair tissue both histologically as well as grossly.

Intra-articular basic fibroblast growth factor when used without hyaluronic acid induces poor repair tissue besides undesirable side effects. hyaluronic acid injection along with basic fibroblast growth factor results in significantly better tissue quality [7]. Hyaluronic acid has been increasingly used in the non-operative management of osteoarthritis [14,15]. Rabbit model studies have demonstrated hyaluronic acid to reduce arthritic changes by inhibiting degenerative changes in chondrocytes and cartilage matrix. It also decreases synovial inflammation and increases proteoglycan contect of cartilage [7]. Hyaluronic acid has also been shown to induce chondrogenic differentiation in mesenchymal stem cells [8].

Tytherleigh-Strong et al. [6]. Demostrated significantly higher aggregate moduli in the visco-supplementation group in an ovine model. Jansen et al showed chondroprotective effect of hyaluronic acid, preventing apoptosis of chondrocytes just adjacent to the lesion [16]. Although there are several animal studies demonstrating beneficial effect of hyaluronic acid in cartilage healing, not much is available on their role in human patients [10].

This study aimed to evaluate the role of visco-supplementation in functional outcome following micro-fracture in focal chondral lesions. The visco-supplemented group fared significantly better than the non-supplemented group at 6 months. The beneficial effect however seemed to wane away by one year with both groups having comparable functional scores and subjective outcomes at 12 months follow up.

Limitations

Our sample size is small as we purposefully selected only lesions which were less than 2sq cm in size. Credibility is added to our study by comparing the outcomes of micro-fracture supplemented with hyaluronic acid with those without. No patients were lost to follow up in this series. We however, do not have any follow up MRI or repeat arthroscopy to ascertain the healing status at the repair site. The follow up is also a short term follow up 1 year. A longer term follow up is needed to assess the long term outcomes of viscosupplementation in preventing joint degeneration.

Conclusion

Supplementing micro-fracture with hyaluronic acid injection ensures quicker return of better functional state. In the longer term however this beneficial effect seems to wane off.


Wednesday, 28 April 2021

Lupine Publishers| Profile of Patients admitted with Hypertension at a Tertiary Level Hospital of Eastern Nepal

 Lupine Publishers| Advancements in Cardiovascular Research (ACR)


Abstract

Hypertension is a global public health issue that affects approximately 1 billion people worldwide in both developed and developing countries. It is also considered as an ‘Iceberg’ disease’ because unknown morbidity far exceeds the known morbidity. High blood pressure (BP) is ranked as the third most important risk factor for at attributable burden of disease in South Asia. With an aim to determine the profile of the hypertensive patients a retrospective cross-sectional study design was used to analyze the medical record of 1311 patients admitted with the primary diagnosis of hypertension at BPKIHS January 2005 to May 2016. The study revealed that majority (82.4%) of the patients was above 40 years of age with the mean age of 57.14 ±17.5. More than half (53.5%) of the patients were male. Almost half (49.4%) of the patients were from Sun sari district. More than 90% of the patients were admitted in medical ward. Majority (90.7%) of the patients were improved at the time of discharge.

Introduction

Hypertension is a global public health issue that affects approximately 1 billion people worldwide in both developed and developing countries [1]. It has also been described as the ‘silent killer’ because initially the disease presents with no apparent symptoms, and hence an individual can have hypertension without realizing it [2]. Hypertension is also considered as an ‘Iceberg’ disease’ because unknown morbidity far exceeds the known morbidity [3]. Hypertension is a widely recognized as a major risk factor for cardiovascular disease such as stroke and myocardial infarction, as well as for chronic kidney diseases and congestive heart failure among men and women. Hypertension accounts for approximately 50% of coronary heart disease and 67% for the cerebrovascular disease burden worldwide [4]. Globally, the overall prevalence of raised blood pressure in adults aged 18 years and over was around 22% in 2014 [5]. The global prevalence of hypertension is currently increasing and is projected to affect in excess of 500 million by 2025. The prevalence of hypertension increases with age in all populations.

It is estimated that hypertension causes 7.5 million deaths worldwide amounting to 12.8% of the total of all annual deaths [6]. High blood pressure (BP) is ranked as the third most important risk factor for attributable burden of disease in South Asia [7]. Even in Nepal, a recent study in rural Kathmandu showed that prevalence of high blood pressure has been increased by three fold in 25 years [8]. According to the latest WHO data published in May 2014 Hypertension deaths in Nepal reached 3,584 or 2.26% of total deaths [9]. The age adjusted death rate is 20.77 per 100,000 of population and ranks Nepal 51st in the world. A study done by Seow LES in Singapore among elderly residential population revealed that the rate of hypertension was associated with older age, lower education, and higher body mass index (BMI).

Objectives

The objective of this study was to determine profile of admitted hypertensive patients in BPKIHS.

Methodology

A retrospective cross sectional study design was used to study the profile of patient admitted with hypertension as primary diagnosis in different wards of BPKIHS. The study involved the analysis of medical records of patients admitted at B.P. Koirala Institute of Health Science from January 2005 to May 2016. Permission was obtained from the concerned authority. Anonymity of the subjects was maintained. The information obtained was kept confidential and used for the study purpose only. Age, sex, residence, duration of stay and outcome were analyzed using SPSS version 16. Data were presented by percentage, mean and standard deviation.

Results

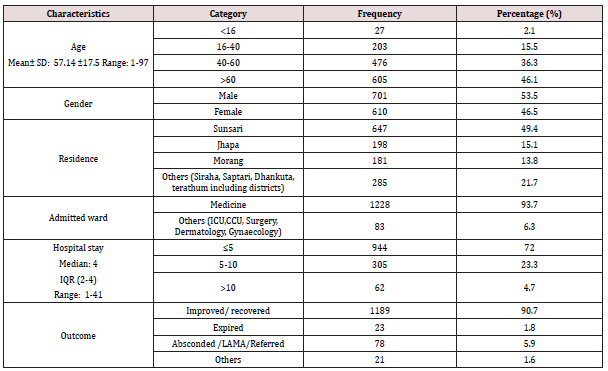
A total of 1311 patients were admitted between from January 2005 to May 2016. Their age ranged from 1 year to 97 years (mean 57.14 years and SD of 17.5 years). More than half (53.5%) of the patients were male. Almost half (49.4%) of the patients were from Sun sari district followed by Jhapa and Morang and other districts. Patient stayed in the hospital for 1 day to even 41days with median duration of stay of 4 days. Of the 1311 admitted patients, majority i.e. 90.7% of the patients improved whereas 1.8% expired in the hospital. The details of findings are depicted in Table 1.

Table 1: Profile of admitted Hypertensive Patients (n=1131).

Discussion

Hypertension is now an epidemic with developing countries being heavily burdened. Over the last 20 years various studies have shown that people in economically developing countries are increasingly having high blood pressure levels with a high prevalence of hypertension. The prevalence of hypertension increases with age in all populations. Out of total 1311 patients in the present study 39.1% of the patients were more than 60 years with the mean age of 57.14 and SD of 17.5 Similar finding was seen in a study done by Humagain S and Koju R [10] among hypertensive patients which showed the mean age of 55.49±1.03 years. More than half i.e 53.5% of the patients in the present study was male. However in a study conducted by Ogunlana Mo et al [11] in south western Nigeria showed the female predominance (56.6% female). As BPKIHS being the only tertiary level health centre of the Sun sari district serving 16 districts of eastern development region almost half of the patients (49.4%) were from Sun sari district. Majority (93.7%) of the patients were admitted in a medical ward. Majority of the patients had the hospital stay of up to 5 days with the median length of stay of 4 days and ranged from 1 to 41 days. At the time of discharge majority i.e. 90.7% of the patients were improved.

Conclusion

Hypertension is a significant clinical problem. From the present study it can be concluded that it is more common in late adulthood and elderly population and male are commonly affected.

Read More Lupine Publishers Advancements in Cardiovascular Research (ACR) Click on Below Link https://lupine-publishers-cardiovascular.blogspot.com/


Tuesday, 27 April 2021

Lupine Publishers| P Value and Statistical Significance

 Lupine Publishers| Current Trends on Biostatistics & Biometrics (CTBB)


Abstract

The practice of reporting P-values is commonplace in applied research. Presenting the result of a test only as the rejection or acceptance of the null hypothesis at a certain level of significance, does not make full use of the information available from the observed value of the test statistic. Rather P-values have been used in the place of hypothesis tests as a means of giving more information about the relationship between the data and the hypothesis. In this brief note we discuss how to obtain P-values with R codes.

Keywords: Hypothesis; Distribution; P-value

Introduction

Very often in practice we are called upon to make decisions about populations on the basis of sample data. In attempting to reach decisions, it is useful to make assumptions or guesses about the populations involved. Such assumptions which may or may not be true, are called statistical hypotheses and in general are statements about the population parameters. The entire procedure of testing of hypothesis that consists of setting up what is called a ’Null hypothesis’ and testing it. R.A. Fisher quotes, ’Every experiment may be said to exist only in order to give the facts about a chance of disproving the null hypothesis’. So, what is this null hypothesis?”. For example, if we consider the measurements on weights of newborn babies, then the observations on these measurements follows Normal distribution is a null hypothesis [1]. Suppose the measurements denoted by a random variable X that is thought to have a normal distribution with mean μ and variance 1, denoted by N(μ,1). The usual types of hypotheses concerning mean μ in which one is interested include H0: μ = μ0 versus H1: μ6= μ0(two-tailed hypothesis) and H0: μ ≤ μ0 versus H1: μ > μ0 and H0: μ ≥ μ0 versus H1: μ < μ0(one-tailed hypothesis). So null hypothesis H0 is a hypothesis which is tested for possible rejection under the assumption that it is true.

In general, a procedure for the problem of testing of significance of a hypothesis is as follows: Given the sample point x = (x1, x2, . . .. ,xn), find a decision ru. le that will lead to a decision [2].

P Value and Statistical Significance

To reject or fail to reject the null hypothesis H0: θ ∈ Θ in favor of the alternative hypothesis H1: θ ∈ Θ1 = Θ-Θ. This decision rule is based on a test statistic whose probability distribution when H0 is true is known, at least approximately. Calculate the value of the test statistic for the available data [3]. If the test statistic is in the extreme of its probability distribution under the null hypothesis, there is evidence that the null hypothesis is rejected. More quantitatively, we calculate from the distribution of the test statistic, the probability P that a deviation would arise by chance as or more extreme than that actually observed, the H0 being true. This value of P is called the significance level achieved from the sample data or P-value. There are several ways to define P-values [4]. It is the probability of observing under H0 a sample outcome at least as extreme as the one observed. One could define P-value as the greatest lower bound on the set of all significance levels α such that we would reject H0 at level α. P-value is a value satisfying 0 ≤ P ≤ 1 for every sample point x. A P-value is valid if Pθ (p ≤ α) ≤ α. For fixed sample data X=x it changes for different hypotheses. Let T(X) be a test statistic such that large values of T give evidence that H1 is true. For each sample point x, P-value is defined as p-value= sup Pθ(T(X) ≥ T(x)). θ∈Θ. Fisher writes: “The value for which P-value= 0.05, or 1 in 20, is 1.96 or nearly 2; it is convenient to take this point as a limit in judging whether a deviation ought to be considered significant or not. Deviations exceeding twice the standard deviation are thus formally regarded as significant”. Thus, for a given α, we reject H0 if P-value ≤ α and do not reject H0 if P-value > α. In the two-tailed case, if the distribution of the test statistic is symmetric, one-tailed P-value is doubled to obtain P-value. If the distribution of the test statistic is not symmetric, the P-value is not well defined in twotailed case, although many authors recommend doubling the onesided P-value.

Examples: Let X1, . . . , Xn be a random sample from a N(μ,σ2) population. If we want to test H0: μ ≤ μ0 versus H1: μ > μ0 when σ unknown, test procedure is to reject H0 for large values of Lupinepublishers-openaccess-Biostatistics-Biometrics-journal which has Student’s t distribution with n-1 degrees of freedom when H0 is true. Thus, the P value for this one-sided test is P-value=P (Tn-1 ≥ T(x)). Again, if we want to test H0: μ = μ0 versus H1: μ6= μ0 then Lupinepublishers-openaccess-Biostatistics-Biometrics-journal and P-value=2P (Tn-1 ≥ T(x)). R codes for obtaining these P-values are ”1-pt(T(x), df)” and ”2*(1- pt(T(x), df))” respectively where df is the degrees of freedom. If we want to test these hypotheses when σ known, test procedure is to reject H0 for large values of Lupinepublishers-openaccess-Biostatistics-Biometrics-journal which has standard normal distribution when H0 is true. Then P-value=P(Zα ≥ Z) where Zα is the critical value of Z for a given level of significance α. R codes for obtaining these P-values are ”1-pnorm(Z)” and ”2*(1- p norm(Z)) or 2*p norm(abs(Z))” respectively. Similarly, for testing homogeneity of variances Chi-square(χ2) test statistic.

P Value and Statistical Significance

And F test statistics will be used. R codes of P-values for these tests are ”1-pchisq (χ2, df)” and ”1-pf (F, df1, df2)” respectively where df is degrees of freedom, df1 is the degrees of freedom for numerator and df2 is the degrees of freedom for the denominator.

Conclusion

Nowadays reporting of p-values is very common in applied fields. The most important conclusion is that, for testing the hypotheses, P-values should not be used directly, because they are easily misinterpreted. From the Bayesian perspective, P-values overstate the evidence against the null hypothesis and other methods to adduce evidence (likelihood ratios) may be of more utility. Finally, in many scenarios P-values can distract or even mislead, either a nonsignificant result wrongly interpreted as a confidence statement in support of the null hypothesis or a significant P-value that is taken as proof of an effect. Thus, there would appear to be considerable virtue in reporting both P-values and confidence interval (CI), on the basis that singular statements such as P¿0.05, or P = Non-Significant, convey little useful information, although for a 100(1-α) % CI, it must be remembered that any violation of the assumptions that effect the true value of effect CI precision. From the Bayesian perspective, Lindley has summarized the position thus: significance tests, as inference procedures, are better replaced by estimation methods it is better to quote a confidence interval. Finally, p-values should be retained for a limited role as part of the statistical significance approaches.


Monday, 26 April 2021

Lupine Publishers| Palm Oil Fuel Ash as A Cement Replacement in Concrete

 Lupine Publishers| Modern Approaches on Material Science (MAMS)


Abstract

To produce concrete, cement is an essential material that binds together solid bodies but also is the largest producer of carbon dioxide (CO2) emission. Up to 10% of global CO2 emission comes from cement production thus making the sustainability of concrete a major issue that needs addressing. The processes of producing concrete consume heavily on natural resources such as sand, gravel, water, coal and crushed rock, mining of which damages the environment. It is however possible, that energy and cost efficiency can be achieved by reducing on the amount of clinker, and in its place utilizing partial cement replacements/pozzolans that require less process heating and emit fewer levels of carbon dioxide. This study investigates the effectiveness of agro waste ash by-product Palm Oil Fuel Ash (POFA) as an alternative material to replace Portland cement (OPC). Experiments were carried out by supplementing CEM I cement by weight in concrete mixes with POFA at 2.5%, 5%, 10%, 15% and 20% steps at the point of need, with water to cement ratio of 0.5. Results were compared with a control specimen, which was made with 100% cement. The results showed impressive compressive strength, especially at early age; in fact POFA specimens containing 2.5% and 5% POFA replacement displayed greater early compressive strength in comparison to the control, which is similar in behaviour to concrete containing silica fume which is an established partial cement replacement used in high strength applications. The results showed good repeatability and highlight the potential of POFA as an effective pozzolan which could enhance the sustainability and economic aspect of concrete.

Introduction

Sustainability has widely emerged in recent years to resist climate change and pollution caused by ineffective waste management. The cement industry, as one of the fundamental materials industries, plays a very important role in the social and economic development as well as imposes a great challenge in terms of its large consumption of natural resources and energy and the emission of greenhouse gases. Cement is one of the main constituents in concrete and is thus one of most utilized commodities in the world [1]. From an environmental perspective, the production of 1 tonne of cement directly generates about 1 tonne of CO2 [2]. Cement production is therefore responsible for 7-10% of the world’s total CO2 emissions; compare this to the aviation industry, which is 2.8%, three times less than the production that comes from cement industry [3-8]. As a result, the use of supplementary cementing materials (SCMs), like pulverised fuel ash (PFA) and ground granulated blastfurnace slag (GGBS) have been established over the past 30 years as they not only reduce the embodied CO2 of concrete, the long-term strength and durability is improved. Both PFA and GGBS are waste products from the coal and steel industry; due to the recent decline of both these industries, focus has shifted on other alternative SCMs. One potential alternative from agricultural waste is POFA. POFA is ash obtained by incinerating the by-products of palm oil mill. The tall-stemmed oil palm tree belongs to palm family Palmea and the countries that cultivate oil palm are Benin Republic, Colombia, Ecuador, Nigeria, Zaire, Indonesia and Malaysia of which the last one is the largest producer of palm oil and palm oil products [9]. In Malaysia the total solid waste generated by this industry in about two hundred palm oil mills has been estimated at about ten million tons a year. These by- products are commonly used as fuel in the boiler of palm oil mills and become ash. The ash is a waste material the disposal of which poses enormous environmental pollution because the ash is usually disposed of without any commercial return [7,9,10] in the Far East millions of tonnes of waste is generated annually. It has been suggested [11] POFA may have pozzolanic qualities, however, very little research has been done in this area. This paper investigates the plausibility of POFA as a pozzolanic addition in concrete.

Methods

Palm Oil Fuel Ash was sourced from Malaysia. The cement used was Portland cement– CEM I 52.5R (Snow Crete). Cement was replaced with POFA in concrete by volume at steps of 0%, 2.5%, 5%, 10%, 15% and 20%. The 0% replacement, also referred to as the control was taken as the point of reference from which all performance was measured. Water to cement ratio (WCR) of 0.5 was used for the mixes to achieve a good balance of workability and strength in line with Abram’s law which states that the strength of concrete mix is determined by the WCR, with lower WCR having higher strengths and vice-versa [12]. The quantities of each mix were measured as detailed in Table 1. Workability was measured using the slump test method, whose apparatus were a slump cone and a tamping rod conforming to BS EN 12350-2:2009 [13]. Cube moulds for compressive measured 100mm x 100mm x 100mm, whereas cylinder moulds for tensile strength testing were 150mm in diameter and 300mm in height, conforming to dimensional guidelines of BS EN 12390-1:2012 [14]. The method used to make cubes conformed to BS EN 12390-2:2009 [15]. Cylinders conformed to BS EN 12390-4:2000 [16]. The specimens were left on the moulds for 24 hours after which they were stripped, marked and submerged in a water tank at temperatures of 20 °C±2 until their age of testing conforming to BS EN 12390-2:2009 [15]. Specimens were cured for up to 28 days. Compressive strength tests were conducted to BS EN 12390-4:2000 [16]. After the application of an initial load of 0.6±0.2N/mm2.s, which, according to BS EN 12390-4:2000 [16] does not exceed 30% of the failure load, further constant load was applied at a rate of±10% until no further load could be sustained. Compressive tests were carried out at 7 and 28 days. Results were taken as an average of the three cubes per test, and expressed in N/mm2.Tensile strengths were conducted to BS EN 12390-6:2009 [17]. The testing machine conformed to BS EN 12390-4:2000 [16] while packing strips conformed to BS EN 316:2009 [18]. Initial load was applied at a constant rate of stress of 0.04 N/mm2.s, which, according to BS EN 12390- 6:2009 [17] does not exceed 20% of the failure load. Further constant load was thereafter applied at a rate of ±10% until no further load could be sustained. As POFA is a very fine low- density material the cement was replaced by weight and at lower percentage, similar dosage to Silica Fume.

Table 1: Proportions of POFA concrete mix using CEM.

Lupinepublishers-openaccess-material-science-journal

Results and Discussion

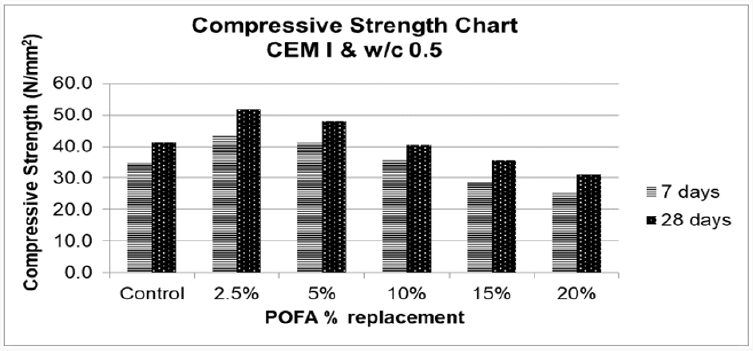
Figure 1: Compressive strength Development Chart (CEM I and w/c 0.5).

Lupinepublishers-openaccess-material-science-journal

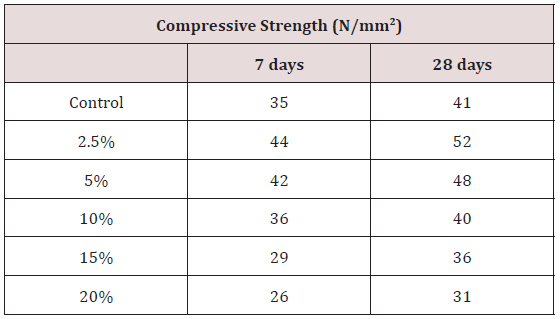
Compressive strength is the most important property of concrete, and it measures how much load concrete structures can sustain before failing. (Table 2) and (Figure 1) show the compressive strengths at 7 and 28 days of hardened concrete with 0%, 2.5%, 5%, 10%, 15% and 20% POFA replacement. Replacements of up to 10% achieved strengths that were above the targeted class C32/40 at 28 days, is among strength classes listed by BS EN 1992-1-1: 2004 [19] and BS 8500-1:2015 [20], as being suitable for structural applications. It is possible to predict the higher replacements could achieve strengths that are far above this class strength at 91 days or longer, due to the fact that pozzolanic concrete continue to gain strength up to and beyond 91 days. Palm Oil Fuel Ash can also be used as an alternative to cement in highway pavement as the minimum 28-day compressive cube strength requirement using pozzolans for highway pavements in the UK is 9.6N/mm2. Therefore 2.5%, 5% and 10% replacement of POFA is sufficient to use in highway pavement and road construction. It is worth noting, as POFA is a very fine and low-density material, a 10% partial cement replacement constitutes a large volume of POFA, similar to silica fume. Like similar fume [21] at low percentage cement substitution of up to 5% POFA yields greater early age strengths in comparison to the control. In limited work reported elsewhere, other researchers [7,9,11] found the optimum level of replacement to be at 15%-20% which are different results from this research. The findings suggest that Palm Oil Fuel Ash is an effective pozzolan to replace cement at low percentages. The 2.5% and 5% POFA replacements had remarkable high early strength concrete compare to the control one. According to [22,23], the early age strength is due to the hydration of cement, with POFA acting as a filler of voids and contributing to the strength gain, while the latter age strength in pozzolanic concrete is associated with the reaction of SiO2 present in the POFA with free lime Ca(OH)2 from the hydration of cement in a secondary reaction over time, to form calcium silicate hydrate (C-S-H). The optimum replacing level of cement by POFA is at 2.5%. This amount of replacement could be effective in large projects where large amounts of OPC are used and an early high compressive strength is required. The replacement of OPC with POFA helps in decreasing the pollution as well as has many economic benefits. Palm Oil Fuel Ash particle size can be compared to that of silica fume and therefore could have similar applications to silica fume especially in terms of mix design. It can be used in high-strength concrete and could include long span bridges, mainly of precast and prestressed girders to allow for longer span in structural bridge design and high-rise sky scrapers by building smaller columns and increasing usable space.

Table 2: Compressive strength for POFA using (CEM I and w/c 0.5).

Lupinepublishers-openaccess-material-science-journal

Tensile strength

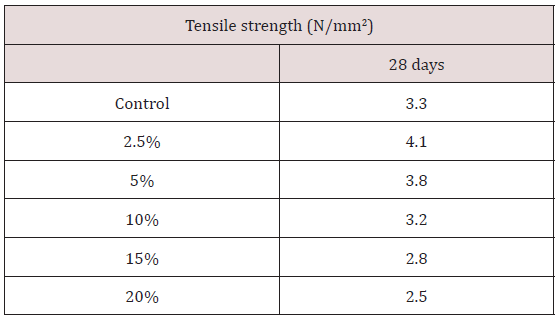
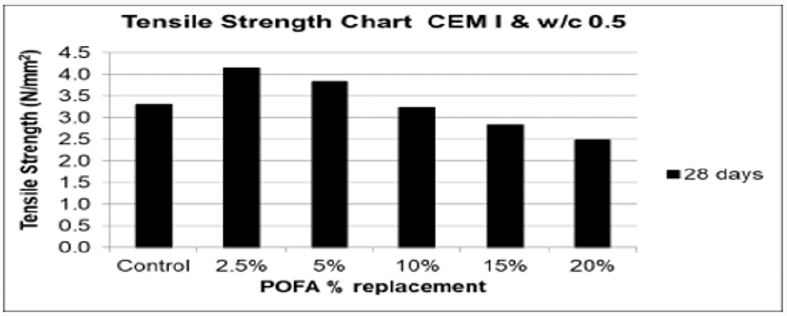
(Table 3) and (Figure 2) show the tensile strength results for POFA concrete at 28 days, the tensile strength initially increases with increasing POFA replacement up to 5% then subsequently decreases at higher levels; this trend is not consistent with the general behavior of PCRs [22-26] whereby the tensile strength decreases with increasing amount of PCRs.

Table 3: Tensile strength for POFA using (CEM I and w/c 0.5).

Lupinepublishers-openaccess-material-science-journal

Figure 2: Tensile Strength of POFA replaced concrete at 28 days.

Lupinepublishers-openaccess-material-science-journal

Workability

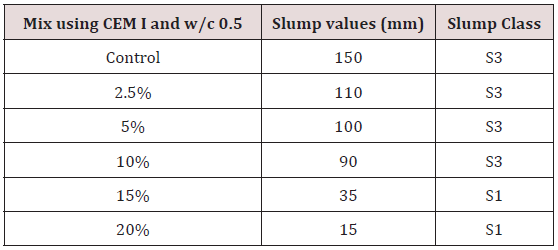
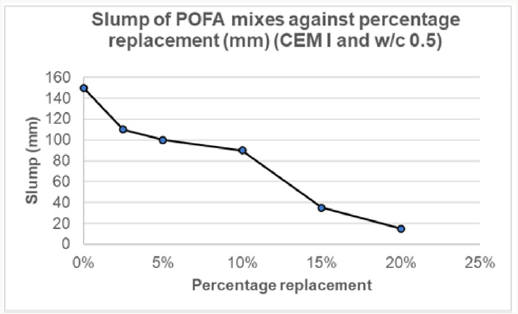
Table 4 and Figure 3 show the slumps of POFA replaced mixes at different replacement levels. One of the basic attributes of any cementitious material is its workability or “consistence”, which is largely determined by how wet the concrete is. This is referred to as “slump”. Basically, the wetter the concrete, the higher the slump. Although slump is often seen as an indication of water content, it is more reasonably interpreted as a measure of consistence. Consistency is a term that describes the state that concrete is when it is delivered on site, how easily can fresh concrete flow. Concrete is said to be workable when it is easily placed and compacted homogenously, however workability is very difficult to assess. Slump test is the most well-known method to examine the characteristics of concrete workability. It is used to measure the consistency of concrete as well. The slump test values depend on a variety of factors such as types and properties of concrete ingredients. Workability of POFA concrete was observed to decrease with increasing replacement; this is due to the high-water demand of POFA which can be countered by the use of admixtures. Like with silica fume [21], the water demand of concrete containing POFA increases with increasing amounts of POFA. This increase is caused primarily by the high surface area of the palm oil fuel ash.

Table 4: Slump readings for POFA mixes.

Lupinepublishers-openaccess-material-science-journal

Figure 3: Workability of POFA replaced mixes.

Lupinepublishers-openaccess-material-science-journal

Conclusion

The usage of partial cement replacements or pozzolans is gaining popularity for a variety of reasons including enhancing concrete performance, reducing the cost of using traditional concrete ingredients and serve the environment. Cement production is one of the highest contributors to CO2 emission. Partial cement replacements not only confer environmental benefits, but they also have a positive impact on concrete properties. This study investigated the effect of Palm Oil Fuel Ash as a pozzolan replacement in concrete and the main findings are:

a) Palm Oil Fuel Ash is an effective pozzolan to replace cement at low percentages with the optimum level is at 2.5%

b) Specimens made with 2.5% and 5% POFA replacement had higher strengths compared to the control at 7 and 28 days; very similar behaviour to silica fume

c) Workability decreases with increased amount of POFA unlike with PFA and GGBS concrete; like silica fume POFA has a high-water demand.

d) Based on strength findings, palm Oil Fuel Ash concrete have the potential to be used in superstructures including long span bridges, mainly for precast and prestressed girders to allow for longer spans in structural bridge design and high-rise sky scrapers by building smaller columns and increasing.


Friday, 23 April 2021

Lupine Publishers | Interactions between Measles, Mumps and Rubella (Mmr) Vaccines and Atopic Diseases in Children

 Lupine Publishers | Journal of Respiratory & Skin Diseases


Abstract

Background: Epidemiologic data on atopic diseases are scared. Different studies have shown that the burden of atopic diseases is varying in space and time. Several factors are impacting on epidemiology of atopic in children. Among them, MMR vaccination has been a topic of divergences.

Objective: To establish whether the MMR vaccination may influence the risk of atopic diseases in children.

Methods: We conducted electronic search terms included MESH or key words with "Atopic diseases” and "MMR vaccination” and “Children”. Databases for peer-reviewed articles included Pub Med, CENTRAL, Scopus and CINAHL Plus. Additionally, Grey literature was obtained from Google and WHO database.

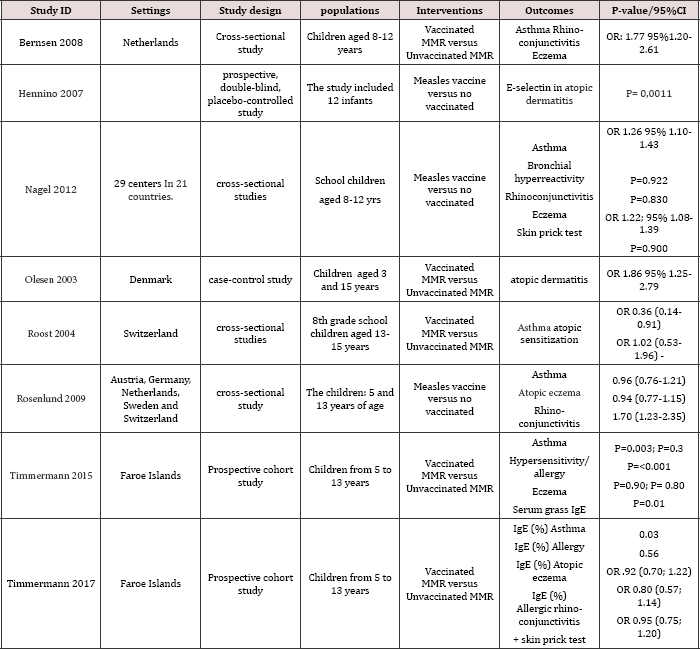
Main results: Among 304 potentially relevant articles identified, 8 peer-reviewed articles met the inclusion criteria. Due to the lack of standardized reporting of different outcomes and different study designs, we reported the results narratively based on P-value and 95% CI. We found three studies that demonstrated that MMR vaccination increased the fold of asthma in children (P<0.05). In contrast, two studies have approved that MMR vaccination is benefit in preventing asthma in children. MMR vaccination decreases asthma respectively by OR 0.36 95%CI (0.14-0.91) and OR 0.96 95% CI (0.76-1.21). Two studies reported MMR vaccination increase the eczema OR in two studies with respectively OR: 1.77 95% CI (1.20-2.61) and OR 1.86 95%CI (1.25-2.79). On the other hand, three studies revealed that MMR vaccination did not have any effect on atopic eczema with respectively P=0.830, OR 0.94 95% CI (0.77-1.15) and P=0.90.

Conclusion: Based on the variability between studies, we hypothesize that judging the association between MMR vaccination and atopic diseases could not be fruitful in understanding different mechanisms. In this context, we suggested the interactions between Gene-environment MMR vaccination and atopic diseases that could clarify divergences between the results.

Keywords: Atopic diseases; MMR vaccination; Children

Background

The word atopy (Greek: atopia, out of place) refers in accordance with an inherited tendency to produce immunoglobulin E (IgE) antibodies in response to small amounts of common environmental proteins such namely pollen, house dust mite, and food allergens [1]. The presence of atopy in an individual is associated with an increased risk of developing atopic diseases among which atopic dermatitis, asthma, and allergic rhino-conjunctivitis/hay fever (and food allergy) [2]. However, atopy can be present in the form of asymptomatic sensitization to one or more allergens, which means that an individual with confirmed allergic sensitization does not exhibit clinical allergy [2]. Epidemiologic data on atopic diseases are scared. Different studies have shown that the burden of atopic diseases is varying in space and time. Secular trends in atopic diseases have been studied worldwide. The rise in disease occurrence was particularly apparent between the 1960s and the 1990s, after which the rise evened out. For example, in Australia the occurrence of asthma in schoolchildren rose up from 12.9 to 38.6% between 1982 and 1997, and the prevalence of hay fever increased from 22.5 to 44.0% [1].

In Denmark, the prevalence of atopic dermatitis augmented from 17.3 to 27.3% among children aged 7-17 years between 1986 and 2001, and the prevalence in children living in Scotland increased from 5.3 to 12.0% between 1964 and 1986 [1-3]. In many resources limited countries, atopic diseases occurrence have also seen a marked increase. For example, in South African children the prevalence of eczema increased from 11.8% in 1995 to 19.4% in 2001 [1-4]. Only atopic dermatitis also called atopic eczema affects 1-3% of adults worldwide. Fifty percent of all those with atopic dermatitis develop other allergic symptoms within their first year of life and probably as many as 85% of the patients experience an onset below 5 years of age [5]. Patients generally outgrow the sickness in late childhood as around 70% over the patients with a disease onset during childhood have a spontaneous remission before adolescence. In addition, about 75% of children with atopic dermatitis develop allergic rhinitis and more than 50% develop bronchial asthma [2].

In reality, several elements affect the immune system in early life. Among these factors, routine mass immunization of children against a variety of infectious diseases has been incriminated to rise up the risk of atopic diseases. This topic is subject to contradiction between authors. In effect, immunization in children could directly stimulate TH 1-like immunity or indirectly prevent such immune responses by reducing the occurrence of some infections [6]. The immune response observed during the course of atopic diseases is characterized by a biphasic inflammation. A Th2-biased immune response (IL-4, IL-13, TSLP and eosinophils) is prior in the initial and acute phase of atopic diseases, while in chronic atopic diseases, a Th1/Th0 dominance has been described (IFN-y, IL-12, IL-5 and GM-CSF) [5-7]. Viral infections promote a Th1-biased immune response and live viral vaccines, such as those for measles, mumps, and rubella (MMR), may promote a similar response [8,9]. This is supported by the observation of high levels of the Th1 signature cytokine IFN-c and low concentrations of the Th2 signature cytokine IL-4 in children after measles vaccination [9-11]. Th2 associated first type or immediate hypersensitivity reactions involve immunoglobulin E (IgE)-mediated release of histamine and other types of mediators from mast cells and basophiles Type I reactions underlie the following atopic disorders: allergic asthma, eczema, allergic rhinitis, conjunctivitis [11]. In spite of that, immunologic mechanisms could not explain clearly the interactions between MMR vaccination and atopic diseases which are subject to controversy and no consensus. Reviewing the literature, MMR vaccination could increase, maintain or decrease the likelihood of developing atopic diseases in children. As proven by immunologic mechanism, MMR vaccination may stimulate different pathways and induce atopic disorders. We reviewed different studies in the field of MMR vaccination and atopic diseases and suggest some hypotheses that could highlight the discrepancy in different studies.

Objective

The main objective was to study whether the MMR vaccination may influence the risk of atopic diseases in children.

Methods

We conducted electronic search terms included MESH or other associated terms with 'Atopic diseases" and "MMR vaccination" and "Children". Databases for peer-reviewed articles included Pub Med, CENTRAL, Scopus and CINAHL Plus. Furthermore, Grey literature was obtained from Google and WHO database. Article citations were organized uploaded and reviewed using the review manager (Revman) from their respective databases. The title, author, journal and year of publication were then exported to an excel spreadsheet for title and abstract review. Articles were screened by JLT and JLT to determine whether they included relevant information. JLT and JLT assessed the quality of quantitative data from studies with the Newcastle-Ottawa Scale (NOS). Observational studies were assessed with Newcastle-Ottawa Scale. The following domains were used for bias assessment: -is the case definition adequate? - Representativeness of the cases -Selection of controls -Definition of controls -Comparability of cases and controls on the basis of the design or analysis -Ascertainment of exposure -Same method of ascertainment for cases and controls reporting, external validity, bias, confounding and power [12].

Results

We identified 304 potentially relevant articles. A total of 8 peer- reviewed articles met the inclusion criteria and were included for further analysis. Due to the lack of standardized reporting of different outcomes, we could not undertake meta-analysis. Instead, we categorized studies by their settings, designs, interventions, outcomes and P-value/95%CI (Table 1). We included different study designs among which four cross-sectional studies, three prospective cohort studies and one case control study. We found three studies have shown that MMR vaccination increased the fold of asthma in children. The results were statistically significant with P-value<0.05 or the OR was above 1, the 95%CI did not include the null value [9,13-14]. MMR vaccination increase the eczema OR in two studies with respectively OR: 1.77 95% CI (1.20-2.61) and OR 1.86 95%CI (1.25-2.79) [13-15]. Children that received MMR vaccination were likely to have rhino-conjunctivitis in two studies with OR: 1.77 95%CI (1.20-2.61) and OR 1.70 95% (1.232.35) [13-16]. MMR vaccination increased serum IgE in asthmatic children (P=0.03) [17], however, serum IgE remain normal in both atopic eczema and rhino-conjunctivitis [17]. Only one study used serum selecting outcome in children with atopic dermatitis. Serum selecting was higher in MMR vaccination group than MMR unvaccinated group (P=0.0011). In contrast, two studies have approved that MMR vaccination is benefit in preventing asthma in children [6-16]. MMR vaccination decreases asthma occurrence respectively by OR 0.36 95%CI (0.14-0.91) and OR 0.96 95%CI (0.76-1.21). But, the last 95%CI was not statistically significant. Three studies revealed that MMR vaccination did not have any atopic eczema with respectively P=0.830, OR 0.94 95% CI (0.77-1.15) and P=0.90. In two studies [17] that analyzed skin prick test, MMR vaccination versus MMR unvaccinated did not shown statistically significant results.

Table 1: Characteristics of included studies.

lupinepublishers-openaccess-journal-respiratory-skin-diseases

Discussion and Conclusion

In our review, MMR vaccination and atopic diseases were assessed both by parental and medical reporting as well as objective clinical markers (serum IgE and selecting) [17-18]. Parental recall is likely to be incomplete, particularly for non-specific illness, such as fever or respiratory infections; this could imply ascertainment bias in cases and controls. The sample size was large enough in all studies. In spite of that, cases and controls groups were unbalanced in some studies [13-19]. Consequently, these studies may be prone to selection bias. Besides, we included studies with high power and multiple linear regressions were used to adjust confounding. In effect, variability of results between studies has proven that the interactions between MMR vaccination and atopic diseases are still unclear. Based on this, there is a need of large randomized controlled trials to find the consensus. Even so, the consensus could not be found. According to our analysis, several factors could influence the interactions between MMR vaccination and atopic diseases.

The relationship between some genes and atopic diseases is well known. A study has demonstrated the genes for IL-4, IL-13, HLA- DRB, TNF, LTA, FCER1B, IL-4RA, ADAM33, TCR a/5, PHF11, GPRA, TIM, p40, CD14, DPP10, T-bet, GATA-3, and FOXP3 are associated to atopic diseases [20]. Moreover, the child develops atopic dermatitis in the first months of life accompanied by sensitization to cow's milk, egg, or peanut, and sometimes also vomiting, diarrhea, or anaphylaxis in relation to ingestion of these foods beginning around the age of 6-12 months [1]. This is followed by sensitization to indoor allergens such as house dust mite, cockroach, and furred pets [1]. Thus, we hypothesize, considering only MMR vaccination and atopic diseases could not be fruitful in understanding different mechanisms. In this context, the concepts: Gene-environment- MMR vaccination and atopic diseases could be effective to clarify divergences between studies. Knowing that the studies were conducted in different community genetics, environments and lifestyle; the association between MMR vaccination and allergic asthma, eczema, allergic rhinitis, conjunctivitis could not be established.

Read More Lupine Publishers Journal of Respiratory & Skin Diseases Click on Below Link
https://lupine-respiratory-skin-and-diseases.blogspot.com/
Lupine Publishers | Factors Leading to Acquired Bacterial Resistance Due to Antibiotics in Pakistan

 Lupine Publishers | Journal of Biotechnology & Microbiology


Abstract

Antibiotics are medicines used to prevent and treat bacterial infections. Antibiotic resistance occurs when bacteria change in response to the use of these medicines. Bacteria, not humans or animals, become antibiotic-resistant. Antibiotic resistance occurs when an antibiotic has lost its ability to effectively control or kill bacterial growth. Antibiotic resistance is a major concern of overuse of antibiotics. In other words bacteria are resistant and are able to multiply in the presence of therapeutic levels of an antibiotic. Antibiotic resistance has become a major issue in the 21st century and is posing as a major blip on the danger radar. Pakistan being one of only three polio-suffering countries is also suffering from bacterial resistance caused by poor use of Antibiotics. Being a third world country, Pakistan suffers from avoidable causes of antibiotic resistance but lacks the basic necessities which provides favorable environment to bacteria and produce resistance to its killer/inhibitor. Following article focuses primarily on the factors leading to acquired bacterial resistance to Antibiotics in Pakistan.

Introduction

The Capacity of Bacteria to Resist Against The Effects of an Antibiotic is Called Antibiotic Resistance

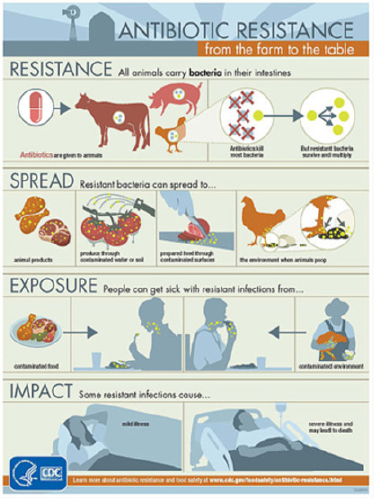
This resistance is due to the change in nature of the bacteria and becomes severe due to several multiplications of bacterial generations which cause destruction in human body [1]. Another most common cause of antibiotic resistance in Pakistan is that the patients get antibiotics from medical stores without the physician’s |description [2]. Antibiotic consumption in Pakistan between 2000 and 2015 increased 65% from 800 million defined daily doses (DDD) to 1.3 billion DDD. The antibiotic consumption rate in the country witnessed a surge from 16.2 DDD to 19.6 DDD per 1,000 inhabitants per day [3]. Multidrug resistance (MDR) is increasing day by day in Pakistan [1]. A study found that Pakistan was the third highest consumer of antibiotics after India and China among the 76 low- and middle-income countries it surveyed [4] (Figure 1).

Figure 1: How Antibiotic Resistance Happens..

Lupinepublishers-openaccess-Agriculture

Misuse

The prevalence of misuse of antibiotics is common in under developed\developing countries as compared to developed countries. Pakistan being a developing country is majorly suffering misuse of antibiotics as a result developing resistant to over the counter antibiotics and playing a part in the evolution of mutated genes with far more resistance than their precursor form of the micro-organism which not only is a problem for Pakistan but for the entire human\animal population. Below are discussed on the issue on causes of antibiotics misusage in Pakistan w.r.t it’s socioeconomic and literacy status [5].

Cheap and Easy Availability

Pakistan is a poor country and the country’s wealth mainly resides in agriculture About 25% of Pakistan’s agriculture accounts for about 21% of GDP and employs about 43% of the labour force. No proper prescription is respected in the country for the purchasing of antibiotics. Some of the most commonly used classes of antibiotics in Pakistan are [6].

a) Penicillins such as penicillin and amoxicillin

b) Cephalosporins such as cephalexin (Keflex)

c) Macrolides such as erythromycin (E-Mycin), clarithromycin (Biaxin), and azithromycin (Zithromax)

d) Fluoroquinolones such as ciprofolxacin (Cipro), levofloxacin (Levaquin), and ofloxacin (Floxin)

e) Sulfonamides such as co-trimoxazole (Bactrim) and trimethoprim (Proloprim)

f) Tetracyclines such as tetracycline (Sumycin, Panmycin) and doxycycline (Vibramycin)

g) Aminoglycosides such as gentamicin (Garamycin) and tobramycin (Tobrex) [22].

Due to the poor economic and lack of basic health facilities in Pakistan. Residents of mainly rural areas find antibiotics easily accessible. Lack of awareness to the damage caused by misusage of such drugs makes them prevalent in the rural parts of the country. The Use of old syringes and expired antibiotics is also common which leads to further diseases than antibiotic resistance [7].

Illiteracy

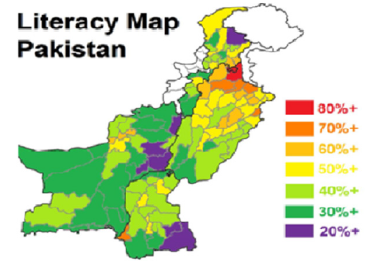
Pakistan has a population of about 184 million, with sex ratio of 105.6: 100. It is estimated that about 62% of the people are residing in rural and 38% in urban areas. 42% population (age 10+) is illiterate. Wide discrepancies persist in education indicators pertaining to provinces/areas, location (urban vs. rural) and gender. At the national level, about two third women of age 15+ cannot read and write, and 35% girls remain out of school. Gender Parity Index in case of participation in primary education is 0.82. It is estimated that over 6.7 million children are out of school, and majority of them (62%) are girls [8] (Figure 2). The literacy rate of Pakistan has been said to drop by 2-3% by the year 2015. People have not completely acknowledged the side effects of the taken antibiotics. Fast relive is the only main concern [8].

Figure 2: Literacy Map of Pakistan.

Lupinepublishers-openaccess-Agriculture

Self-Medication and Fake Medical Practitioners

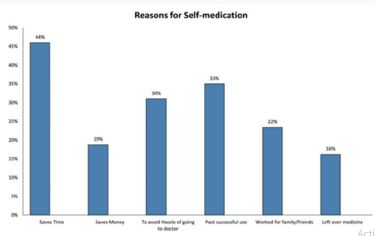
Figure 3: Causes of Self Medication.

Lupinepublishers-openaccess-Agriculture

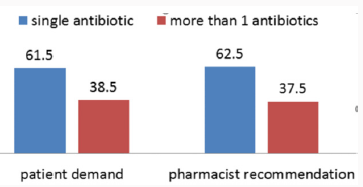
World Health Organization has mentioned, according to a survey that self-medication, if administered appropriately and responsibly can help prevent and treat diseases economically and without medical consultation [9,10]. In many developing countries, well-trained health personnel are scarce and cannot serve the entire population, especially in rural areas. Community health workers and others with minimal training treat minor ailments [11]. The Pakistan Medical Association (PMA) released a report stating there are more than 600,000 non-registered Medical Practitioners working in the country. Even Metropolitan cities of Pakistan like Islamabad, Karachi and Lahore are home to self-prescription and non-qualified doctors prescribing. The most common antibiotic used for self-medication purposes was amoxicillin which was used by 81(41.4%) study participants. Amoxicillin was followed by Metronidazole (30.5%), Ciprofloxacin (12.7%) and Cotrimoxazole (9.5%). Erythromycin and Ampicillin/cloxacillin were used by 6.7% and 6.2% of the sample population respectively and other antibiotics were amongst the less frequently used antibiotics [12,5] (Figure 3).

Antibiotic Use Other than Humans

Pakistan is an agricultural country and It is seen in Pakistan that use of antibiotic use is not only restricted to humans only. Sprays of antibiotics used on plants and livestock to increase their mass and yields is increasing the antibiotic resistance among the population. Antibiotics are essential for control of bacterial diseases of plants, especially fire blight of pear and apple and bacterial spot of peach. Streptomycin is used in several countries; the use of oxytetracycline, oxalinic acid and gentamicin is limited to only a few countries. Springtime antibiotic sprays suppress pathogen growth on flowers and leaf surfaces before infection; after infection, antibiotics are ineffective. Antibiotics are applied when disease risk is high but in Pakistan it is used to obtain high yield and faster harvest to sale of fruits and vegetables ignoring the fact that these antibiotics are producing resistant in bodies of those who intake these produce. Livestock are also victims of misuse antibiotics to relieve of even non-serious diseases for fast recovery [13] (Figure 4).

Figure 4: How Antibiotic Resistance Spreads.

Lupinepublishers-openaccess-Agriculture

Antibiotics Resistance Due to poor quality of Drugs

It is important to note that poor quality medicine can be critically damaging to public health in many ways beyond promoting anti-microbial resistance. Falsified medicines with no active ingredients leave both chronic and infectious diseases untreated, prolonging illness and the expense of treatment, and sometimes leading to death. For many infectious diseases including HIV and malaria, treatment failure leads to increased pathogen loads and thus increases the chance of infections being passed on. Fake vaccines, for their part, allow a person who would otherwise develop immunity to remain susceptible to infection. Poorly made or mislabelled medicines containing the wrong ingredients can be toxic, again killing the people who take them in the hope of a cure. Medication scares undermine public confidence in the health system, and the massive trade in fake medicine fuels and funds criminal networks while siphoning income away from legitimate business. These issues are, however, beyond the scope of this paper; here we focus only on those issues which affect or are affected by antimicrobial resistance [14].

Causes of Antimicrobial Resistance

To better appreciate the causes of AMR, we need to understand the various sequential steps involved for a drug to get to a patient and the eventual use, which include; production, distribution, prescription, dispensing, and finally consumption of the drug by the patient or use in animal production. Consequently, any imprudent practice along this flow may result in the emergence of resistance [15].

Drug dispensers and drug quality

the lack of appropriate regulations in the sales of antimicrobials is also a driving factor in the access and misuse of antimicrobials. In most developing countries, antimicrobials can be purchased without medical prescription and are usually dispensed on the streets by untrained persons. These drug vendors will sell medications just to make a sale and accommodate patients’ ability to pay. Even pharmacies operating without a license, appear to be more accessible to the public as they have shorter waiting time, do not charge consultation fees and above all are willing to negotiate treatment options to adjust to the financial ability of the patients. Retail pharmacies in developing countries especially in Pakistan have emerged as the primary level of outpatient care rendering unauthorized services from consultation, diagnosis, prescription and dispensing of medication. It has also been shown that many antimicrobials dispensed in Pakistan are of questionable pharmacological quality. Adverse climatic conditions such as high ambient temperatures and humidity may affect the overall quality of the antimicrobials during storage. Poor storage also increases the risk of degradation of the drug. Degraded medicines contain less than stated dose, implying that patients consume less than optimal dose of the drug.

There is also a problem of outright counterfeit, in which the drug may contain little or no active substance of the antimicrobial or the wrong substance. The influx of counterfeit and sub-standard antimicrobials into the pharmaceutical markets in some regions is a major problem as these preparations of reduced potency also result in pathogens being exposed to sub-therapeutic concentrations of the drug. A study revealed that, out of 284 antimalarial obtained from 132 vendors, 32% of chloroquine, 10% quinine, and 13% sulfadoxine/pyrimethamine were likely to be fake. In addition, some of the quinine contained chloroquine while some chloroquine contained no active ingredient or an amount lower than the expected concentration [15] (Tables 1 & 2).

Table 1: Factors and stakeholders contributing to the problem of antimicrobial resistance.

Lupinepublishers-openaccess-Agriculture

Table 2: Factors that contribute to poor-quality drugs.

Lupinepublishers-openaccess-Agriculture

Environmental and Hygenic Factors

Antimicrobial resistance (AMR or AR) is the ability of a microbe to resist the effects of medication that once could successfully treat the microbe [16-18]. The term antibiotic resistance (AR or ABR) is a subset of AMR, as it applies only to bacteria becoming resistant to antibiotics. Resistant microbes are more difficult to treat, requiring alternative medications or higher doses of antimicrobials. These approaches may be more expensive, more toxic or both. Microbes resistant to multiple antimicrobials are called multidrug resistant (MDR). Those considered extensively drug resistant (XDR) or totally drug resistant (TDR) are sometimes called “superbugs” [19].

Veterinary Medicine

Main article: Antibiotic use in livestock, Infographics showing antibiotic resistance from the farm to the table

All animals carry bacteria in their intestines. Antibiotics are given to animals. Antibiotics kill most bacteria. But resistant bacteria survive and multiply. The World Health Organization concluded that inappropriate use of antibiotics in animal husbandry is an underlying contributor to the emergence and spread of antibioticresistant germs, and that the use of antibiotics as growth promoters in animal feeds should be restricted [20]. The World Organisation for Animal Health has added to the Terrestrial Animal Health Code a series of guidelines with recommendations to its members for the creation and harmonization of national antimicrobial resistance surveillance and monitoring programs, monitoring of the quantities of antibiotics used in animal husbandry [21], and recommendations to ensure the proper and prudent use of antibiotic substances. Another guideline is to implement methodologies that help to establish associated risk factors and assess the risk of antibiotic resistance [22].

Water, Sanitation, Hygiene

Infectious disease control through improved water, sanitation and hygiene (WASH) infrastructure needs to be placed at the center of the antimicrobial resistance (AMR) agenda. The spread of infectious diseases caused by inadequate WASH standards is a major driver of antibiotic demand in developing countries [23]. Growing usage of antibiotics together with persistent infectious disease levels have led to a dangerous cycle in which reliance on antimicrobials increases while the efficacy of drugs diminishes [23]. The proper use of infrastructure for water, sanitation and hygiene (WASH) can result in a 47-72 percent decrease of diarrhea cases treated with antibiotics depending on the type of intervention and its effectiveness [23]. A reduction of the diarrhea disease burden through improved infrastructure would result in large decreases in the number of diarrhea cases treated with antibiotics. Sanitation and water for all by 2030 is Goal Number 6 of the Sustainable Development Goals.

Water Pollution

An increase in hand washing compliance by hospital staff results in decreased rates of resistant organisms. Antibiotic resistance is a growing problem among humans and wildlife in terrestrial or aquatic environments. In this respect, the spread and contamination of the environment, especially through water pollution “hot spots” such as hospital wastewater and untreated urban wastewater, is a growing and serious public health problem [24,25]. Antibiotics have been polluting the environment since their introduction through human waste (medication, farming), animals, and the pharmaceutical industry [26]. The contribution of the pharmaceutical industry is so significant that parallels can be drawn between countries with highest rate of increasing antibiotic resistance and countries with largest footprint of pharmaceutical industry. As bacteria replicate quickly, the resistant bacteria that enter water bodies through wastewater replicate their resistance genes as they continue to divide. In addition, bacteria carrying resistance genes have the ability to spread those genes to other species via horizontal gene transfer. Therefore, even if the specific antibiotic is no longer introduced into the environment, antibioticresistance genes will persist through the bacteria that have since replicated without continuous exposure. Antibiotic resistance is wide spread in marine vetebrates and they may be important reservoirs of antibiotic resistant bacteria in marine environment [27].

Prevention

Important strategies needed for minimizing antibiotic resistance are as follows [28].

a) Antibiotic stewardship to maintain the value of existing and future antibiotics

b) The timing of prescription to use the effective antibiotics sooner rather than later

c) To develop and approve ten new antibiotics by 2020 Development of a molecular method for detecting antibiotic resistance genes (Figures 5 & 6).

Figure 5: Antibiotic Resistance in Farm Animals.

Lupinepublishers-openaccess-Agriculture

Figure 6: Antibiotics dispensed in case of self-medication.

Lupinepublishers-openaccess-Agriculture

Transmission of Antibiotic Resistance

It has been noted and observed by many experts that overuse and misuse of antibiotics has led to resistance all over the world specially in the developing countries like Pakistan. Due to this reason most of the patients are not getting cured by previously used antibiotics. While addressing a National antimicrobial resistance (AMR) organized by AKU. It was said by Dr Sadia Shakoor (assistant professor of pathology and laboratory medicine at AKU). “Antibiotic resistance is a much problem in Pakistan as in the western hemisphere’’ [2]. This resistance is due to the change in nature of the bacteria and becomes severe due to several multiplications of bacterial generations which cause destruction in human body [1]. Another most common cause of antibiotic resistance in Pakistan is that the patients get antibiotics from medical stores without the physicians description [2]. Multidrug resistance (MDR) is increasing day by day in Pakistan [1].

Prodrug Resistant Bacteria

Many PDR microorganisms have been identified in Pakistan. These organisms include Pseudomonas, Enterobacter, Enterococcus, Acinetobacter and E coli. Resistant staphylococcus aureus has also been treated as PDR. After the discovery of PDR bacteria TDR bacteria have also evolved [18].

Cause of Infections in New Borns

Seventy one percent of the new born infections in Pakistan are a result of Antibiotic Resistant Bacteria (ARB) control [29]: A step should be taken in order to prevent medical store employees to give antibiotics without the physician’s prescription [2]. Fearing widespread deaths because of PDR and TDR bacteria, leading Pakistani surgeons to form the Surgical Infection Control Society f Pakistan and prepared a set of guidelines for surgeons all over the country to deal with the phenomenon [13]. Elimination of overdose of antibiotics should be a major priority in every country [30].

Conclusion

In Pakistan; resistance against frequently used antibiotics is increasing day by day in Pakistan like other under developed countries (3rd world countries). Community educational programs must be carried out for general population as well as for health care professionals. A revised line of management should be developed locally in accordance with the susceptibility pattern of pathogens to avoid further resistance as well as morbidity of the patient. Antibiotic susceptibility studies should be carried out in each hospital situated at different geographical locations of the country to develop local susceptibility profile against each bacterium circulating in that area.

Read More About Lupine Publishers Journal of Biotechnology & Microbiology Please Click on Below Link:
https://lupine-biotechnology-microbiology.blogspot.com/