Monday 30 November 2020

Lupine Publishers| Effect of Triflumuron and Diflubenzuron on Survivability and Developmental Period of Life Stages of Tribolium castaneum (Herbst) Under Laboratory Conditions

   Lupine Publishers | Current Investigations in Agriculture and Current Research


Abstract

The contact action of triflumuron (TFM) and diflubenzuron (DFB) on development and survivability of Tribolium castaneum (Herbst) were studied. The mean developmental period was recorded in different concentrations of both BPUs. Lower percentage of hatching was recorded on TFM compared to DFB and control. TFM was more effective than DFB on the survivability of different life stages. TFM at 0.05ppm provided the highest duration (49 days) of developmental period, and the lowest duration was 32.33 days (near to control) in DFB at 0.005ppm. Percent reduction of adult emergence was highest in 0.1TFM as 85.95 and at 0.05 DFB as 62. 50.

Introduction

The red flour beetle, Tribolium castaneum (Herbst) has had a long association with human’s stored food. It is a major pest in anthropogenic structures used for the processing and storage of grain-based products and a wide range of other commodities [1]. The tropical climate encourages rapid growth of this cosmopolitan species, and the population increases rapidly from a small residue. Due to the development of resistance against almost all synthetic insecticides it is very difficult to control T. castaneum with the traditionally used insecticides. Among the alternative reduced-risk insecticides, the benzoylphenyl urea’s (BPUs) proved themselves as potent candidate in controlling both susceptible and resistant strains of T. castaneum [2]. BPUs act as stomach poisons [3] at longer exposures to larval instars of the beetle.

Development and growth of the life stages of the treated insects have been reported to be inhibited by BPUs [2-4]. Have reported that triflumuron, a BPUs compound possesses some contact activity against the eggs of holometabolan insects. Most of the early reports on the biological activities of triflumuron, diflubenzuron or other BPUs were reported to show gustatory effects on the treated [2]. As moult inhibitors both triflumuron and diflubenzuron have been reported to disturb metamorphosis in a number of stored product insect species [5-11] and death may occur either during or immediately after the subsequent moult [12]. Some reports showed that BPUs also show contact toxicity towards insects but at a lower degree than the gustatory effect [13]. Reports on the effects of contact action of triflumuron and diflubenzuron against the growth and development of stored product coleopterans are scanty. So, the present experiment was designed to observe the contact activities of these two BPU compounds on the survivability of life stages and their developmental time in T. castaneum under laboratory conditions.

Materials and Methods

BPUs used

Triflumuron was used as a liquid product of Bayar AG, commercially known as Starycide 480 SC, containing mg/ml active ingredient. Dimilin with 25% wp of diflubenzuron was the source of diflubenzuron.

Pilot experiments

Pilot experiments were conducted with newly laid eggs of T. castaneum, released on filter papers treated with different concentrations of either triflumuron or diflubenzuron. The concentrations for each BPU compound were determined where egg mortality was nearly zero percent. Zero egg mortality was obtained at >0.1ppm of TFM and >0.05ppm of DFB. Depending on those concentrations, a series of three concentrations for each compound were selected. The concentrations of triflumuron (TFM) were used as 0.1, 0.05 and 0.01 ppm; and those of diflubenzuron (DFB) were used as 0.05, 0.01 and 0.005ppm. The abbreviations used here for the BPUs, were suggested by Grosscurt [14].

Preparations of concentrations

Required quantities of liquid triflumuron and powder diflubenzuron were diluted separately with such volume of distilled water, which gave 5ppm of TFM and DFB. These 5ppm concentrated solutions were used as stock solution. The solutions were shaked vigorously. Then by serial dilution of the stock solution of each compound was made by adding required amount of distilled water. At every step shaking of the solutions were continued to ensure thorough mixing of compounds with water. Thus, ultimately the required concentrations of TFM and DFB were obtained, kept in glass bottles separately keeping the mouth of the bottles made air tight and refrigerated at 40C.

Bioassays

Separate filter papers (9cm) were soaked in different concentration of treated solutions and dried at room temperature for an hour. The treated filter paper was then set in a petri dish of same diameter. Previously collected 24-h old eggs of T. castaneum were released on the filter paper in the petri dish. The petri dish was covered and kept for until the eggs began to hatch. Eggs on the treated filter paper were checked for hatching up to 10 days. The neonates were collected carefully and released in standard food. A treated filter paper with same concentration and compound was placed under the food in the petri dish. The larvae were reared up to the emergence of adults. After every three days the food was changed with a fresh one, but the filter paper was not changed. A similar set of experiment was carried on filter soaked with distilled water only, as a control. All the experiments were conducted at 30±10C in the Control Temperature (CT) room and replicated three times.

Parameters observed

Effect of TFM and DFB were observed on the following biological parameters of T. castaneum:

a) Survivability of life stages of T. castaneum

i. Hatching percentage

ii. Larval survivability up to pupation

iii. Pupal survivability

iv. Adult recovery/emergence

b) Developmental period of life stages of T. castaneum

i. Hatching period

ii. Larval period

iii. Pupal period

Statistical analysis

The effect of TFM and DFB on the survivability of the life stages and their developmental periods were tested by ANOVA and Tukey’s test. The percent reduction of adult emergence in treatments compared to control (PRC) was calculated by the formula provided by Mian [5] as follows:

PRC = 1–Average no. of adult emergence (treatment)

Average no. of adult emergence (control)x 100

Results and Observations

Effects on the survivability of life stages

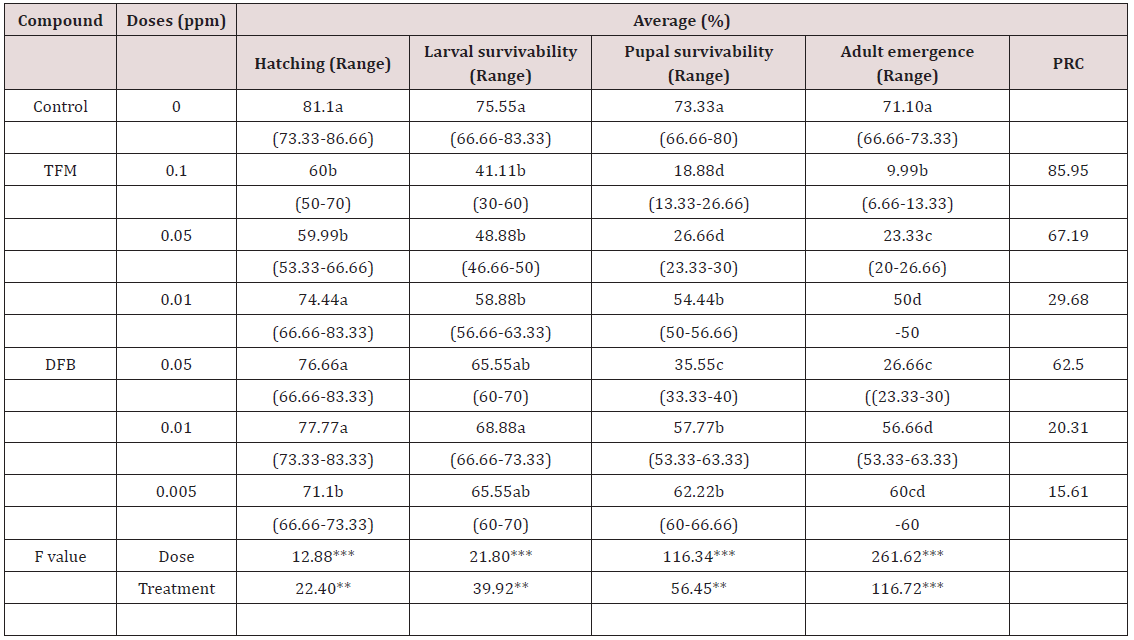
a) Effect on hatching: TFM showed a concentration related effect on the percentage of average larval hatching (Table 1). At concentration 0.1 and 0.05ppm the percent larval hatching was significantly less than the control (Table 1). Whereas, at 0.01ppm the result was not differed from control. In the contrary DFB concentrations showed a different trend. At lowest concentration (0.05ppm) the larval hatching significantly differed from the control, but at higher two concentrations the effects were similar to the control (Table 1).

Table 1: Effect of TFM and DFB on survivability at different stages and adult emergence of T. castaneum.

Lupinepublishers-openaccess-Agriculture

Note: PRC= Percent reduction compared to control in adult emergence.

***Significant at P<0.001, means with same letter do not significantly differed from each other (Tukey’s Test).

**Significant at P<0.05 and ***P<0.001 levels by ANOVA test.

b) Effect on larval survivability: Larval survivability was calculated from the difference between number of larvae hatched and the number obtained before pupation. The cumulative mortality decreased the larval survivability as 75.55% in control. The results showed that both TFM and DFB treatment reduced the percent survivability significantly differently (p<0.00, F=39.92) (Table 1). TFM had a greater mortal effect on the larvae than DFB (Table 1). TFM showed a concentration related larval survivability. Whereas, DFB at highest and lowest concentrations (0.05 and 0.005 ppm respectively) slightly affected larval survivability compared to control, and at concentration 0.01ppm the effect was similar to control (Table 1).

c) Effect on pupal survivability: In control batch out of 75.33% of larvae successfully transformed into pupae. At the end of pupal period 73.33% of the pupae succeeded to survive (Table 1). Both the compound significantly reduced pupal survivability at all concentrations compare to control. TFM was more potential in inhibiting pupal survivability than DFB.

d) Effect on adult emergence: Most of the survived pupae were succeeded to metamorphose into adult. In control the percentage of emergence was 71.10, which was significantly reduced up to 50% at 0.1 and 0.05ppm of TFM and 0.05ppm of DFB. Adult emergence was significantly reduced at all doses of both compounds compared to control. The PRC value ranged from 29.68–85.96 in TFM treatment and from 15.61–62.50 in DFB treatment.

Effects on the developmental periods of the life stages

a) Effect on hatching period: Untreated eggs of T. castaneum took 4-5 (5±0.58) days to hatch. Neither TFM nor DFB produced any on the hatching time difference of the eggs compared to the control (Table 2).

b) Effect on larval period: Both the compounds produced slight increase in larval duration. Interestingly, in the present study the highest concentration of both TFM and DFB produced no significant effect on the larval period (Table 2). TFM at 0.05ppm increased the larval period as 36.33±0.67) days and at 0.01ppm the increment was 31.33±0.88 days; whereas, in untreated control batch the duration was 21.33±0.88 days (Table 2). DFB at higher two concentrations did not produce any significant effect on the larval duration, but at 0.005ppm the period was observed as 25.33±0.88 days (Table 2). TFM produced more severe effect on the developmental time of the larvae than produced by DFM (Table 2).

c) Effect on pupal period: Like the hatching period, TFM at 0.05ppm increased the pupal period more; otherwise in all the treatments the pupae took the same time to develop as took in control batch.

Table 2: Characteristics of rice genotypes under study.

Lupinepublishers-openaccess-Agriculture

***Significant at P<0.001, means with same letter do not significantly differed from each other (Tukey’s Test)

**Significant at P<0.05 and ***P<0.001 levels by ANOVA test

Discussion

BPU compounds are well known for their larvicidal activity against the young age larvae [2,5,8]. The larvicidal effect of either TFM or DFB as reported by different workers in coleopteran species, were the result of gustatory action of the compounds. Grosscurt [14] reported DFB showed that contact action against the lepidopteran eggs. Fox [3] found slight effect of contact action of TFM and DFB against the eggs of other insects. These observations proved the potentiality of these compounds as avicides. In the present study, TFM at concentration levels of 0.1 and 0.05 ppm resulted in about 40% mortal effects against the egg stage, in untreated eggs 20% of the eggs were failed to hatch. Hatching of eggs of Tribolium in untreated medium may often cause due to the effect of temperature, light and humidity [15,16]. Similarly, exogenous materials also affect growth, survivability and developmental time of life stages of Tribolium [17]. Penetrations of treatment of any type into the eggs are rapid during the first 24 hour. TFM and DFB have been reported to cause embryogenesis if they pass within eggs before blastokinesis stage [14]. So, in the present study inhibition of egg hatching in presence of TFM and DFB is quite possible as a function of their contact action.

BPUs are known to act as larvicides against the early larvae. The mature larvae of Tribolium require higher doses to kill [18]. But, the cumulative mortality in the larvae was obtained at significantly low doses in the present experiment. The latent effect of both TFM and DFB reduced the survivability rate at pupal and adult stages of T. castaneum. Longer exposures to BPU compounds have been reported to decrease the emergence of adult Tribolium species [6,19-21,22] and in other species [5,23,24]. In the present study adult emergence was reduced up to 85% in treatment compared to control.

As BPUs inhibit developmental process in the treated insects, longer exposure to these compounds therefore increased effectively the developmental period in insects. In the present experiments the embryonic developmental time and adult developmental were not much affected due to the BPU treatment, whereas the larval developmental time was significantly increased, especially with TFM treatment. Interstingly, highest doses of both TFM and DFB affected the larval period at lesser degree than the other two lower doses. As TFM and DFB are hormone analogues so, they need a definite amount at definite time of the insects’ life to produce effective results. This might be the reason, why the higher concentrations failed to effectively inhibit development in the larval stages of T. castaneum. Such information is lacking in the published reports, so this finding cannot be explained.

Conclusion

The results of this experiment can be concluded as both TFM and DFB are potent candidate as alternative reduced-risk insecticides against T. castaneum. So, the compounds will provide effective control against other stored-products insects pests. Because these compounds inhibit effectively the development and survivability at egg to pupal stages of the holometabolan insects [3].

Read More Lupine Publishers Agriculture Journal Articles:

Saturday 28 November 2020

Lupine Publishers | Digito-palmar Dermatoglyphics as Biomarkers of Dental and Medical Disorders

 Lupine Publishers | Journal of Otolaryngology


Abstract

Digito-palmar dermatoglyphics is the study of the configurations and pattern-frequencies of the epidermal ridges on the palms and finger pads. They are ectodermal in origin, develop in early embryonic life, and remain unaltered throughout the rest of life. Fingerprints and handprints are widely used in criminology. Recently, digito-palmar dermatoglyphics have been utilized as biomarkers for detection of some dental, malignant, chromosomal, skin, ocular, and medical disorders.

Keywords: Dermatoglyphics; Biomarkers; Dental Disorders; Malignancies; Chromosomal Abnormalities; Skin and Eye Diseases; Diabetes Mellitus; Hypertension

Abbreviations: AFRC: Absolute Finger Ridge Count; ALL: Acute Lymphoblastic Leukemia; ANM: Acanthosis Nigricans Maligna; ECC: Early Childhood Caries; FCP: Florid Cutaneous Papillomatosis; OSCC: Oral Squamous Cell Carcinoma; OSMF: Oral Submucous Fibrosis; POAG: Primary Open Angle Glaucoma; THCS: Tel Hashomer Camptodactyly Syndrome; TP: Tripe Palm; TRFC: Total Finger Ridge Count

Introduction

Dermatoglyphics is the scientific investigation of the morphology and pattern-frequency of the skin ridges on the palms, soles and digital pads. They develop from the ectoderm germ layer in early embryonic period and remain stable throughout life. In a previous article, we reviewed the ethnicity-, age-, sex-, and laterality-related variations of digito-palmar dermatoglyphics; their role as predictors of brain disorders was discussed [1]. Here, a review is made concerning the utilization of alterations in the digito-palmar dermatoglyphics as biomarkers for the diagnosis of dental and medical disorders.

Dermatoglyphics In Dental Disorders

In Malocclusion

Craniofacial elements and epidermal ridges are ectodermal structures developed early in embryonic period. Genetic and environmental factors causing malocclusion are also thought to induce morphological alterations in fingerprint patterns; suggesting the dermatoglyphics as an effective tool for prediction of malocclusion [2]. Significantly increased twinned loops and absent radial loops on fingertips were observed in individuals with malocclusions when compared to those with normal occlusions; handprints revealed non-significant alterations [3].

Dental Caries

The epidermis of finger ridges and the dental enamel are ectodermal in origin developing in the same embryonic period, therefore dermatoglyphic patterns were used as a genetic marker for dental caries. Susceptibility to dental caries was observed to be linked to an increased frequency of whorl pattern and decreased incidence of loop pattern.[4] In an investigation on preschool children of Lucknow, India dental caries susceptibility was associated with significantly increased frequency of whorl pattern and significantly decreased frequency of arch pattern, of fingerprints [5]. In Bengalese children with dental caries, there were significantly increased total finger ridge count (TRFC) and absolute finger ridge count (AFRC) in addition to significantly changed frequency of palmar patterns and number of palmar triradii [6]. It has been generally stated that the incidence of whorls in the right index fingertip predicts significantly lower risk of early childhood caries (ECC) in both sexes whereas the incidence of whorls in the right ring fingertip predicts significantly lower risk of ECC in female children [7].

In Edentulous Arches

Digito-palmar dermatoglyphics, in edentulous individuals, were used as an effective tool for predicting the shape of the original dental arch. A significantly increased frequency of loops and a large “atd” angle predicted original square dental arches, a significantly increased frequency of whorls and a small “atd” angle predicted original tapering dental arches, and a significantly increased frequency of loops alone predicted original ovoid dental arches [8].

Dermatoglyphics In Malignancies

Tumors, in general, are associated with alterations in the digito-palmar dermatoglyphics in the form of decreased number of ridges between the triradii of both palms and between the triradii of c-d. Endocrine tumors, in particular, are associated with increased number of arches and decreased number of whorls in addition to different pattern distribution in the I3 and I4 interdigital spaces. Different pattern distribution in I1 and I2 interdigital spaces could point out to the presence of a pituitary tumor [9]. It has been also decided that palmar dermatoglyphics could be of help in discriminating individuals at high risk of oral submucous fibrosis (OSMF) and oral squamous cell carcinoma (OSCC).[10] In both OSCC and OSMF, there were increased frequency of arch and ulnar loop patterns and decreased frequency of simple whorl pattern on fingertips, in addition to decreased frequency of palmar accessory triradii on both palms (in OSCC) and decreased value of “atd” angle and decreased frequency of palmar accessory triradii on right palm (in OSMF) [11]. Palmar “atd” angle was utilized in screening women at high risk of breast cancer. Females with breast carcinoma, when compared with phenotypic healthy controls, showed significant quantitative “atd” angle differences between right and left palms [12].

In another study, carcinoma of female breast was observed to be associated with other digito-palmar dermatoglyphic changes like significantly increased frequency of arch pattern and decreased frequency of radial loops in both thumbs, left index finger and left middle finger. Added to these changes, there were lower values of TFRC and AFRC in conjunction with breast carcinoma [13]. Gastric adenocarcinoma, in a 76-year-old male, was diagnosed to be associated with three types of dermatoses: tripe palms (TP), acanthosis nigricans maligna (ANM), and florid cutaneous papillomatosis (FCP). TP was a yellowish diffuse palmar hyperkeratosis with enhanced dermatoglyphics of both palms, ANM was an extensive hyperkeratotic and hyperpigmented mucocutaneous eruption with exaggerated skin markings and verrucous excrescences and FCP included rapid appearance of multiple wart-like verrucous lesions [14]. Children with acute lymphoblastic leukemia (ALL) exhibited increased mean values of “ab” ridge count and “atd” angle when compared to the controls [15]. Any of the two unusual transverse palmar flexion creases: simian or Sydney-creases was detected , often on both palms, in more than 50% of Caucasian children suffering from malignant neoplasms. In children with ALL, the Sydney-crease was the most commonly encountered abnormal palmar flexion crease [16].

Dermatoglyphics In Chromosomal Aberrations

Palmar dermatoglyphics is known to be a valuable diagnostic tool in genetic disorders. In most palms, when the fingers are slightly flexed, two transverse flexion creases could be seen. In a minority of palms, a single transverse flexion crease may be found in one hand (the simian crease} or the usual two creases are present with one of them traversing across the palm to its ulnar margin (the Sydney-crease). In a group of "at risk" newborns, increased frequency of abnormal palmar creases (simian and Sydney) was determined. A parents' index score, using palmar dermatoglyphics (simian crease and palmar hypothenar pattern), was established as a predictive tool to discriminate parents of Down's syndrome (trisomy 21) children from healthy controls [17-21]. In 22 out of 24 aborted human fetuses, palmar dermatoglyphic alterations correlated well with the amniocentesis- diagnosed chromosomal aberrations: trisomy 21, trisomy 18, trisomy 13, structural autosomal aberrations and sex-chromosome aberration [22]. Unusual changes of the palmar creases in preschool children with psychomotor retardation (not of Down's syndrome origin) were evaluated to be as twice more frequent as their parents and school children [23].

Exposure of the embryo to deleterious environmental factors could lead to diseases that appear later in life and to marked palmar dermatoglyphic dissimilarities in the twins particularly in the III and IV interdigital and hypothenar areas [24]. In both monozygotic and dizygotic twins, the impact of genetic factors on the pattern distribution of palmar dermatoglyphics was decided to be the highest in the III interdigital area and the lowest in the IV interdigital region [25]. In two cases of Marfan's syndrome, simian crease, extra-digital transverse crease, increased “atd” angle, and high position of the axial triradus were reported [26]. In cytogenetically confirmed 46, XY females, the overall fingertip patterns showed increased frequency of ulnar loops and decreased frequency of whorls when compared to control males, their right thumbs revealed decreased frequency of whorls and increased frequency of ulnar loops in addition to decreased TFRC, AFRC, and a-b ridge count when compared to controls of both sexes. Non-significant differences in the “atd” angle, interdigital and hypothenar patterns, and simian and Sydney- creases were assessed between the tested females and their control of both sexes [27]. Tel Hashomer camptodactyly syndrome (THCS), as a rare autosomal recessive disease, is manifested with camptodactyly, clubbed feet, thenar and hypothenar hypoplasia, abnormal palmar creases and dermatoglyphic ridges, spina bifida and mitral valve prolapse [28]. Moreover, other dermatoglyphic changes were observed in the rare cases of THCS like increased frequency of whorl and arch patterns with tendency toward increased TFRC [29].

Dermatoglyphics In Skin Disorders

In vitiligo males, when compared with the controls, there were increased pattern frequency in right hypothenar and thenar areas and in both II interdigital areas, together with decreased pattern frequency in the right III and IV interdigital areas. Vitiligo females revealed increased pattern frequency in right hypothenar and interdigital area I and decreased pattern frequency in right II and left III interdigital areas. Some of these dermatoglyphic variations were statistically significant [30]. In another study on vitiligo patients, when compared with the controls, significantly increased frequency of whorls in males and of arches in females were evaluated. In addition, simian and Sydney- creases, highly significant reduction in TFRC and a-b ridge count, and non- significant alterations in the values of “atd” angle were observed in both sexes [31]. In severe hand dermatitis (eczema), there was a failure of fingerprint verification in 27% of patients compared to 2% of controls. Hand dermatitis, in these patients, was manifested by fingerprint dystrophy and significantly increased number of abnormally long and broad white streaks [32]. Patients with multibacillary leprosy, when compared to controls, showed a significantly increased pattern frequency in the left thenar/1st interdigital area. A highly significant frequency of simian crease was also assessed in palms of both multibacillary and paucibacillary types of leprosy, with non- significant alterations in the values of “atd” angle [33].

Dermatoglyphics In Ocular Disorders

Digito-palmar dermatoglyphic changes were utilized to discriminate between patients with primary open angle glaucoma (POAG) and their immediate (first-degree) relatives from phenotypically healthy individuals. POAG results from abnormal outflow of aqueous humour through the trabecular meshwork of the vascular coat of the eye which develops at the same time as dermatoglyphics [34,35].

Dermatoglyphics In Congenital Disorders

In congenital heart disease (CHD) like Fallot’s tetralogy, patent ductus arteriosus, pulmonic stenosis, and atrial and ventricular septal defects, when compared to controls, there were altered digito-palmar dermatoglyphics like incidence of accessory triradii, missing of “c” triradius, increased TFRC, variations in palmar ridge counts (a-b, b-c, c-d, a-d and t-d, and significantly decreased t-d ridge count [36,37]. In congenital hand anomalies, particularly ectrodactyly and syndactyly, when compared to the controls, there were discriminative changes in the number of digital triradii, the position of an axial triradius, the pattern intensity, and the incidence of hypothenar patterns [38]. Fluctuating asymmetry (a significantly increased variation of the mean values) and increased incidence of ridge dissociation of digito-palmar dermatoglyphics were observed in patients with congenital vertebral malformations, suggesting an insult occurring during embryogenesis that led to these anomalies [39].

Dermatoglyphics In Diabetes Mellitus and Hypertension

In type 1 diabetes mellitus, predictive changes in digito-palmar dermatoglyphics were assessed in the form of decreased third finger ridge count and a-b ridge count, higher transverse position of the main palmar lines , increased frequency of palmar axial t' and t" triradii, and decreased pattern frequency in the fourth interdigital and thenar areas [40]. In hypertensive patients of both sexes, when compared to healthy controls, significant palmar dermatoglyphic alterations were observed like increased TFRC, decreased frequency of axial triradius t’ in female right palms and axial triradii t' and t" in male right palms, and decreased values of “atd” angle [41]. In black Malawian patients, the TFRC was used as a predictor of hypertension and the a-b ridge count as a predictor of concomitant diabetes mellitus and hypertension, in both sexes. Digito-palmar dermatoglyphics displayed absence of whorls in hypertensives of both sexes and in men with concomitant diabetes mellitus and hypertension. Also, there were significantly increased frequency of ulnar loops in hypertensive women and significantly decreased frequency of whorls in women with both diabetes and hypertension more than in women with hypertension alone [42]. In a different investigation, it was determined that the mean value of "atd" angle to be higher and the whorls to be significantly more frequent in hypertensives than in normotensives [43].

Conclusion

Epidermal ridges are developed, from ectoderm, in early embryonic period. Any deviation of their morphological patterns and frequencies may point out to genetic or environmental factors that also negatively impact other body systems. The usage of digito-palmar dermatoglyphics as biomarkers of predisposition to several dental and medical disorders could help in early detection and management of these diseases. It is emphasized that dermatoglyphics should not be used alone as a diagnostic tool but in conjunction with the physical examination of the patients.

Read More Lupine Publishers Otolaryngology Journal Articles:
https://lupine-publishers-otolaryngology.blogspot.com/


Friday 27 November 2020

Lupine Publishers | Isolation and Characterization of Candida Species from Dental Caries in Deciduous Teeth

 Lupine Publishers | Journal of Pediatric Dentistry


Abstract

The present study showed the presence of Candida tropicalis as a mayor fungus isolated of dental caries in deciduous teeth.

Keywords: Dental Caries, C Tropicalis

Introduction

Candida species is the most frequent fungus found in the oral cavity [1]. This microorganism provokes a pathology known as candidiasis in many forms [2], however, this yeast can be found in dental decay lesions, gingival and periodontal disease [3]. Candida albicans is the most frequent species of microorganism in all these lesions [4], however, other Candida species as Candida tropicalis, C glabrata, C. Krusei, C. guillermondii are less present in oral cavity [5]. Dental caries, is the most frequent lesions over world and its etiology is eminently microbial, being the Streptococcus mutans who produce the teeth demineralization and destruction [6]. The main of this study is to isolate and characterize the Candida species from dental caries in deciduous teeth.

Materials and Methods

Fifty children, female and male, from pediatric dentistry of Universidad Andina del Cusco, between 4 and 6 years old with dental caries are selected. Before remove and rehabilitate the dental caries, with a dental spoon excavator it was collected a caries sample and stored in 0.9% NaCl [7]. After that, the samples were sonicated and 100 ul aliquot was placed in CHROM Agar Candida medium (CHRO Magar, Paris, France) and were incubated for 48 hours at 37°C [7]. It followed the CHRO Magar Candida manual instructions to determine the presence of Candida species.

Results

The Candida species most present in the dental caries in deciduous teeth were the C. tropicalis. Other species of Candida are found in less percentages (Table 1).

Table 1.

lupinepublishers-openaccess-journal-pediatric-dentistry

Discussion

Candida species is the most fungus found in oral cavity being the C Albicans the most pathological yeast of the Candida species [4]. This microorganism was found in many oral lesions as candidiasis, dental caries, gingival and periodontal disease [2,3]. Other Candida non albicans are founded in less frequency. However, C. tropicalis and C. glabrata has been described as emerging pathogens in recent years [8]. In the present study, C. tropicalis was presented in the most cases of dental caries in deciduous teeth, being this data corroborated with other studies who the main pathogen is the C. tropicalis. Most studies, in fact, found that the C. albicans as the mayor pathogen isolated from dental caries [6,9,10]. This difference of data can be explained by the geographical location of patients where Candida species can be found in amounts depending on the geographical area. In this study, other Candida species, can be found in less amounts. Despite limitations, the data obtained in the present study demonstrated the high rate of C. Tropicalis in dental caries in deciduous teeth, however, has not been determined which factor is involved in the pathogenesis of dental caries produced by C. tropicalis. It is also important study the oral microbiome in dental caries to dilucidated the role of Candida species, mainly C. tropicalis, in the development of dental caries in deciduous teeth.

Conclusion

Candida tropicalis is the most fungi founded in dental caries lesion in deciduous teeth in child between 4 and 6 years old.

Read More Lupine Publishers Pediatric Dentistry Journal Articles:
https://lupine-publishers-pediatric-dentistry.blogspot.com/

Wednesday 25 November 2020

Happy Thanksgiving!!!


Happy Thanksgiving from our Lupine Publishers! May this special occasion bring your family closer and bless the bond of love! May God keep blessing you and fulfill all your wishes and dreams.

Lupine Publishers |Yield Stability of Very Early Rice Genotypes Under Rainfed Upland Ecosystem

  Lupine Publishers | Current Investigations in Agriculture and Current Research


Abstract

A field experiment was carried out at All India Coordinated Research Project for Dryland Agriculture, Orissa University of Agriculture and Technology, Phulbani to evaluate the newly developed early maturing rice genotypes and estimate their yield stability. The trial was laid out in randomized block design with three replications for 5 years from 2012 to 2016 involving 26 rice genotypes including-(a) 22 improved lines from AICRP for Dryland Agriculture, OUAT, Phulbani (ODR lines; ODR denotes ‘Odisha dryland rice’), (b) one line from NRRI sub-centre, Hazaribag, DDR-121, (c) one exotic variety, ZHU 11-26 and (iv) two varieties from NRRI, Cuttack, Vandana and N-22. Another set of experiment was carried out at ICAR-National Rice Research Institute, Cuttack to evaluate the response of the genotypes towards drought stress. Highest mean grain yield was recorded in ODR 12-3 (30.43 q/ha) followed by ODR 12C (27.42 q/ha) and ODR 41 (27.22 q/ha). ODR 12C exhibiting high mean yield along with highest slope can be considered most adaptable. Long slender aromatic genotypes such as ODR 1, ODR 1-1, ODR 1-2 and ODR 1-3 had also high yield coupled with slope >1.0, thus exhibited high stability. Drought score (DS), performed on the basis of Standard Evaluation System (SES) scale, showed that ODR-55(1) is highly drought tolerant on the basis of leaf rolling and drying character (SES=0).

Keywords: Rice; Rainfed; Drought score; Yield stability

Introduction

Rice is the staple food for over 90% population of the Asiatic countries. It is the principal source of energy for the people of Asia, Latin America and pacific islands [1]. It has a distinct position among cereal crops due to its capacity for being cooked and consumed as whole grains [2] and quality assumes great significance. It is also the source of livelihood for a majority of people of India, China and some other countries. Rice cultivation is one of the major providers of rural employment. However, shortage of water in many rices growing countries of the world is gradually increasing with simultaneous decrease in crop yield [3]. Upland rice, covering over 9 million hectares in Asia, is subjected to multiple abiotic stresses, drought being the number one, occurring almost regularly, limiting crop productivity and farmers’ income. In this context, increasing productivity of rice in all eco-systems assumes a great challenge as one-sixth of the global population is deprived of enough food and remains hungry or under-nourished.

Since the commencement of green revolution during late 1960s, rice production in India has become trebled and it is important to maintain the increasing trend in future. However, rice cultivation is considered non-remunerative in many parts of India particularly in rainfed uplands due to frequent crop failure during long dry spells. Still then, in several locations of the states like Odisha, West Bengal, Chhatisgarh, etc. people are reluctant for crop diversification in uplands during kharif (S-W monsoon) season and traditionally grow rice. Many farmers use local short durational rice varieties which mature in 80-90 days and escape terminal drought. In years with early or mid-season drought, these varieties fail to give satisfactory yield. Again, long slender scented rice varieties which could fetch high market price are not available for upland situation.

Rice is the main crop of Odisha including hilly districts like Kandhamal and is grown in all types of land. In Kandhamal district, 80% of the cultivated area is upland without irrigation facility where only short durational drought tolerant/escaping genotypes can be grown. The productivity of local variety is low. In N-E ghat zone of Orissa, the annual rainfall is quite high (above 1400mm), but the distribution is quite erratic and dependable monsoon occurs only for 3 months. Due to sandy/sandy-loam soil texture in uplands, rice crop suffers severely from dryspells lasting for a week. Again, the yield and quality of local type of rice grown in uplands of Kandhamal is not so good from marketing point of view. Thus, availability of short durational, drought tolerant, high yielding and good quality rice variety which will be acceptable by the farmers is needed to increase the net income. Therefore, crop improvement programmes were initiated at All India Coordinated Research Project for Dryland Agriculture from 2006-07 to develop suitable rice varieties for rainfed upland system. The present investigation highlights the yield stability of twenty-six rice genotypes suitable for upland with required features like 1. Short duration, 2. Long slender aromatic grain (Basmati type), 3. High yield, 4. Drought tolerance, and/or 5. Disease pest resistance in order to assure high and stable yield as well as better price for the produce.

Materials and Methods

Site description: The soil at the experimental site had Sandyloam Texture with pH 5.22 and average N, P2O5 and K2O content of 123, 32.1 and 164.9kg/ha, respectively. The normal rainfall of the location is 1407.34mm. The annual and cropping season rainfall with dry spells affecting growth and productivity at the experimental site in different years has been presented in Table 1.

Table 1: Rainfall at Experimental site with dry spells.

Lupinepublishers-openaccess-Agriculture

Planting material

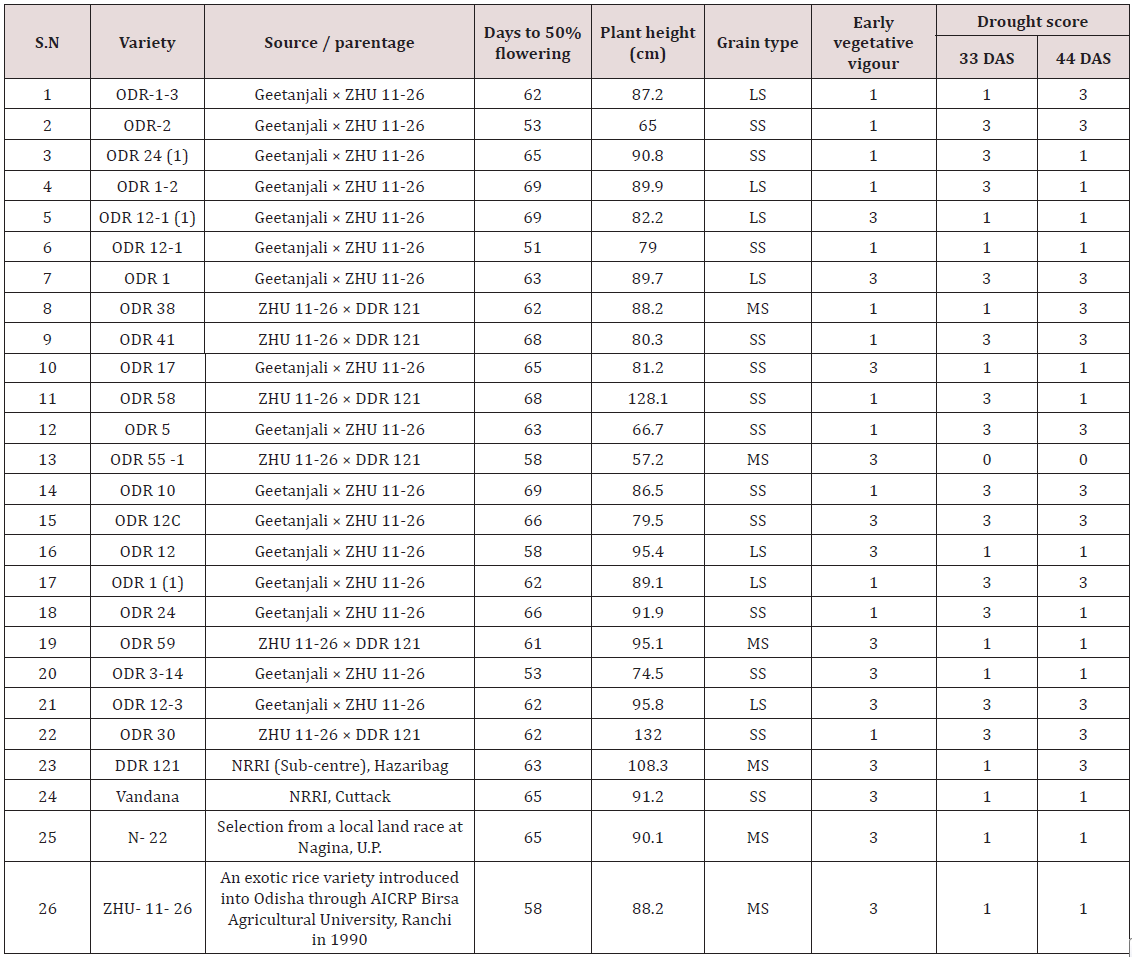
Twenty-six rice genotypes including 22 improved lines from AICRP for Dryland Agriculture, OUAT, Phulbani (ODR lines; ODR denotes ‘Odisha dryland rice’), one line from NRRI sub-centre, Hazaribag obtained for evaluation during 2004 (DDR-121), one exotic line from Birsa Agriculture University obtained for evaluation during 1990 (ZHU 11-26) and two lines from NRRI, Cuttack (Vandana and N-22) generally considered as drought tolerant checks, were utilized in the present investigation (Table 2). ZHU 11-26 and DDR-121 were parents of ODR lines. Geetanjali, although a parent, was excluded from this study due to medium maturity duration (130 days). It was used in the hybridization programme for transferring the grain characters (long slender aromatic). Pedigree method of breeding was followed to develop ODR lines.

Experimental plan

The test genotypes were grown under rainfed upland situation during kharif season in the research farm of AICRP for Dryland Agriculture, OUAT, Phulbani for 5 years from 2012 to 2016. The experiment was laid out in randomized block design with three replications. The crop was sown in lines 20 cm apart during last week of June with a fertilizer dose of 60-30-30 kg N-P2O5-K2O. Recommended agronomic practices were followed to raise the crop. A separate experiment was conducted at National Rice research Institute, Cuttack during 2016 to elucidate the reaction of genotypes to drought stress under rainout shelter. Data on early vegetative vigour and drought stress at 33 and 44 days after sowing were recorded (Table 2). Drought stress tolerance was measured in 0-5 scale; 0=very high drought tolerance, 1=high drought tolerance, 3= moderate drought tolerance, and 5=drought susceptible.

Table 2: Characteristics of rice genotypes under study.

Lupinepublishers-openaccess-Agriculture

Data analysis

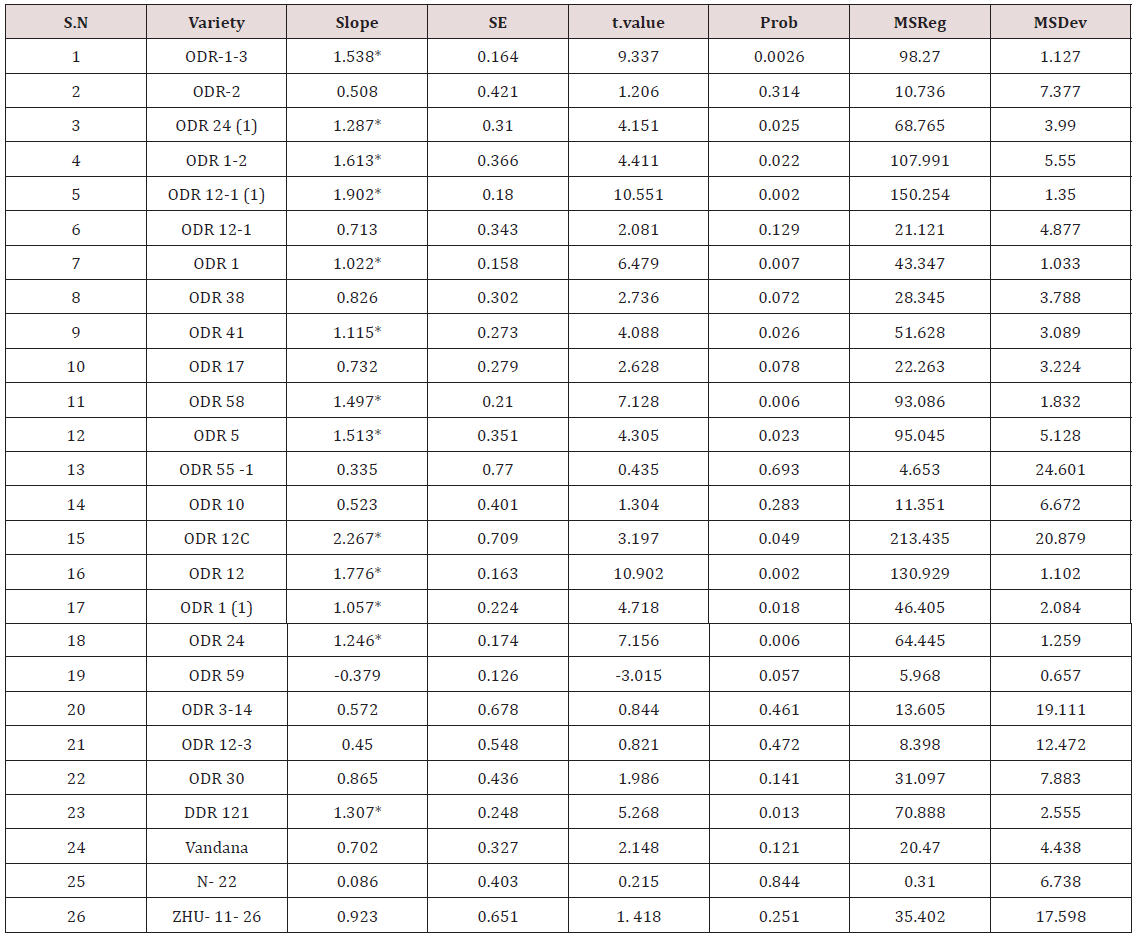
The grain yield data over five years was utilized for stability analysis following Finlay Wilkinson model (1963) [4] using PB Tools, version 1.4. 2014 developed by IRRI, Philippines [5]. As per this model, slope of the regression is a measure for adaptability. The average slope equals unity, indicating average adaptability; genotypes with slopes > 1.0 have higher than average adaptability (with greater resistance to environmental changes); and genotypes with slopes < 1.0 have lower than average adaptability.

Results and Discussion

Drought is a serious abiotic stress for rice production and many popular varieties are drought susceptible [6]. Research on quantitative trait loci (QTL) conferring drought tolerance show that QTLs, primarily contributing towards stable yield under drought stress directly or via secondary traits such as root characteristics and leaf rolling, have relatively small effects and different QTLs have been detected in different studies [7,8]. Some QTLs help in significantly increasing water uptake under drought stress and stabilize grain yield [9,10]. Attempts have been taken to identify such useful QTLs in crosses involving popular varieties like Swarna to increase their potential for cultivation in drought-prone environments [11]. Among different genotypes, ODR 12-1 took minimum number of days to 50% flowering closely followed by ODR-2 and ODR-3-14 (Table 2). Three genotypes flowered within 55 days, three between 55-60 days, 13 genotypes between 60- 65 days, and rest 7 genotypes between 65-70 days. ODR-1, ODR- 1-1, ODR-1-2 and ODR-1-3 had long slender grains with aroma, thus expected to fetch better market price. They took less than 65 days for 50% flowering and possessed high or moderate drought tolerance.

Table 3: Grain yield of new rice genotypes at DLAP (OUAT), Phulbani during kharif, 2012 to 2016.

Lupinepublishers-openaccess-Agriculture

Table 4: Stability parameters based on Finlay-Wilkinson Model.

Lupinepublishers-openaccess-Agriculture

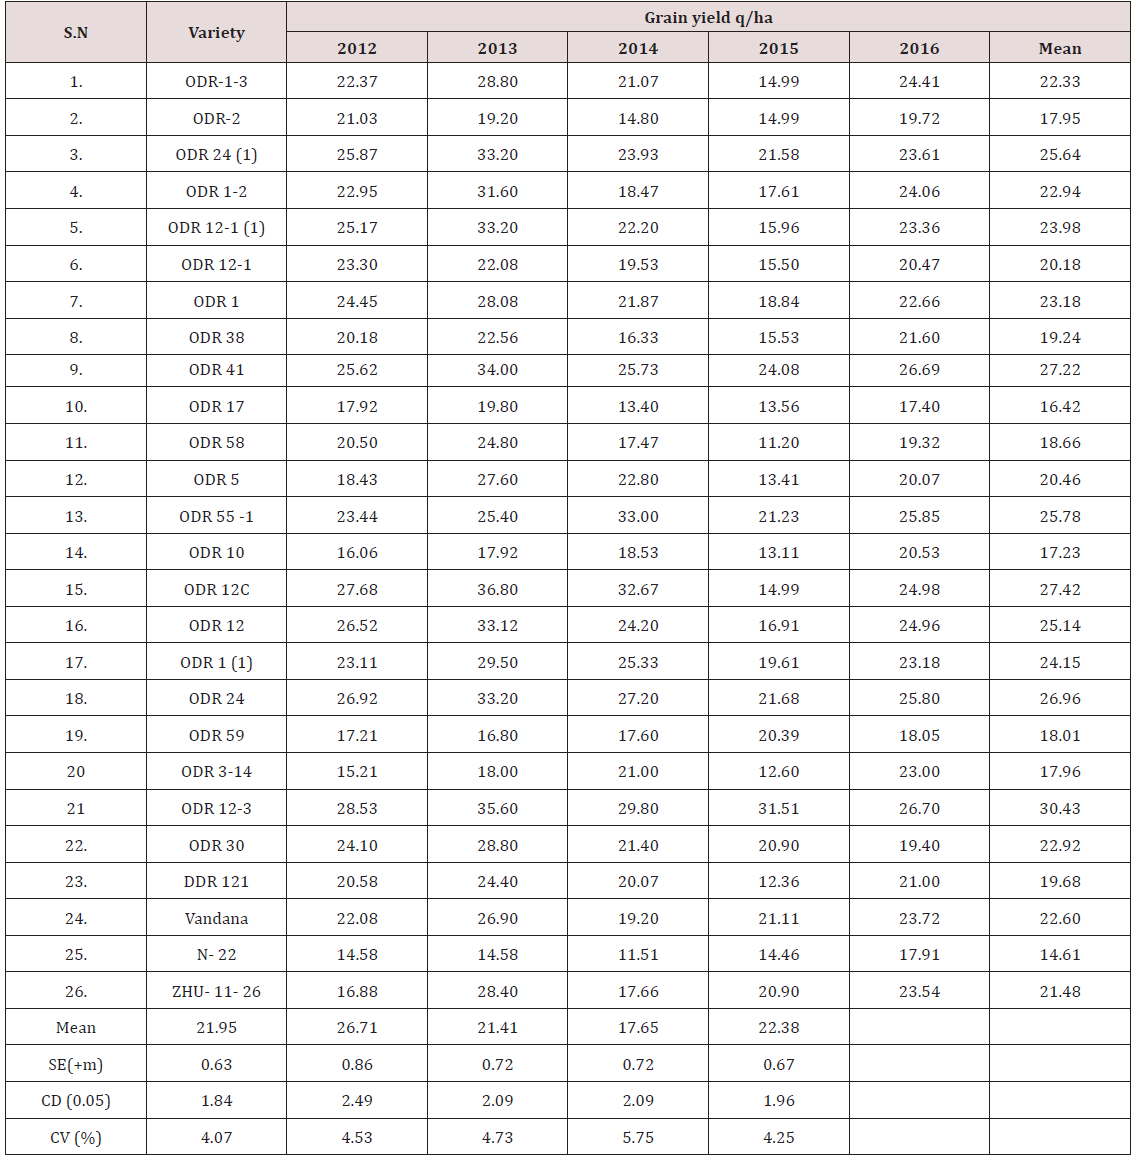
The plant height of different genotypes varied from 57.2 cm in ODR 55-1 to 132 cm in ODR-30. All genotypes had slender grains and were grouped into three categories, such as long slender (LS), medium slender (MS) and short slender (SS). In spite of quite sufficient crop seasonal rainfall in several years, the distribution was erratic with dry spells at critical growth stages that could affect the crop growth and productivity. Significant variation was observed among the test genotypes for grain yield in all the five years (Table 3). Highest mean grain yield was recorded in ODR 12-3 (30.43q/ha) followed by ODR 12C (27.42q/ha) and ODR 41 (27.22q/ha). ODR 12C exhibiting high mean yield along with highest slope (Table 4) can be considered most adaptable. Long slender aromatic genotypes such as ODR 1, ODR 1-1, ODR 1-2 and ODR 1-3 had also high yield coupled with slope >1.0, thus exhibited high stability. Under rainfed upland ecosystem, availability of such high-quality genotypes seems to enhance profitability of rice farming particularly of tribals in hilly tracts. Among these 4 types, ODR 1-2 had high drought tolerance at 44 days after sowing under rain out shelter situation and thus could be advocated for drought prone areas. All other genotypes having comparatively higher grain yield and slope > 1.0 may also be recommended for rainfed uplands.

A crop like rainfed (kharif) rice is more sensitive to rainfall than temperature. In future, water availability is likely to be reduced and soils of high water holding capacity [12] and use of drought tolerant varieties may play an important role in maintaining crop yield. Drought score (DS), performed on the basis of Standard Evaluation System (SES) scale, showed that ODR-55(1) is highly drought tolerant on the basis of leaf rolling and drying character (SES ‘0’). Since the phenotypic performance of a variety may not be same under different agro-ecological situations due to the influence of environment on genotype, information on phenotypic stability holds a great promise. Stability of a variety enables it to remain unaffected by environmental changes [13]. The aromatic long slender rice genotypes are expected to increase the net income of farmers due to high market price of the produce. Almost 100 volatile compounds have been reported to be responsible for basmati flavor which includes 13 hydrocarbons, 14 organic acids, 13 alcohols, 16 aldehydes, 14 ketones, 8 esters, 5 phenols, etc. [14,15]. The principal compound responsible for aroma, 2-Acetyl- 1-pyrroline (2AP), has been detected in the whole above ground plant parts of scented rice [16,17]. In addition to 2AP, several other volatile compounds contributing to the aroma of scented rice cultivars, such as hexanal, nonanal, octanal, decanal, guaicol, indole and vanillin, have been identified [18, 19]. Even in absence of the estimates on aroma, the aromatic long slender genotypes used in the present study with high drought tolerance and stability need attention for rapid spread across locations.

Conclusion

The present investigation highlights the stability of new rice genotypes varying in grain type, aroma, duration and grain yield to justify their suitability for cultivation in rainfed uplands. The genotypes exhibiting 50% flowering within 55 days are expected to escape drought, frequently occurring towards end of monsoon season although they may not possess adequate drought tolerance. The genotypes with high mean grain yield, slope >1.0 and good grain quality like ODR 1-2 are to be adopted for rainfed upland conditions of Odisha in order to improve the economic condition of rice farmers.

Read More Lupine Publishers Agriculture Journal Articles:

Tuesday 24 November 2020

Lupine Publishers | Information and Communication Technology Roles in Improving Women Farmers Access to Agricultural/Agribusiness Services in Orlu Agricultural Zone of Imo State, Nigeria

 Lupine Publishers | Current Investigations in Agriculture and Current Research


Abstract

This study examined Information and Communication Technology (ICTs) roles in improving women farmer’s access to agricultural services and agribusiness in Orlu Agricultural Zone of Imo State. Data were collected with structured questionnaire distributed to 110 respondents randomly selected from the 10 extension blocks in Orlu Agricultural zone. Data collected were analyzed using percentages, mean scores and standard deviation. The results obtained showed that ICT devices available in the area included radio, mobile phones, television and newspaper among others. However, mobile phone is the most readily available (ICT) device (87.3%), followed by Radio (74.5%). It was also observed that ICTs play significant roles in improving women’s access to agricultural service and agribusiness as as indicated by a mean score of 2.50 Several factors constrained the use of ICT devices. Among these factors were; network problems/connectivity(M=4.00), high cost of ICT devices (M=3.47), widespread illiteracy (M = 2.96), low level of awareness (M=2.55), poor saving ability (M=2.47), insufficient income (M=2.12), and language illiteracy (M=2.00). This study thus recommended that government should provide rural infrastructure especially electricity supply, good road network etc in the study area, establishment of ICT centers where farmers can acquire practical computer training for the enhancement of ICT use. Information on agricultural services and agribusiness should be made available to farmers through their mobile phones in their local language and it should be timely for effective utilization.

Keywords: Agriculture; Agribusiness; ICTs; Farmers; Services; Market; Women

Introduction

Globally, agriculture takes center stage as the engine that can transform nations’ economies. Similarly, the place and role of smallholder farmers from local to global levels are recognized by the respective governments and international partners as a way to avoid age-old problems like hunger and miserable lives. Currently, it is believed that smallholder farmers can feed the world’s undernourished people [1,2]. Accordingly, agriculture employs about 62% of the population in SSA (excluding South Africa) and generates about 27% of the Gross Domestic Product [3]. Agriculture accounts for the vast majority of the poor’s livelihood activities and also holds the most promise for pro-poor economic growth [4]. Smallholder farmers, mostly women, who produce the majority of agricultural products, face various challenges, including access to adequate information, services, and key value chains [5]. Many women experience a life that is a complex web of multiple roles and multi task. This requires an average woman to conduct different roles at different times in a bid to fulfill her family needs. Women especially those in the rural areas are extensively involved in serious farm operation and agricultural activities. Women make up over half the agricultural labour force, yet they are frequently subject to discrimination. They play a vital but under-recognized and unsupported role in food production. Looking at the national average of women in the agricultural labour force, they vary but globally they have a principal role in agro business, food processing and consumer related activity [6].

In Nigeria, women consist 60 – 80 percent of labour in agriculture starting from production, processing and marketing of food. These women have their own farms and also assist in the family farms [6]. This has made the Nigerian women to be in a position to contribute to food supply. Despite outnumbering the men farmers, they are still not usually seen as the “typical farmer” by policymakers and administrators such as extension officers and are therefore often bypassed by agricultural services [7]. Women’s potential to become successful farmers have also been limited due to the fact that they are facing many other obstacles and challenges such as lack of access to productive resources, information and credit [8]. In addition, women’s social networks are often more local, connected to the rural village and therefore often more restricted than men’s, whose mobility is often greater and reaches outside the borders of the village. Since most information channels in Nigeria and Africa are built on social networks, women’s networks offer fewer opportunities for learning about, as well as engaging in, new productive opportunities and strategies, leading to underperformance of the sector, which is bad for the country and rural development at large [9]. There lies both an instrumental and intrinsic value in enabling women to optimize their production to the same extent as men [8]. When it comes to the former, research shows that women’s agricultural productivity can increase around 20-30 percent, if women would get the same kind of access to productive resources that men have.

Optimizing women’s production should be equally important based on a gender equality perspective and rights-based approach, because they should have the same right to be as productive as men, which in the end would benefit the whole country at large by reducing poverty and hunger. Applying ICT solutions could be a way to “extend the reach of existing information channels thus overcoming barriers women farmers face in accessing information” [9]. A number of studies have shown that ICT can have a positive impact on rural livelihoods and farmers, whether it is by encompassing or by accessing vital market information on a mobile phone [10,11], or by generating thematic maps and online applications to monitor the spread of agricultural pests [12]. In agriculture, information is a critical factor that has always mattered, and even though farmers may have undertaken the same activities for years, decades or even centuries, producers have not always found it easy to obtain answers when conditions for them have changed [13]. Usually for many farmers in low-income countries, information is obtained through a complex web of social networks [9]. Applying modern Information and Communication Technologies (ICTs) such as mobile phones, radios, TVs and Internet services in agriculture may offer a new way of sharing information and knowledge amongst farmers. But due to prevailing inequalities in accessing ICTs, many groups in low-income countries are often left out from using ICTs, especially women [14]. The inequality experienced by women is often referred to as the “gender digital divide”, as empirical evidence shows that women have worse access to, and use ICT less, than men, both in rich and poor countries [11].

Communication is indispensable for all endeavors to bring about a societal change. The emergence of information communication technology (ICT) has enabled to collaborate, interact and information in a fast pace which has brought a greater impact on society. The ICT is a diverse set of technological tools and resources to create, disseminate, store, bring value addition and manage information [15]. ICTs do play an important role in disseminating a wide range of information and advice leading to knowledge and attitude change among rural communities. It is also supporting rural communities to acquire new skills and is also creating new employment opportunities.

Statement of Problem

Increasing production is a major challenge facing present agriculture. Smallholder farmers which dominate the landscape of developing world need to improve farming through acquiring adequate knowledge and information [16]. Farmers exhibit ambiguous risk-averse behavior when they lack information pertaining to the likelihood of occurrence of the possible outcomes of new technology, which might have a detrimental impact on adoption (Tessema, 2016). A mix of several factors prevents the adoption of new agricultural technology and innovation by farmers and involves the level of education, individual risk preferences, capital, perception, as well as inputs such as land, labour and credit, as well as access to information [16]. Relevant and suitable information on best practices, new technologies, postharvest handling, and value-addition are key in order to boost productivity [5]. According to Asayehegn (2012), in Ethiopia most agents use individual extension methods (farm or home visits and use of contact farmers) to communicate and to disseminate agricultural technologies to farmers. Agents are also working under areas characterized by lack of infrastructural facilities such as transportation. This situation is the same in Nigeria where conventional extension methods such as farm or home visits and the use of contact farmers do not provide the needed agricultural information on timely basis (Deribe.K, 2011).

The impact of mobile phones on development will, however, in the end be determined not only by the number of owners of SIM cards and subscription rates, but also by the actual ways in which mobile phones are used and the benefits that Africans derive from using mobile phones (Bornman, 2012). Again, due to the high extension agent farmer ratio, it is practically difficult to reach the farmers by face-to-face or individual contact methods. The abovementioned problems call for the use of ICTs to support agricultural extension services, because ICTs, particularly mobile phones, can be very effective in delivering timely and relevant information to farmers, even to those living in remote areas. Though the potential of mobile phones is vast, little is known regarding the use of mobile phones in agriculture among women farmers in Nigeria.

Objectives of the Study

The main objective of this study is to analyze the roles of information communication technologies (ICTs) in improving of rural women farmers’ access to agricultural services and agribusiness in Imo state. The specific objectives of this study include to: a. identify ICT devices available to women farmers; b. identify agricultural services available to respondents in the area; determine the roles of ICTs in improving women access to agricultural services and agribusiness; and c. examine perceived constraints to respondents use of ICT devices in the area.

Methodology

The study was carried out in Orlu agricultural zone of Imo state, South-east Nigeria. Imo state is having three agricultural zones namely; Okigwe, Owerri, and Orlu (ADP, 2003). Orlu agricultural zone is made up of eleven (11) LGAs namely; Njaba, Nwangele, Orsu, Oru west, Orlu, Nkwere, Oru east, Oguta, Ideato north, Ideato South and Isu. The state lies within latitudes 4°45°N and 7°15°N and longitude 6°50°E and 7°25°E with an area of around 5,100sq/ km. It is bordered by Abia state on the East, by the River Niger and Delta state on the west, by Anambra state to the North, and River state to the south (IMSG, 2001). The estimated population of Imo state as of 2018 is 5.8million with a population density that varies from 230-1,400 people per square kilometer (NPC,2006). The rainy season spans from March to October and is bimodal with a twoweek break in rainfall in August (August break). The main annual rainfall in the state is between 25°c and 28°c with relative humidity of about 98% during the raining season and between 50% and 60% during dry season. The major arable crops grown are Cassava, Yam, Plantain, Banana, Maize, Melon, Sweet potato and Vegetables such as Okra, pepper, tomato and telfaira (ADP,2003).

Sample and Sampling Technique

Orlu agricultural zone has 10 extension blocks and 107 extension circles manned by extension agents. All ICT women user farmers in the zone constitute the population of the study. A list of all registered ICT women user farmers in the zone was obtained from ADP office in the zonal headquarters. The list has a total number of 1,100 ICT women user farmers and 10% of the total number was randomly selected which gave a total sample size of 110 ICT women user farmers.

Method of Data Collection

The study made use of both primary and secondary data. The primary data were collected from field investigation or survey using structured questionnaires and interview schedule. Secondary data sources were utilized to provide background information and other, necessary to achieve some objectives of the study. Such secondary data includes textbooks, reports, journals, publications and proceedings. Enumerators were trained and used.

Method of Data Analysis

Basically, data were analyzed using descriptive statistical tools such as mean, standard deviation, bar graph and percentages. This was used to analyze all objectives of the study. A four (4) point liker type scale of strongly agreed (SA), agreed (A), disagreed (D) and strongly disagreed (SD) assigned values of 4,3,2 and 1 was used to achieve objective 3. The scores were added together to give 10 and was divided by 4 to give a discriminating index of 2.50. Therefore, a mean of 2.50 and above was adjudged okay and accepted as role of ICTs in helping women farmers gain access to agricultural services while any value between 2.50 was not accepted. While objective (4) was analyzed on a 4 point like type scale of very important constraints (VIC), important constraints (IC), less important constraints (LIC), not important constraints (NIC) assigned scores of 4,3,2 and 1, added together to give 10 and divided by 4 to give a discriminating index of 2.50. Mean values 2.50 and above were taken as constraints while mean values below 2.5 were not constraints of ICT use in gaining access to agricultural services.

Results and Discussion

ICT devices available to women farmers

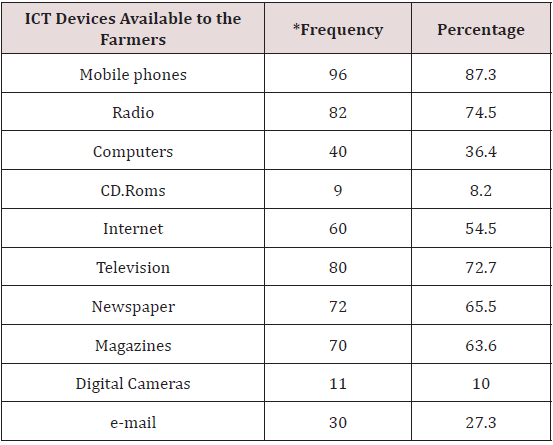
Table 1 showed the different ICT devices available in the study area. Mobile phones, radio and television are the most available ICT devices in the study area with a percentage of 87.3%, 74.5% and 72.7% respectively. This means that these devices are the most common sources of technological information and dissemination of innovation in the area. Newspapers with 65.5%, magazines and internet with percentage of 63.6% and 54.5% respectively also indicate that information can be sourced through them. Computer and E-mail with percentage of 36.4% and 27.3% respectively are also sources of information. On the other hand, digital cameras which has a percentage of 10 is not readily available to everyone. This could be due to high cost or illiteracy of the respondents. CDRoms have the least percentage of 8.2%. Not many people have this device.

Table 1: shows the ICT devices available to the farmers.

Lupinepublishers-openaccess-Agriculture

Source: Field survey data 2017. *Multiple responses.

The above agrees with Singh et al (2015) reported that Agriculture Information System (AIS) is a computer-based information system which contains all the interrelated information which could really help farmers in managing information and policy decision making. The ICT devices that help facilitating farming activities encompassed applications like radio, television, cellular phones, computers, tablets and networking, hardware and software, satellite systems [17,18]. In the same way, Yimer [19]; Munyua [17] reported that radio is extensively used to inform users on agricultural topics, including new and upgraded farming techniques, production management, and market information. This shows that farmers may take advantage of using radio in the absence of technology especially rural farmers. The Internet and web-based applications are extensively used in sharing and dissemination of agricultural knowledge, marketing of goods and services.

Agricultural/agribusiness services in the study area

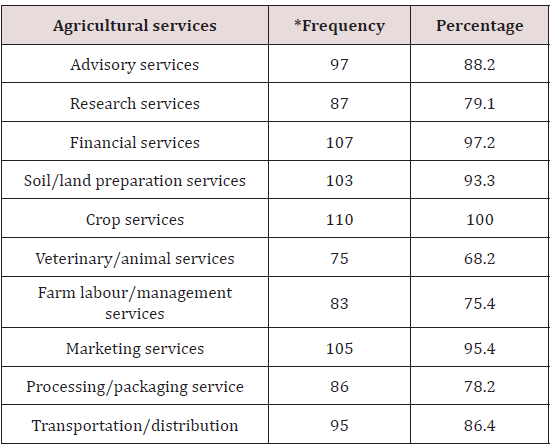
Table 2 showed that numerous agricultural/agribusiness services that exist in the study area. These services included advisory services (88.2%), research services (79.1%), financial services (97.2%), and market services (95.4%). Advisory services here means that farmers need advice on a variety of agricultural business opportunities to be explored. They need information on solving farm problems, training/education, among other services. Research services here means that farmers should be kept abreast of the latest developments/innovations in agriculture. Their problems need to be solved by research institutes which serve as centres of innovations who proffers solution and get back to them through communication with the change agent. Financial serves are very important in agric-business for farmers to optimize production and maximize income. They need credit, savings, payments/transfer and also insurance to cover crop and livestock losses. Market is important for farmers to improve their production systems, so they can fetch better prices, avoid gluts and have what it takes to grow market-led crops.

Table 2: Agricultural/agribusiness services of respondents.

Lupinepublishers-openaccess-Agriculture

Source: Field survey data 2017. *Multiple responses.

Other services include soil/land preparation (93.3%) and crop production services (100%). Soil preparation services includes plowing, application of fertilizer, seed bed preparation and other services for improving the soil for crop planting, while crop services includes crop planting, cultivating and protecting, cultivation services, disease control of crops, entomological services, irrigation system operation systems, orchard cultivation services, seeding crops, pruning of orchard trees and vines, and weed control); crop harvesting by machine; crop preparation services for market. Animal/veterinary services (78.2%), and farm labour service (75.4%), includes animal hospitals, veterinarians and veterinary services for livestock, and animal hospitals, veterinary services for pets. Animal services, including livestock services (e.g., artificial insemination services, livestock breeding, milk testing, cattle spraying, vaccinating livestock, sheep dipping and shearing, and custom slaughtering) and animal shelters. Farm labor and management services includes farm labor contractors and crew leaders, and farm management services; and processing/ packaging services (78.2%) and transportation/ distribution services (86.4%) (e.g., sorting, grading and packing of fruits and vegetables, grain cleaning and fumigation, drying of corn, fruits and vegetables); and cotton ginning.

ICT roles in improving access to agricultural/ agribusiness

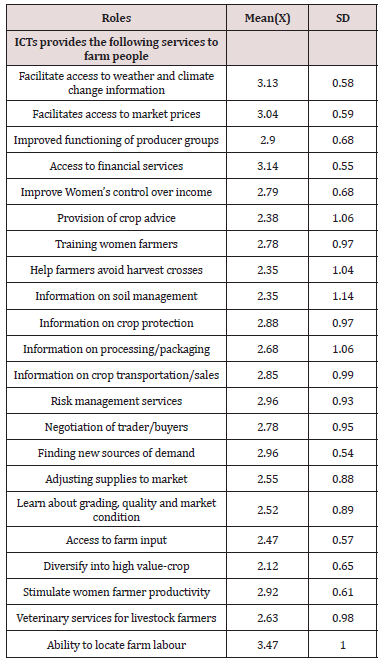
ICTs play great roles in providing access to agriculture services to women farmers. With a discriminating mean (M) index of 2.50, ICTs play the following roles - ability to locate farm labour (M = 3.47), which is usually done by making voice calls on the person, gain access to financial service (M = 3.14), which includes information on credit, loan and levies, facilitate access to weather and climate change information (M = 3.13), access to market prices (M = 3.04), risk management services(M= 2.96), finding new sources of demand (M = 2.96), improved functioning of producer groups (M = 2.90), information on crop protection (M = 2.88), information on crop transportation\sales M = 2.85, improved women’s control over income (M = 2.79). Speaking on the importance of ICTS in providing access to agricultural and agribusiness services, Chavula (2012) said ICTS help extension workers and researchers to adopt improved agricultural practices and disseminate them to farmers. They provide agricultural information that is relevant to farmers such as agricultural and farming techniques, commodity prices and weather forecasts to farmers. The utilization of ICTS especially mobile technologies help agricultural producers who are often unaware of commodity process in adjacent markets and rely on information from traders in determining when, where or for how much to sell their produce to have relevant and timely information to this regard. Delays in obtaining this information or its misinterpretation by traders has serious consequences for agricultural producers, leading to charging low prices or high/low produce supply in the markets [20]. Other areas were training women farmers (M=2.78), negotiating with trader\buyers (M=2.78), information on processing\packaging (M=2.68). Akor and Mbiti (2010) opined that ICTS facilitates information flow and can have communication between buyers and sellers leading to lower communication costs, thereby allowing individuals and firms to send and acquire information quickly and cheaper (Table 3).

Table 3: Roles of ICT in Agricultural services/Agribusiness.

Lupinepublishers-openaccess-Agriculture

Field survey, 2017 Mea score 2.50 and above accepted.

This makes market operate more efficiently, hence increase the overall production in agricultural sector and growth of the economy as a whole [21]. ICTS facilitates agricultural growth because they increase the efficiency of market interactions and provide access to real-time information mainly by enhancing farmers access to use of trading platforms over the internet through web/mobile application [22]. Finally, veterinary services for livestock farmers (M=2.63), adjusting supplies to market (M= 2.55), learn about grading, quality and market condition (M= 2.52), provision of crop advice (M= 2.38), access to farm input (M= 2.47), information on soil management (M = 2.35), help farmers avoid harvest losses (M = 2.35), diversify into high value crop (M= 2.12) and finally, stimulate women farmers productivity (M= 2.92). ). They allow people to obtain information immediately on a regular basis as compared to other information channels. The utilization of ICTS especially by using mobile phones reduces search costs, improve consumers welfare and reduces trade/market monopoly if not complete disruption of the monopolistic idea/practices.

Problems facing respondents use of ICT devices

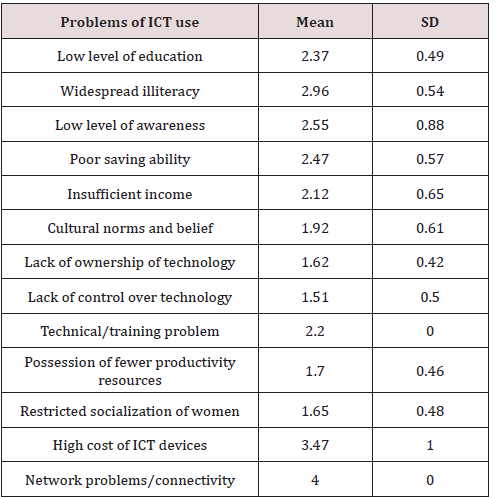
Table 4 showed that numerous problems face respondents in use of ICT devices as indicated by high mean (M) responses, which includes- network problems/connectivity (M=4.00), high cost of ICT devices (M = 3.47), widespread illiteracy (M = 2.96), low level of awareness (M =2.55), poor saving ability (M 2.47), insufficient income (M=2.12), technical/training problems of farmer part (M=2.20). This affirms FAO (2000) stand that the update and harnessing of information is limited by the lack of trained personnel or lack of access to know how. Other constraints that also faced respondents use of ICT devices included; cultural norms and belief (M = 1.92), possession of fewer productivity resources (M=1.70), restricted socialization of women (M= 1.65), lack of ownership of technology (M=1.62), lack of control over technology (M= 1.51) and low level of education (M = 1.37). The above agrees with previous studies that inadequate, and unstable power supply, cost of hardware and software are high with respect of average rural dwellers [23]. Similarly, Taragona [24] maintains that awareness, time, cost of technology, system integration, and software availability are the main constraints of ICT adoption in horticulture.

Table 4: Problems facing respondents’ use of ICT devices.

Lupinepublishers-openaccess-Agriculture

Field survey 2017. Mean response 2.50 and above accepted.

Conclusion

From the study, one can conclusively say that mobile phones, radio and television were the most accessed and utilized ICTs devices among the respondents. However, the extent of access and utilization of contemporary ICTs devices such as CD-Roms, digital camera are still very low. There was a high perception of positive effect of ICT in improving women’s access to agricultural services and agribusiness, however, the use of these ICT devices are limited by some factors. Therefore, there is need to encourage ICT user farmers in the area, by making available all that are necessary for successful ICT usage. Including training in order to promote maximum gain and utilization of technological information which will lead to improved access to agricultural services thereby improving farmers practices, increased productivity as well as bettering standard of living of the farmers.


Read More Lupine Publishers Agriculture Journal Articles:

Monday 23 November 2020

Lupine Publishers | Allele Mining for the Reported Genes Governing the Yield Related Traits in a Set of Rice Germplasm Using PCR-Based Markers

    Lupine Publishers | Current Investigations in Agriculture and Current Research


Abstract

The present study was an initial attempt towards enhancing grain yield in rice through molecular breeding approach by allele mining. Forty one diverse rice genotypes were used for allele mining study with an objective to detect among them superior alleles for rice grain dimensions viz. grain length, grain width, grain thickness, grain size and grain weight. SSR markers associated with reported genes for these traits were used for PCR amplification. It was found that SSR primer RDD 1-2 can be used for identifying alleles enhancing grain length from diverse genomic sources for crop improvement. The allele A (600 bp) from Rdd 1 can be used in breeding programmes to enhance grain length in rice. The genotypes viz. Hans raj, Pant dhan-18, Pant dhan-10, Narendra, Pant dhan-12, Pant dhan-4, ARR-09, Shahsarang, IVT-ASG-2712, IVT-ASG-2701, AVT-I-ASG-2602, AVT-I-ASG-2609 and IVT-ASG-2705 identified carrying this allele can be used as a source for large grain length in future. The primers RM 478 for grain thickness and RM 574-2 for grain width can be used in marker assisted breeding programmes. Allele A (205 bp) of RM 478 and allele B (240 bp) of RM 574-2 associated with low grain weight and grain width, respectively can be used for rejection at seedling stage in marker assisted breeding programme. This study also identified novel alleles (alleles distinct from those reported in biparental programme) which could be significant in a larger panel of rice genotypes.

Keywords: Allele mining; rice;Oryza sativa; O. nivara; SSR primers

Introduction

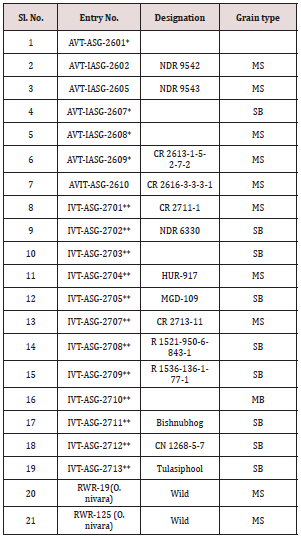
A panel of 41 rice genotypes consisting of the released cultivars of O. sativa, landraces and nineteen accessions from AVT, AVIT and IVT series and two accessions RWR-19 and RWR-125 from wild species O. nivara were used for allele mining study for grain traits contributing to grain yield. The mean data for grain length, grain width and 1000 grain weight was taken for all the genotypes used for allele mining study. The 41 rice genotypes were categorized into three groups in order of their grain dimensions and 1000 grain weight. The genotypes consisted of 39.02 % large (2.49-3.62), 51.22 % medium (2.01-2.44) and 9.76 % small (1.85-1.97) for grain width in mm; 19.51 % large (9.18-10.31), 56.1 % medium (7.36-8.74) and 24.4 % small (5.48-6.82) for grain length in mm; 43.9 % high (23- 36), 34.15 % medium (19.5-22.8) and 21.95 % small (17-19.45) for 1000 grain weight in grams. F-test was conducted for analysis of variance in phenotypic traits between the genotypes. Significant variation at 5% level was observed for grain length (F=9.61) and grain width (F=6.10). Allele mining for grain yield contributing traits viz. grain length, grain weight and grain width was done for the reported gene Rdd1 and the QTLs tightly associated with the traits with an aim to identify alleles of genes conferring the grain yield traits. The genes/QTLs associated with these three-grain yield contributing traits viz. grain length, grain width and 1000 grain weight targeted in this study included Rdd 1 (Rice dof daily fluctuations 1), gw8 (Grain width 8), gt7 (Grain thickness 7), gw 8.1 (grain weight 8.1), G S5 (Grain size 5), and gw7 (Grain weight 7), all previously reported to be associated with grain yield traits in biparental studies (except Rdd 1).

Scoring of PCR products was done through gel electrophoresis by comparing the size of the bands of the PCR products using a gel documentation system. The markers showing bands of similar positions in gels for all the genotypes were monomorphic markers while those markers showing bands at different position were polymorphic markers. All the genotypes that show products of similar size with that of expected amplicon size for the reported trait will carry the desired allele for grain yield and likewise the alleles for all the target regions were identified. PCR-based allele mining for these traits was performed in a panel of 41 genotypes using 10 microsatellite markers reported to be tagged with these genes/QTLs. Ten microsatellite markers were used for allele mining; out of which nine markers (RDD1-2, RM 234, RM 478, RM 23201, RM 502, RM 574-1, RM 574-2, RM 593-1 and RM 593-2) amplified. Out of these nine markers, RM 23201 was monomorphic and the rest were polymorphic. Maximum number of four alleles was found for marker RM 478 and RM 574-2, three alleles for RDD I-2 and RM 234 and two alleles for RM 502, RM 574-1, RM 593-1 and RM 593-2 when scored in agarose gel. Chi square test was conducted to study the association of the markers with grain traits [1]. Each of the alleles observed in the top 15 and bottom 15 genotypes were tested for the consistency of their distribution with the whole population. Significant associations were observed for allele A in 15 largest genotypes (Χ2=3.94, p=0.05) and B allele (Χ2=4.51, p=0.03) in the 15 smallest length genotypes for primer RDD 1-2. Allele A was found to be associated with large grain length and allele B was found to be associated with small grain length. The genotypes viz. Hans raj, Pant dhan-18, Pant dhan-10, Narendra, Pant dhan-12, Pant dhan-4, ARR-09, Shahsarang, IVT-ASG-2712, IVT-ASG-2701, AVT-IASG-2602, AVT-IASG-2609 and IVT-ASG-2705 were found to contain A allele found to be associated with large grain length for RDD 1-2 marker. Significant association was observed in marker RM 478 with grain weight and for distribution of A allele in the bottom 15 genotypes (lowest grain weight) with the distribution in the overall population (Χ2=5.08, p=0.02) and for primer RM 574-2, distribution of B allele (Χ2=4.3, p=0.08) in the bottom 15 genotypes (smallest grain width) was observed to be significant.

From this present experiment, hybrid plants from inter-specific crosses can be used for backcrossing in future plant breeding programmes. Crosses can also be attempted for genotypes that failed during this experiment. Primer RDD 1-2 can be used for identifying alleles enhancing grain length from diverse genomic sources for crop improvement [2]. The allele A (600 bp) from Rdd 1 can be used in breeding programmes to enhance grain length in rice. The genotypes viz. Hans raj, Pant dhan-18, Pant dhan-10, Narendra, Pant dhan-12, Pant dhan-4, ARR-09, Shahsarang, IVTASG- 2712, IVT-ASG-2701, AVT-IASG-2602, AVT-IASG-2609 and IVT-ASG-2705 were identified to be carrying this allele can be used as a source for large grain length in future. The primers RM 478 for grain thickness and RM 574-2 for grain width can be used in marker assisted breeding programmes. Allele A (205 bp) of RM 478 and allele B (240bp) of RM 574-2 associated with low grain weight and grain width, respectively can be used for rejection at seedling stage in marker assisted breeding programme. This study also identified novel alleles (alleles distinct from those reported in biparental programme), which could be significant in a larger panel of rice [3].

Materials and Methods

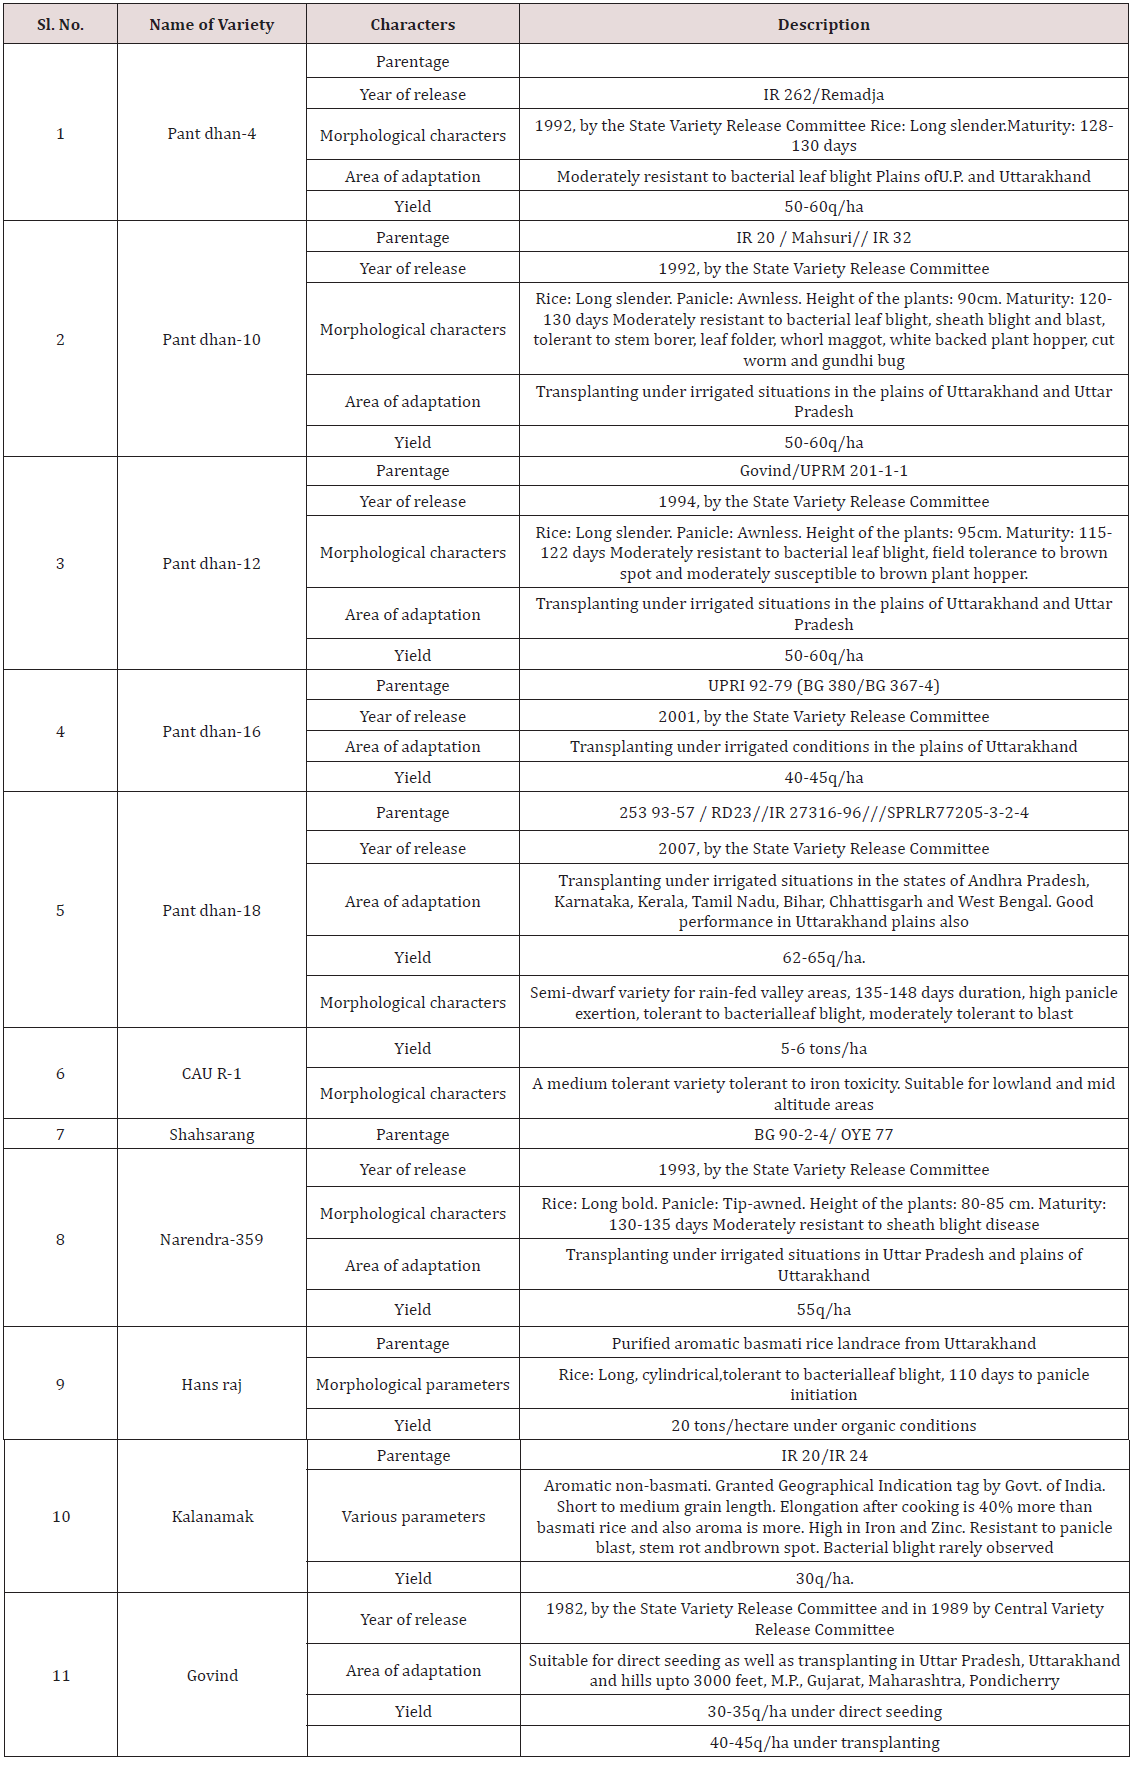
A panel of different rice genotypes including released cultivars of O. sativa i.e., IR-1552 (LR-55), Govind, CAU R-1, Kalanamak, Hansraj, Pant dhan-4, Pant dhan-10, Pant dhan-12, Pant dhan-16, Pant dhan-18, Narendra-359, landraces like ARR-09, LR-1 (Balwai), LR-5 (Laljagli), LR-23 (Sabhagidhan), LR-71 (Basmati paddy), LR- 77 (BR-1),Shahsarang, Bhasphool (LR-2), Chakaoporieton (LR- 26), and nineteen accessions from AVT and IVT series and two accessions RWR-19 and RWR-125 from wild species O. nivara were used for allele mining. The experimental material seed of Pant dhan was obtained from Pantnagar and seed of AVT, AVIT and IVT series have been procured from DRR (Directorate of Rice Research), Hyderabad (Tables 1-3) [4].

Table 1: Description of different rice (O. sativa and O. nivara) genotypes used for allele mining.
Lupinepublishers-openaccess-Agriculture

*- Advanced varietal trial; **- Initial varietal trial; SB: Short bold; MS: Medium slender/Mild scented; LS: Long slender; SS: Strong scented.

Table 2:
Lupinepublishers-openaccess-Agriculture

Table 3:

Lupinepublishers-openaccess-Agriculture

Statistical analysis of seed parameters for grain size variance in 41 rice genotypes

The grain size of rice is contributed collectively by a complex of yield related traits of which grain length, grain width and grain weight also play a major role. Given prior concern to these three traits, a set of data for average grain length, grain width and grain weight has been taken for all the genotypes used for allele mining.

Phenotypic analysis/Analysis of variance

The frequency distribution in percent for grain length, grain width and grain weight was determined for large, medium and small grains in the population of 41 genotypes. Analysis of variance for significance of phenotypic variations for grain length and grain width of 41 genotypes was studied through F-test (Table 4).

Table 4:

Lupinepublishers-openaccess-Agriculture

Germination and sowing of seeds

Sowing of seeds used for allele mining study was done in the month of February 2014 (Table 4). Prior to sowing, seeds of all the genotypes were first allowed to germinate in sterilized Petri plates containing filter papers moistened with water. Upon germination, the seeds were transferred to shallow plastic trays and the genotypes were grown in rows with each genotype in a single row having at least twenty seedlings per row [5]. The soil was finely prepared free of clods and was mixed with farm yard manure. The trays containing the plants were kept inside the greenhouse and the plants were maintained by regular watering and also weeding as and when required.

Molecular Characterization

SSR analysis for polymorphism

Rice dof daily fluctuations1 (Rdd1), Grain width5 (GS5), Grain thickness (gt7) and Grain weight8 (GW8) previously reported to be linked to the grain traits/QTLs were used for allele mining studies in different rice genotypes. Forty one rice genotypes including two accessions of O. nivara were used for allele mining studies to detect the existing alleles among the genotypes for the given traits. Markers for these reported genes were obtained from Gramene marker database. Genomic DNA from rice leaves of all the genotypes were isolated using CTAB method of Doyle [3]. The DNA samples were diluted to obtain a working standard according to the concentration and the quality of the DNA obtained. The PCR reaction conditions for primers were standardized to obtain good quality bands and were used as the standard reaction conditions throughout the whole PCR amplification process [6].

The three yield contributing traits namely grain length, grain width and grain weight was targeted in this study. The gene Rdd1 has been reported to be indirectly related to increase in grain size in rice. Since increase in grain size is constitutively contributed by grain traits which include grain length, the RDD1 markers associated with this gene has been used in allele mining for grain length trait. Gs 5 is a reported QTL which has been known to associate positively with grain width and thus contributing to grain size and the RM markers reported to be associated with this gene and flanking at the regions near it were used for allele mining study. Another QTL, gw 8, known to positively control grain width and QTLs; gt7, gw 8.1 and gw 7 for grain weight were targeted for allele mining in the present study (Figure 1).

Figure 1: Chromosome map showing genes/QTLs (italicized) associated with grain yield traits and the position of the markers (designated as RDD 1 and RM) linked to these traits respectively, in rice. The scale of the maps in megabase is shown on the left axis.
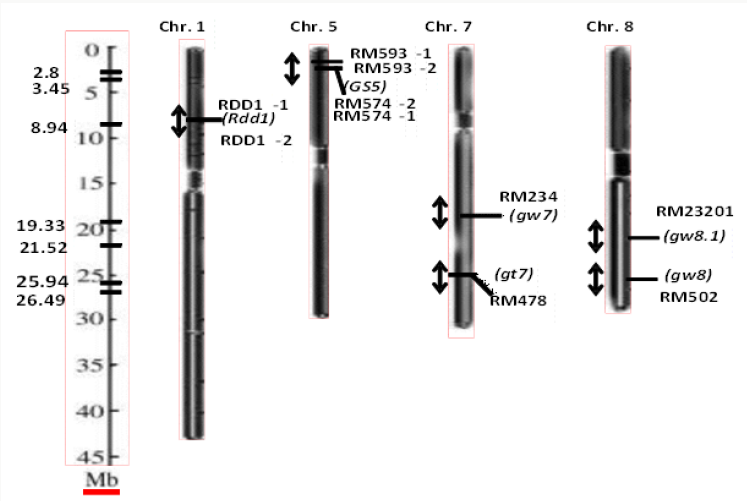
Lupinepublishers-openaccess-Agriculture

Isolation of Genomic Dna from Plant Tissue

Genomic DNA was isolated from genotypes used for allele mining. Tender leaves from young rice seedlings were used for the extraction of genomic DNA. Genomic DNA from rice leaves was isolated using CTAB method of Doyle [3]. Young actively growing leaves of 15 days-old plants were collected and used for DNA extraction.

Procedure for DNA extraction

About 2g of young fresh plant leaf tissue was rapidly frozen in liquid nitrogen and ground to a fine powder in a pre-chilled sterile pestle and mortar. The frozen powder was transferred to a 2ml tube. 1ml of CTAB extraction buffer was added to each tube and tubes were inverted several times with gentle shaking. The tubes were incubated at 65 0C in a water bath for 1 hr. Contents were mixed by inverting the tubes after every 10-15 minutes. The tubes were cooled to room temperature and 1 ml of chloroform: isoamyl alcohol in the ratio of 24:1 was added to each. The contents were mixed by inverting the tubes several times. The tubes were centrifuged at 10,000 rpm for 10 minutes at 4 0C. The upper clear aqueous supernatant was removed and transferred to fresh tubes. 1ml of pre-chilled isopropanol was added to each tube and the contents were mixed by inverting the tubes several times and the tubes were kept overnight at -20 0C. Although DNA precipitation began as soon as isopropanol was added, it was kept overnight for better and complete precipitation. The samples were centrifuged for 10 minutes at 5,000 rpm at 4 0C. The solution was poured without disturbing the DNA pellet at the bottom of the tubes. 1.5ml of 70% ethanol was added and then centrifuged at 5,000rpm for 5 minutes at 4 0C. Supernatant was decanted. Pellet was air dried for 15-20 minutes. 50μl of TE buffer was added to the pellet [7].

DNA quantification

The quantification of DNA was done by staining DNA with ethidium bromide after electrophoresis in 0.8% agarose gel at 100V for 1 hour in TBE buffer (0.04M Tris borate, 0.001 M EDTA, pH 8.0) using known DNA concentration standard.

Dilution of DNA samples

A part of the DNA sample of each genotype was taken and dilution of each sample was made with appropriate amount of TE buffer to yield a working concentration and stored at -20°C for further use in PCR amplification.

Polymerase chain reaction (PCR)

Dilution of SSR markers: The SSR markers which were in lyophilized state were centrifuged and diluted with TE buffer accordingly to yield 100pmol/μl stock concentration and from the stock, working concentration of 10pmol/μl was made by diluting at 1:9 ratio of stock with TE buffer. The primer stock was immediately transferred to -20 °C to prevent degradation during longer duration storage and the working standard was kept in 4 °C for use in the study.

Standardization of PCR conditions

Standardization of annealing temperature: Annealing temperatures for each of the primers was standardized by PCR reaction at least three different PCR conditions. The reaction condition giving amplification with good bands were taken as the standard for all the following experiments.

PCR conditions for markers used for allele mining

Primary denaturation: 95 °C for 3 minutes

Denaturation: 95 °C for 0.30 minutes

Annealing: 55 °C for 0.45 minutes

Extension: 72 °C for 0.40 minutes

Final extension: 72 °C for 2 minutes

Number of cycle: 32

Allele mining of reported genes/ QTL for yield related grain traits in rice using SSR markers

In this study, 41 diverse rice genotypes were used for allele mining study with an objective to detect among them superior alleles for rice grain dimensions viz. grain length, grain width, grain thickness, grain size and grain weight. SSR markers associated with reported genes for these traits were used for PCR amplification Micro satellite markers linked to reported genes/QTL for grain yield traits were used to detect polymorphism and to detect the yield enhancing alleles among 41 rice genotypes. PCR amplification was done with a set of 10 primers (Tables 5 & 6) and analysis for polymorphism was done through electrophoresis in 3% agarose gel. Scoring of PCR products was done through gel electrophoresis by comparing the size of the bands of the PCR products using a gel documentation system. The markers showing bands of similar positions in gels for all the genotypes were monomorphic markers while those markers showing bands at different position were polymorphic markers. All the genotypes that show products of similar size with that of expected amplicon size for the reported trait will carry the desired allele for grain yield and likewise the alleles for the entire target regions were identified [8].

Table 5: Concentrations of reaction mixtures for markers used for allele mining.

Lupinepublishers-openaccess-Agriculture

Table 6: List of SSR primers used for allele mining study.
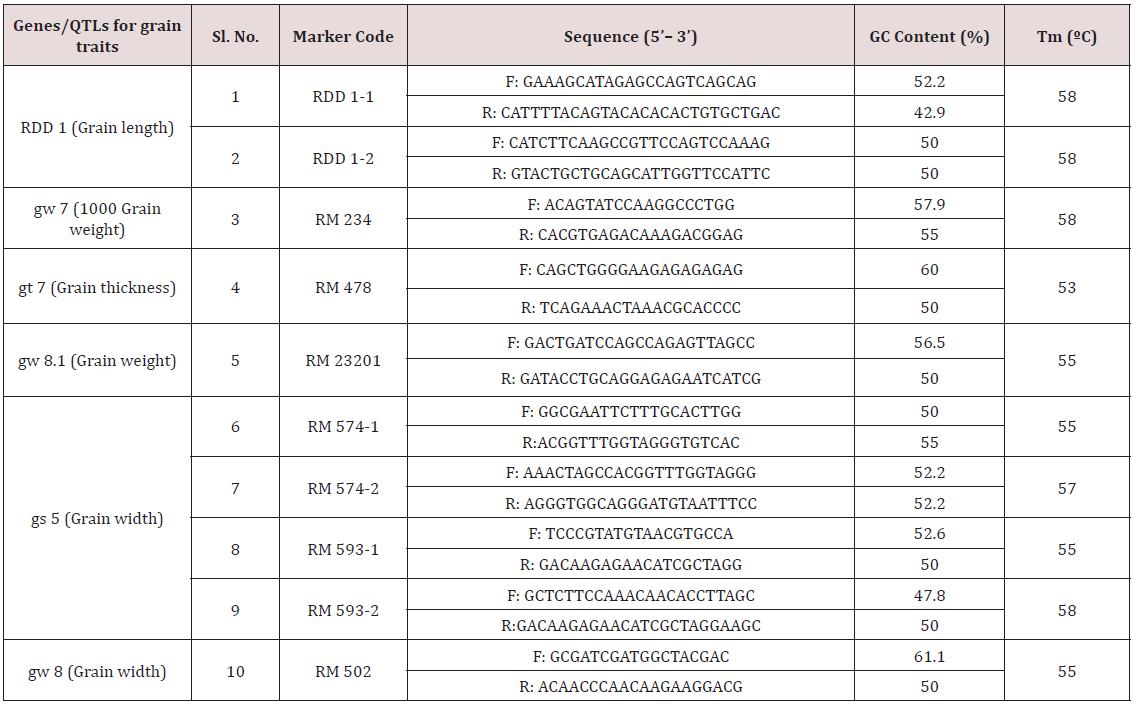
Lupinepublishers-openaccess-Agriculture

Association between phenotype and genotype

The average grain length, grain width and 1000 grain weight distribution in the genotypes carrying different alleles was determined by checking whether the error bars referring to confidence interval showed overlapping or not. The 41 genotypes were further categorized into top and bottom groups of 15 genotypes based on grain length, grain width and grain weight. Chi square analysis was performed to study the association between markers with grain traits and allelic association with the trait for each of the sub-groups.

Results and Discussion

Phenotypic analysis for yield related traits

Phenotypic variation was observed for grain dimensions in all the genotypes. The mean data for grain width (Figure 2), grain length (Figure 3) and 1000 grain weight (Figure 4) was taken for all the 41 genotypes used for allele mining study. The genotypes with larger grain width (mm) were LR-1 (3.62), LR-71 (3.07), Pant dhan- 16 (2.85), IVT-2712 (2.79) and RWR-19 (2.77). Smaller grain width (mm) was observed in Kalanamak (2.01), AVT-2607 (2.0), Hans raj (1.97), AVT-2701 (1.94), IVT-2703 (1.904) and AVT-2609 (1.85). The panel consisted of 39.02 % large (2.49-3.62), 51.22 % medium (2.01-2.44) and 9.76 % small (1.85-1.97) for grain width (in mm) trait. The genotypes with larger grain length (mm) were Hans raj (10.31), Pant dhan-18 (9.83), Pant dhan-10 (9.7), Narendra (9.63), Pant dhan-12 (9.53), RWR-125 (9.27), Pant dhan-4 (9.23) and Govind (9.12). Smaller grain length (mm) was observed for genotypes IVT-ASG-2708 (6.41), Kalanamak (6.35), IVT-ASG-2711 (6.15), IVT-ASG-2607 (5.92), IVT-ASG-2713 (5.71), IVT-ASG-2703 (5.69), LR-71 (5.59) and LR-77 (5.48). The genotype panel consisted of 19.51 % large (9.18-10.31), 56.1 % medium (7.36-8.74) and 24.4 % small (5.48-6.82) for grain length (in mm).The genotypes having the highest grain weight (g) were LR-1 (36.04), Pant dhan- 18 (27.97), Pant dhan-4 (26.39), LR-23 (25.32), RWR-125 (25.05), Narendra (24.2), Pant dhan -12 (23.97) and Pant dhan-16 (23.39). Lower grain weight (g) was observed for genotypes, Kalanamak (12.17), LR-77 (12.14), AVT-IASG-2609 (12.00), IVT-ASG-2713 (11.96), AVT-IASG-2607 (10.74) and IVT-ASG-2703 (10.72). The genotype panel consisted of 43.9 % high (23-36), 34.15 % medium (19.5-22.8) and 21.95 % small (17-19.45) for 1000 grain weight (g). The phenotypic variance observed for the 41 rice genotypes were found to be significant at 5% level for grain width (F=9.61) and grain length (F=6.1).

Figure 2: Classification of rice genotypes in large, medium and small grain width categories.
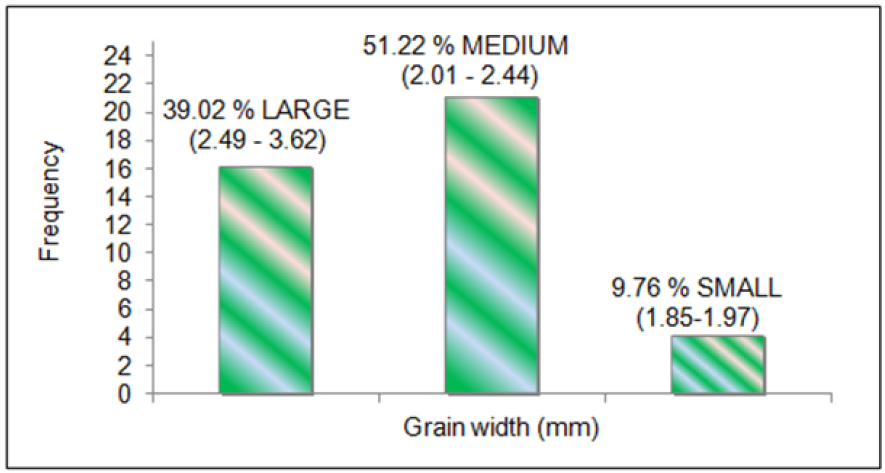
Lupinepublishers-openaccess-Agriculture

Figure 3: Classification of rice genotypes under large, medium and small grain length categories.
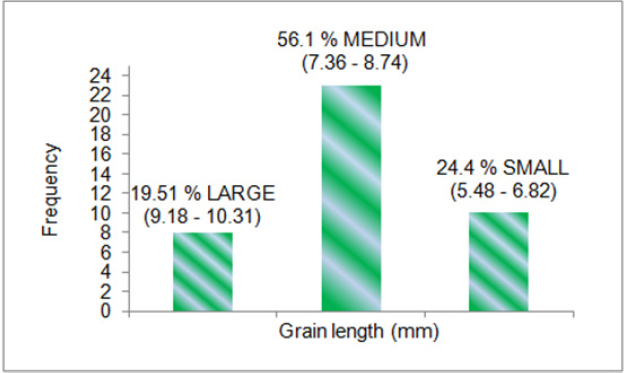
Lupinepublishers-openaccess-Agriculture

Figure 4: 4: Classification of rice genotypes in high, medium and low grain weight categories.
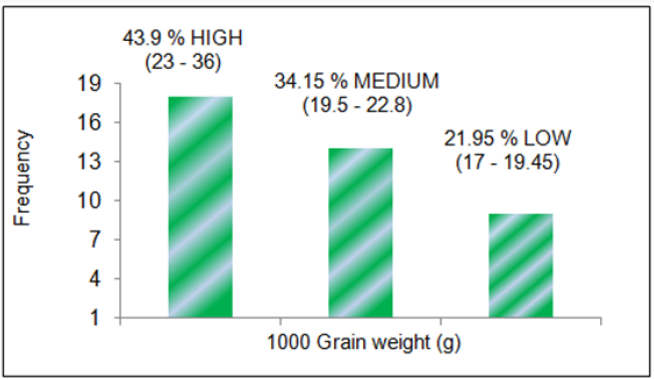
Lupinepublishers-openaccess-Agriculture

Allele mining for genes/QTLs

Alleles are the alternative DNA sequences at the same physical locus which may or may not result in different phenotypic traits. Increasing demand of rice varieties with higher yield is making scientists work for the identification of superior and novel alleles to be used in breeding programmes. Allele mining is another very important molecular approach towards identifying and bringing together useful traits from diverse genetic sources and introgression these useful alleles into a common recipient promising cultivar lacking one or two superior alleles for some agronomic traits. Molecular markers are effectively being used to detect the variant alleles present in diverse genotypes or cultivars which are phenotypically different from each other for the traits in question. Microsatellite markers or SSR markers are PCR-based markers that specifically bind to the complementary sequence of the plant genomic DNA during PCR reaction. Through allele mining novel genes could be identified from diverse sources and used in improvement of crops for specific traits. Allele mining for grain yield related traits in large number of genotypes/ cultivars would help in identifying new alleles of the genes known for the target trait and their sources. It can also provide an insight into molecular basis of novel trait variations and identify the nucleotide sequence changes associated with superior alleles [9].

The quantitative trait locus (QTL) mapping has contributed to a better understanding of the genetic basis of many agronomically important traits such as grain yield. Grain yield is a quantitatively inherited trait which is the result collectively contributed by several individual grain traits. Of these, grain length, grain width and grain weight are some of the important yield contributing grain traits in rice. Today, a number of genes/QTLs associated with these traits have been identified, sequenced, mapped and many associated markers to these QTLs have been developed recently. In this study, a set of 41 diverse genotypes including two accessions viz. RWR- 19 and RWR-125 from wild species O. nivara were used for allele mining using nine SSR markers tagged to reported genes/QTLs. Out of the nine primers viz. RDD 1-2, RM 234, RM 478, RM 23201, RM 502, RM 574-1, RM 574-2, RM 593-1 and RM 593-2 used in the present study, RM 23201 was found to be monomorphic and the rest eight primers were polymorphic.

Association between genotype and phenotype

Chi square test was conducted to study the association of the markers with grain traits. Each of the alleles observed in the top 15 and bottom 15 genotypes were tested for the consistency of their distribution with the whole population. Significant association (Χ2=3.94, p=0.05) was observed for allele A in the 15 genotypes having large grain length for primer RDD1-2. Allele Bfor Rdd1 gene too showed significant association (Χ2=4.51, p=0.03). Allele A was found to be associated with large grain length and allele B was found to be associated with small grain length. Significant association was observed for marker RM 478 with grain weight and for the distribution of A allele in the bottom 15 genotypes (lowest grain weight) with the distribution in the overall population (Χ2=5.08, p=0.02) and for primer RM574-2, distribution of B allele (Χ2=4.3, p=0.08) in the bottom 15 genotypes (smallest grain width) was found to be significant.

Rdd 1 (Rice dof daily fluctuations1) Dof gene in rice has been reported to be associated with plant growth, grain size and flowering timein rice. In a study conducted by Iwamoto et al. (2009), transgenic plants carrying full length Rdd 1cDNA driven by constitutive promoter were produced in order to study the role of Rdd1 and in - vivo function of Dof gene in plants. The two types of transgenic plants were produced viz. RDD 1-S, transgenic containing sense strand and RDD 1-AS with anti-sense strand. Differences in the grain length, grain width and grain weight were observed between RDD 1-AS and RDD 1-S plants when subjected under varying photoperiod conditions [4]. When the grain sizes of the two transgenic types of plants were compared with the wild type plants, there was significant decrease in grain length, grain width and decrease in 1000 grain weight in transgenics carrying antisense gene (AS1=4.67 and AS2=4.54). In our study, we used previously reverse RDD-1 primer and designed a new forward primer giving an amplicon size of 620 bp. The three alleles obtained in the present study with sizes of 600, 620 and 600’490 base pairs were designated as A, B and C, respectively. Significant association (Χ2=3.94, p<0.05) was observed between the grain length and the allele A (600bp) for large grain length and allele B (620 bp) associated with small grain length (Χ2=4.51, p<0.05). The allele A for Rdd1 can be used in breeding for large grain length. In our study, however, a set of 41 genotypes having large grain length ranging from 8.27-10.31mm and small grain length of 5.48-7.52 mm were used. This phenotypic variation is distinct from the WT genotype Nipponbare (4.94mm) used by Iwamoto [4]. The allele A though similar in size could be different due to nucleotide variation. In order to rule out that possibility, sequencing of the allele from a panel of genotypes showing large grain length will have to be done.

GS 5 (Grain size 5) QTL has been reported to be a positive regulator of grain width and flanked by markers RM 593 and RM 574. Over-expression of GS5 promotes cell division resulting in an increase of grain width [6]. Other genes/QTLs in rice are Grain weight 7 (gw 7) reported to be associated with 1000 grain weight located at chromosome 7 in population derived from O. sativa and O. grandiglumis. Phenotypic variation of 13.3% was observed in populations having allele for gw 7 from Caipo (Aluko, 2003). Grain width 8 (gw 8) at chromosome 8 has been reported to have negative effect on grain width with decrease in grain width in populations resulting from separate crosses made between HJX 74 x Anmol 3 and HJX 74 x Basmati 370, with possible introgression of the recessive allele from Anmol 3 and Basmati 370 [7,8]. No significant association was observed for primers reported for Grain weight 8.1 (gw 8.1) [9] QTL in our panel of 41 genotypes. Grain thickness 7 (gt 7), a QTL for grain thickness with linked marker RM 478 at chromosome 7¸ has been reported to be associated positively with grain thickness in HG 101 which is a near isogenic line obtained from O. sativa (Hwaseongbyeo) x O. grandiglumis. T [8].

he increased grain length in mm (5.53), grain width in mm (3.08) and 1000 grain weight in grams (26.3) was observed for the NILs as compared to the recipient parent, Hwaseongbyeo, with grain length (5.03 mm), grain width (2.84mm) and 1000 grain weight (21.5g). In the present study, significant association of primer RM 478 was observed and the allele A (205bp) was significantly associated with low 1000 grain weight. The genotypes used in the present study have highest 1000 grain weight ranging from 20.16-36.04 grams and lowest ranging from 10.72-15.59 grams. Since grain yield is quantitative in nature, it is a complex trait and the markers tagged with the genes/QTLs may not show association in a diverse set of genotypes. Also the effect of individual genic components to grain yield may be very low as grain yield is a trait caused by cumulative action of many related components. Our study however, suggests that the allele A (600 bp) from Rdd 1 can be used in breeding programmes to enhance grain length in rice. The genotypes viz. Hans raj, Pant dhan-18, Pant dhan-10, Narendra, Pant dhan-12, Pant dhan-4, ARR-09, Shahsarang, IVT-ASG-2712, IVT-ASG-2701, AVT-IASG-2602, AVT-IASG-2609 and IVT-ASG-2705 have been identified to be carrying this allele. These can be used as a source of large grain length in future. The primers RM 478 for grain thickness and RM 574-2 for grain width can be used in marker assisted breeding programmes. Allele A (205 bp) of RM 478 and allele B (240 bp) of RM 574-2 associated with low grain weight and grain width, respectively can be used for rejection at seedling stage in marker assisted breeding programme (Table 7). This study also identified novel alleles (alleles distinct from those reported in biparental programme); which could be significant in a larger panel of rice genotypes (Figure 2-4).

Discussion

Phenotypic analysis for yield related traits

Phenotypic variation was observed for grain dimensions in all the genotypes. The mean data for grain width (Figure 5), grain length (Figure 6) and 1000 grain weight (Figure 7) was taken for all the 41 genotypes used for allele mining study. The genotypes with larger grain width (mm) were LR-1 (3.62), LR-71 (3.07), Pant dhan- 16 (2.85), IVT-2712 (2.79) and RWR-19 (2.77). Smaller grain width (mm) was observed in Kalanamak (2.01), AVT-2607 (2.0), Hans raj (1.97), AVT-2701 (1.94), IVT-2703 (1.904) and AVT-2609 (1.85). The panel consisted of 39.02 % large (2.49-3.62), 51.22 % medium (2.01-2.44) and 9.76 % small (1.85-1.97) for grain width (in mm) trait. The genotypes with larger grain length (mm) were Hans raj (10.31), Pant dhan-18 (9.83), Pant dhan-10 (9.7), Narendra (9.63), Pant dhan-12 (9.53), RWR-125 (9.27), Pant dhan-4 (9.23) and Govind (9.12). Smaller grain length (mm) was observed for genotypes IVT-ASG-2708 (6.41), Kalanamak (6.35), IVT-ASG-2711 (6.15), IVT-ASG-2607 (5.92), IVT-ASG-2713 (5.71), IVT-ASG-2703 (5.69), LR-71 (5.59) and LR-77 (5.48). The genotype panel consisted of 19.51 % large (9.18-10.31), 56.1 % medium (7.36-8.74) and 24.4 % small (5.48-6.82) for grain length (in mm). The genotypes having the highest grain weight (g) were LR-1 (36.04), Pant dhan- 18 (27.97), Pant dhan-4 (26.39), LR-23 (25.32), RWR-125 (25.05), Narendra (24.2), Pant dhan -12 (23.97) and Pant dhan-16 (23.39). Lower grain weight (g) was observed for genotypes, Kalanamak (12.17), LR-77 (12.14), AVT-IASG-2609 (12.00), IVT-ASG-2713 (11.96), AVT-IASG-2607 (10.74) and IVT-ASG-2703 (10.72) (Tables 8 & 9). The genotype panel consisted of 43.9 % high (23-36), 34.15 % medium (19.5-22.8) and 21.95 % small (17-19.45) for 1000 grain weight (g). The phenotypic variance observed for the 41 rice genotypes were found to be significant at 5% level for grain width (F=9.61) and grain length (F=6.1).

Figure 5: SSR profile of grain length generated by primer RDD1-2 in 41 rice genotypes. The numbers at the top refer to the genomic DNA code as mentioned in Table 4.2. Alleles are indicated at the bottom. Allele A=approximately 600 bp; allele B=620 bp; B’C=620’ 490 bp; X=no amplification. 1kbp ladder is indicated at the right of the gel.
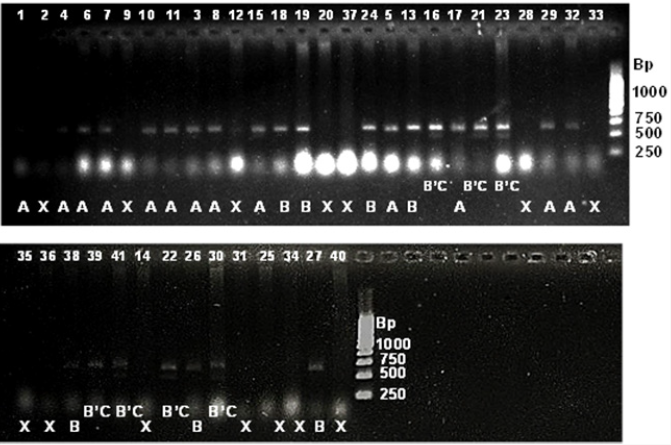
Lupinepublishers-openaccess-Agriculture

Figure 6: SSR profile of grain weight generated by primer RM 234 in 41 rice genotypes. The numbers at the top refer to the genomic DNA code as mentioned in Table 4.2. Alleles are indicated at the bottom. Allele A=approximately 110 bp; allele B=125 bp; allele C=155; X=no amplification. 100 bpladder is indicated to the right of the gel.
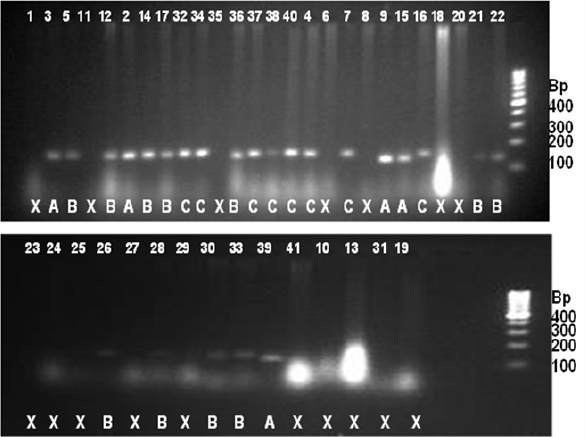
Lupinepublishers-openaccess-Agriculture

Figure 7: SSR profile of grain width generated by primer RM 502 in 41 rice genotypes. The numbers at the top refer to the genomic DNA code as mentioned in Table 4.2. Alleles are indicated at the bottom. Allele A=approximately 255 bp; B=170 bp; X=no amplification. 100 bpladder is indicated to the right of the gel.
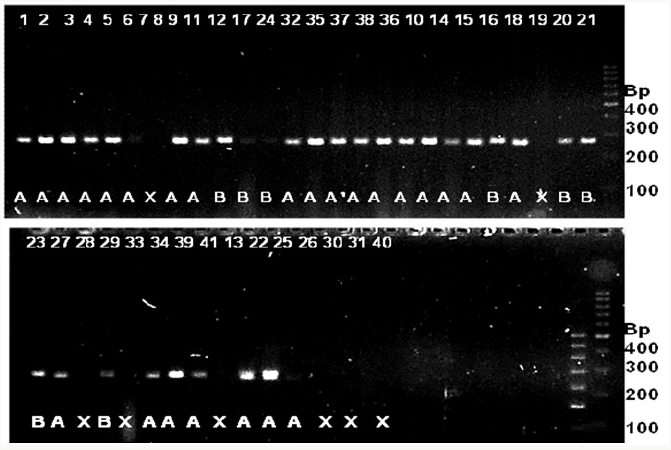
Lupinepublishers-openaccess-Agriculture

Allele mining for genes/QTLs

Alleles are the alternative DNA sequences at the same physical locus which may or may not result in different phenotypic traits. Increasing demand of rice varieties with higher yield is making scientists work for the identification of superior and novel alleles to be used in breeding programmes. Allele mining is another very important molecular approach towards identifying and bringing together useful traits from diverse genetic sources and introgression these useful alleles into a common recipient promising cultivar lacking one or two superior alleles for some agronomic traits. Molecular markers are effectively being used to detect the variant alleles present in diverse genotypes or cultivars which are phenotypically different from each other for the traits in question. Microsatellite markers or SSR markers are PCR-based markers that specifically bind to the complementary sequence of the plant genomic DNA during PCR reaction. Through allele mining novel genes could be identified from diverse sources and used in improvement of crops for specific traits. Allele mining for grain yield related traits in large number of genotypes/cultivars would help in identifying new alleles of the genes known for the target trait and their sources. It can also provide an insight into molecular basis of novel trait variations and identify the nucleotide sequence changes associated with superior alleles.

The quantitative trait locus (QTL) mapping has contributed to a better understanding of the genetic basis of many agronomically important traits such as grain yield. Grain yield is a quantitatively inherited trait which is the result collectively contributed by several individual grain traits. Of these, grain length, grain width and grain weight are some of the important yield contributing grain traits in rice. Today, a number of genes/QTLs associated with these traits have been identified, sequenced, mapped and many associated markers to these QTLs have been developed recently. In this study, a set of 41 diverse genotypes including two accessions viz. RWR- 19 and RWR-125 from wild species O. nivarawere used for allele mining using nine SSR markers tagged to reported genes/QTLs. Out of the nine primers viz. RDD 1-2, RM 234, RM 478, RM 23201, RM 502, RM 574-1, RM 574-2, RM 593-1 and RM 593-2 used in the present study, RM 23201 was found to be monomorphic and the rest eight primers were polymorphic.

Association between genotype and phenotype

Chi square test was conducted to study the association of the markers with grain traits. Each of the alleles observed in the top 15 and bottom 15 genotypes were tested for the consistency of their distribution with the whole population. Significant association (Χ2=3.94, p=0.05) was observed for allele A in the 15 genotypes having large grain length for primer RDD 1-2. Allele Bfor Rdd 1 gene too showed significant association (Χ2=4.51, p=0.03). Allele A was found to be associated with large grain length and allele B was found to be associated with small grain length. Significant association was observed for marker RM 478 with grain weight and for the distribution of A allele in the bottom 15 genotypes (lowest grain weight) with the distribution in the overall population (Χ2=5.08, p=0.02) and for primer RM 574-2, distribution of B allele (Χ2=4.3, p=0.08) in the bottom 15 genotypes (smallest grain width) was found to be significant. Rdd 1(Rice dof daily fluctuations 1) Dof gene in rice has been reported to be associated with plant growth, grain size and flowering time in rice. In a study conducted by Iwamoto et al. (2009), transgenic plants carrying full length Rdd 1 cDNA driven by constitutive promoter were produced in order to study the role of Rdd 1 and in vivo function of Dof gene in plants. The two types of transgenic plants were produced viz. RDD 1-S, transgenic containing sense strand and RDD 1-AS with anti-sense strand. Differences in the grain length, grain width and grain weight were observed between RDD 1-AS and RDD 1-S plants when subjected under varying photoperiod conditions [4]. When the grain sizes of the two transgenic types of plants were compared with the wild type plants, there was significant decrease in grain length, grain width and decrease in 1000 grain weight in transgenics carrying antisense gene (AS1=4.67 and AS2=4.54).

In our study, we used previously reverse RDD-1 primer and designed a new forward primer giving an amplicon size of 620bp. The three alleles obtained in the present study with sizes of 600, 620 and 600’490 base pairs were designated as A, B and B’C, respectively. Significant association (Χ2=3.94, p< 0.05) was observed between the grain length and the allele A (600bp) for large grain length and allele B (620bp) associated with small grain length (Χ2=4.51, p<0.05). The allele A for Rdd 1 can be used in breeding for large grain length. In our study, however, a set of 41 genotypes having large grain length ranging from 8.27-10.31 mm and small grain length of 5.48-7.52 mm were used. This phenotypic variation is distinct from the WT genotype Nipponbare (4.94mm) used by Iwamoto [4]. The allele A though similar in size could be different due to nucleotide variation. In order to rule out that possibility, sequencing of the allele from a panel of genotypes showing large grain length will have to be done. GS 5 (Grain size 5) QTL has been reported to be a positive regulator of grain width and flanked by markers RM 593 and RM 574. Over-expression of GS 5 promotes cell division resulting in an increase of grain width [6]. Other genes/QTLs in rice are Grain weight 7 (gw 7) reported to be associated with 1000 grain weight located at chromosome 7 in population derived from O. sativa and O. grandiglumis. Phenotypic variation of 13.3% was observed in populations having allele for gw 7 from Caipo [1]. Grain width 8 (gw 8) at chromosome 8 has been reported to have negative effect on grain width with decrease in grain width in populations resulting from separate crosses made between HJX 74 x Anmol 3 and HJX 74 x Basmati 370, with possible introgression of the recessive allele from Anmol 3 and Basmati 370 [7,8]. No significant association was observed for primers reported for Grain weight 8.1 (gw 8.1) [9] QTL in our panel of 41 genotypes.

Grain thickness 7 (gt 7), a QTL for grain thickness with linked marker RM 478 at chromosome 7¸ has been reported to be associated positively with grain thickness in HG 101 which is a near isogenic line obtained from O. sativa (Hwaseongbyeo) x O. grandiglumis [8]. The increased grain length in mm (5.53), grain width in mm (3.08) and 1000 grain weight in grams (26.3) was observed for the NILs as compared to the recipient parent, Hwaseongbyeo, with grain length (5.03mm), grain width (2.84mm) and 1000 grain weight (21.5g). In the present study, significant association of primer RM 478 was observed and the allele A (205bp) was significantly associated with low 1000 grain weight. The genotypes used in the present study have highest 1000 grain weight ranging from 20.16-36.04 grams and lowest ranging from 10.72-15.59 grams. Since grain yield is quantitative in nature, it is a complex trait and the markers tagged with the genes/QTLs may not show association in a diverse set of genotypes. Also the effect of individual genic components to grain yield may be very low as grain yield is a trait caused by cumulative action of many related components. Our study however, suggests that the allele A (600bp) from Rdd 1 can be used in breeding programmes to enhance grain length in rice. The genotypes viz. Hans raj, Pant dhan-18, Pant dhan- 10, Narendra, Pant dhan-12, Pant dhan-4, ARR-09, Shahsarang, IVTASG- 2712, IVT-ASG-2701, AVT-IASG-2602, AVT-IASG-2609 and IVTASG- 2705 have been identified to be carrying this allele. These can be used as a source of large grain length in future. The primers RM 478 for grain thickness and RM 574-2 for grain width can be used in marker assisted breeding programmes. Allele A (205bp) of RM 478 and allele B (240bp) of RM 574-2 associated with low grain weight and grain width, respectively can be used for rejection at seedling stage in marker assisted breeding programme. This study also identified novel alleles (alleles distinct from those reported in biparental programme); which could be significant in a larger panel of rice genotypes (Tables 7-9).

Table 7: List of reported candidate genes/QTL, their associated markers, location, and associated grain traits used for allele mining study.
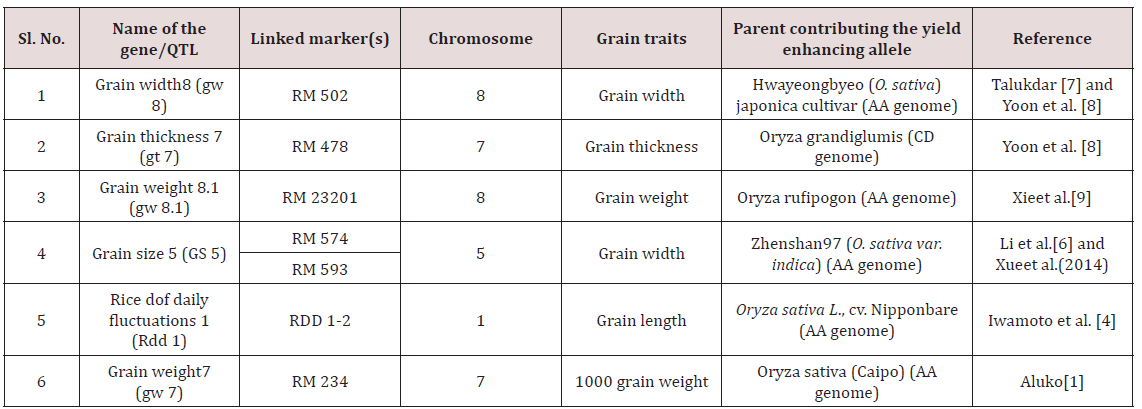
Lupinepublishers-openaccess-Agriculture

Table 8: Analysis of variance for grain width in rice genotypes.

Lupinepublishers-openaccess-Agriculture

Table 9: Analysis of variance for grain length in rice genotypes.

Lupinepublishers-openaccess-Agriculture

Conclusion

From this present experiment, hybrid plants from inter-specific crosses can be used for backcrossing in future plant breeding programmes. Crosses can also be attempted for genotypes that failed during this experiment. Primer RDD 1-2 can be used for identifying alleles enhancing grain length from diverse genomic sources for crop improvement. The allele A (600 bp) from Rdd 1 can be used in breeding programmes to enhance grain length in rice. The genotypes viz. Hans raj, Pant dhan-18, Pant dhan-10, Narendra, Pant dhan-12, Pant dhan-4, ARR-09, Shahsarang, IVTASG- 2712, IVT-ASG-2701, AVT-IASG-2602, AVT-IASG-2609 and IVT-ASG-2705 identified carrying this allele can be used as a source for large grain length in future. The primers RM 478 for grain thickness and RM 574-2 for grain width can be used in marker assisted breeding programmes. Allele A (205bp) of RM 478 and allele B (240bp) of RM 574-2 associated with low grain weight and grain width respectively, can be used for rejection at seedling stage in marker assisted breeding programme. This study also identified novel alleles (alleles distinct from those reported in biparental programme); which could be significant in a larger panel of rice genotypes.

Read More Lupine Publishers Agriculture Journal Articles: