Lupine Publishers| Current Trends on Biostatistics & Biometrics (CTBB)
Abstract
The practice of reporting P-values is commonplace in applied
research. Presenting the result of a test only as the rejection
or acceptance of the null hypothesis at a certain level of significance,
does not make full use of the information available from
the observed value of the test statistic. Rather P-values have been used
in the place of hypothesis tests as a means of giving more
information about the relationship between the data and the hypothesis.
In this brief note we discuss how to obtain P-values with
R codes.
Keywords: Hypothesis; Distribution; P-value
Introduction
Very often in practice we are called upon to make decisions
about populations on the basis of sample data. In attempting
to reach decisions, it is useful to make assumptions or guesses
about the populations involved. Such assumptions which may or
may not be true, are called statistical hypotheses and in general
are statements about the population parameters. The entire
procedure of testing of hypothesis that consists of setting up what
is called a ’Null hypothesis’ and testing it. R.A. Fisher quotes, ’Every
experiment may be said to exist only in order to give the facts
about a chance of disproving the null hypothesis’. So, what is this
null hypothesis?”. For example, if we consider the measurements
on weights of newborn babies, then the observations on these
measurements follows Normal distribution is a null hypothesis [1].
Suppose the measurements denoted by a random variable X that
is thought to have a normal distribution with mean μ and variance
1, denoted by N(μ,1). The usual types of hypotheses concerning
mean μ in which one is interested include H0: μ = μ0 versus H1: μ6=
μ0(two-tailed hypothesis) and H0: μ ≤ μ0 versus H1: μ > μ0 and H0: μ
≥ μ0 versus H1: μ < μ0(one-tailed hypothesis). So null hypothesis
H0 is a hypothesis which is tested for possible rejection under the
assumption that it is true.
In general, a procedure for the problem of testing of significance
of a hypothesis is as follows: Given the sample point x = (x1, x2, . . ..
,xn), find a decision ru. le that will lead to a decision [2].
P Value and Statistical Significance
To reject or fail to reject the null hypothesis H0: θ ∈ Θ in favor
of the alternative hypothesis H1: θ ∈ Θ1 = Θ-Θ. This decision rule
is based on a test statistic whose probability distribution when
H0 is true is known, at least approximately. Calculate the value
of the test statistic for the available data [3]. If the test statistic
is in the extreme of its probability distribution under the null
hypothesis, there is evidence that the null hypothesis is rejected.
More quantitatively, we calculate from the distribution of the test
statistic, the probability P that a deviation would arise by chance as
or more extreme than that actually observed, the H0 being true. This
value of P is called the significance level achieved from the sample
data or P-value. There are several ways to define P-values [4]. It is
the probability of observing under H0 a sample outcome at least
as extreme as the one observed. One could define P-value as the
greatest lower bound on the set of all significance levels α such that
we would reject H0 at level α. P-value is a value satisfying 0 ≤ P ≤ 1
for every sample point x. A P-value is valid if Pθ (p ≤ α) ≤ α. For fixed
sample data X=x it changes for different hypotheses. Let T(X) be a
test statistic such that large values of T give evidence that H1 is true.
For each sample point x, P-value is defined as p-value= sup Pθ(T(X)
≥ T(x)). θ∈Θ. Fisher writes: “The value for which P-value= 0.05, or 1
in 20, is 1.96 or nearly 2; it is convenient to take this point as a
limit
in judging whether a deviation ought to be considered significant
or not. Deviations exceeding twice the standard deviation are thus
formally regarded as significant”. Thus, for a given α, we reject H0
if P-value ≤ α and do not reject H0 if P-value > α. In the two-tailed
case, if the distribution of the test statistic is symmetric, one-tailed
P-value is doubled to obtain P-value. If the distribution of the test
statistic is not symmetric, the P-value is not well defined in twotailed
case, although many authors recommend doubling the onesided
P-value.
Examples: Let X1, . . . , Xn be a random sample from a N(μ,σ2)
population. If we want to test H0: μ ≤ μ0 versus H1: μ > μ0 when
σ unknown, test procedure is to reject H0 for large values of 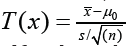 which has Student’s t distribution with n-1 degrees
of freedom when H0 is true. Thus, the P value for this one-sided test
is P-value=P (Tn-1 ≥ T(x)). Again, if we want to test H0: μ = μ0 versus
H1: μ6= μ0 then
which has Student’s t distribution with n-1 degrees
of freedom when H0 is true. Thus, the P value for this one-sided test
is P-value=P (Tn-1 ≥ T(x)). Again, if we want to test H0: μ = μ0 versus
H1: μ6= μ0 then 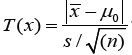 and P-value=2P (Tn-1 ≥ T(x)). R codes
for obtaining these P-values are ”1-pt(T(x), df)” and ”2*(1- pt(T(x),
df))” respectively where df is the degrees of freedom. If we want
to test these hypotheses when σ known, test procedure is to reject
H0 for large values of
and P-value=2P (Tn-1 ≥ T(x)). R codes
for obtaining these P-values are ”1-pt(T(x), df)” and ”2*(1- pt(T(x),
df))” respectively where df is the degrees of freedom. If we want
to test these hypotheses when σ known, test procedure is to reject
H0 for large values of 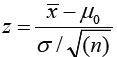 which has standard normal
distribution when H0 is true. Then P-value=P(Zα ≥ Z) where Zα is
the critical value of Z for a given level of significance α. R codes for
obtaining these P-values are ”1-pnorm(Z)” and ”2*(1- p norm(Z)) or
2*p norm(abs(Z))” respectively. Similarly, for testing homogeneity
of variances Chi-square(χ2) test statistic.
which has standard normal
distribution when H0 is true. Then P-value=P(Zα ≥ Z) where Zα is
the critical value of Z for a given level of significance α. R codes for
obtaining these P-values are ”1-pnorm(Z)” and ”2*(1- p norm(Z)) or
2*p norm(abs(Z))” respectively. Similarly, for testing homogeneity
of variances Chi-square(χ2) test statistic.
P Value and Statistical Significance
And F test statistics will be used. R codes of P-values for these
tests are ”1-pchisq (χ2, df)” and ”1-pf (F, df1, df2)” respectively
where df is degrees of freedom, df1 is the degrees of freedom for
numerator and df2 is the degrees of freedom for the denominator.
Conclusion
Nowadays reporting of p-values is very common in applied fields.
The most important conclusion is that, for testing the hypotheses,
P-values should not be used directly, because they are easily
misinterpreted. From the Bayesian perspective, P-values overstate
the evidence against the null hypothesis and other methods
to adduce evidence (likelihood ratios) may be of more utility.
Finally, in many scenarios P-values can distract or even mislead,
either a nonsignificant result wrongly interpreted as a confidence
statement in support of the null hypothesis or a significant P-value
that is taken as proof of an effect. Thus, there would appear to be
considerable virtue in reporting both P-values and confidence
interval (CI), on the basis that singular statements such as P¿0.05,
or P = Non-Significant, convey little useful information, although for
a 100(1-α) % CI, it must be remembered that any violation of the
assumptions that effect the true value of effect CI precision. From
the Bayesian perspective, Lindley has summarized the position
thus: significance tests, as inference procedures, are better replaced
by estimation methods it is better to quote a confidence interval.
Finally, p-values should be retained for a limited role as part of the
statistical significance approaches.