Lupine Publishers| Latest Trends in Textile and Fashion Designing (LTTFD)

Abstract
An infrared technique used to analyze pineapple leaf fibre-acrylic blends of different blend compositions is reported. Blend estimations are effectuated from a calibration plot between the absorption of the 2235 cm-1 band (C≡N) and the composition percentages of acrylic fibres. The theoretical and actual blend composition by chemical method divulges matching with each other.
Introduction
Usage of unexplored lesser known natural fibres in the international arena are not only the burning issues but simultaneously to search out a suitable avenue for which separate spinning system is not widely available or established in developing countries like India. Pineapple leaf fibre is another unexplored natural fibre extracted from the green pineapple leaf; an agro waste reveals its immense potentiality for use as a fibre in the arena of sustainable fashion textiles particularly due to the disposal problem after harvesting for cleaner and green environment. PALF is well known for its silky lustre which possesses some advantageous physical and chemical properties like high tensile strength, dimensional stability, considerable resistance to heat and fire, and good dye ability while the demerits are coarseness, inextensibility. It is a low cost renewable resource and eco-friendly material. Due to non-availability of specialized spinning system for PALF in India, it will be much easier to promote PALF in any of the existing spinning systems provided an appropriate processing technology is developed.
Several workers have reported blending of pineapple leaf fibres alone or in blends with other fibres [1-4], but scanty work has been reported on the analysis of PALF blends since the early work by Dey et al [5]. Numerous methods are available for analyzing fibre blend composition, of which the chemical method is commonly employed when a sufficient sample is available. It is more desirable to opt for a micro technique that requires smaller samples of the order of a few milligrams. Such samples can be analyzed unambiguously in order to identify variations in blend composition from place to place for quality control and investigation of fabric defects that cause streaks or depth-of-shade variations in fabric.
Polyester and cotton or wool and acrylic fibres are complimentary to each other due to their versatility. Since PALF is often blended with acrylic fibres to improve performance and hand, information on specific changes that occur during blending should be of interest. The infrared spectrophotometer is a vital instrument for both qualitative and Quantative analysis of polymer blends. The occurrence of non-overlapping absorption bands in IR spectra makes such analysis easier and more reliable. Various examples of quantitative determinations of fibre blends have been reported including ramie/acrylic by Dey et al, cotton/Dacron by O’Conner [6], wool/ Terylene by Clark and Hickie [7], cotton/polyester by BhamaIyer et al. [8], and acrylic/wool by Soosamma et al [9]. In this paper, the authors report a simple technique based on an IR method for quantitative analysis of PALF/acrylic blends.
Materials and Methods
Specifications of Acrylic fibres-no shrinkable, 3 denier, 120 mm long, from Indian Petrochemicals Corporation limited (I.P.C.L) Baroda and pineapple leaf fibre from ICAR-Central Research Institute for Jute and Allied Fibres, Sorbhog, Assam procured for this research work. All chemicals were analytical grade. The average fineness and tenacity of the pineapple leaf fibre were 2.67 tex and 271.84mN/tex respectively. Acrylic fibres in this experiment having liner density of 0.33 tex and tenacity of 241.52 mN/tex. Decorticated PALF and acrylic fibres were blended at the first drawing stage in five different blend compositions 83:17, 67:33, 50:50, 33:67 and 17:83. Yarns of 84 tex were spun on a rove spinning machine using modified conventional jute processing machinery with blend proportions of PALF ranging from 17 to 83%. Samples need to be taken from all parts of the bulk sample in order to obtain representative test samples for blend analysis; this is known as zoning [10] and is an important step in preparing test samples.
Sample preparation and calibration plot
Acrylic and PALF fibres were finely cut with scissors and sieved through a 100 mesh screen. Acrylic/pineapple leaf fibre blends of predetermined compositions were prepared by carefully weighing finely cut fibres. The fibre mixture was mixed thoroughly with 400 mg spectral grade KBr powder by grinding for 5 minutes with a mortar and pestle. The sample-KBr mixture was placed in a die and pressed for 5 minutes under a pressure of 421.85 Kg/cm2. The sample was also subjected to evacuation in the die for 5 minutes prior to pressing. The pellets were taken from the die and mounted on a magnetic pellet holder. These pellets transmitted in the range of 20-80% while being scanned. A standard calibration plot was obtained by measuring the absorbance of the nitrile (C≡N) band.
a) Blend analysis: The same procedure was followed to analyze the blend composition of five different blended yarn samples. A known quantity of the sample was powdered thoroughly and mixed well and 4 mg of the sample was weighed accurately and mixed with 4oo mg of KBr. For each sample, two sets of pellets were prepared as described earlier (Figure 1).
Figure 1: Calibration Plot for determination of Acrylic content in Pineapple leaf fibre/acrylic blends by measurement of Absorbance of (C≡N) band.

b) Spectra Recording: Spectra of the Pellets were recorded by a Shimadzu double beam model IR PRESTIGE-21 spectrophotometer from 4000 to 400 cm-1 under a normal slit program and a scanning speed of nearly 19s/100cm-1. A KBr pellet without the sample was used in the reference beam. For each pellet, the nitrile band at 2243 cm-1 was scanned twice, the second scan corresponding to rotation of the pellet through 90°in its own plane with reference to the first position. If the transmittance differed by more than 1%, this was taken to indicate no uniformity of mixing the samples. Fresh pellets were prepared again discarding such samples and their spectrum was recorded. The peak intensity (absorbance) in each case was measured by the baseline technique [11].
c) Chemical Analysis of Blends: The actual blend proportions were determined chemically as per the method IS: 3421-1966 for blend estimation [12]. All samples were extracted with a benzene-methanol (3:2) mixture to remove oil and any finishing materials that had been added during processing. Each blended sample was analyzed twice and the average value was reported in Table 1. Dey et al reported that the blend compositions of ramie-acrylic blends can be unambiguously assessed using infrared spectra with the help of calibration plot15. These compositions match those obtained by chemical methods (Table 1).
Results and Discussion
Acrylic fibres exhibit a strong nitrile band (C≡N) with a maximum at 4.48μ (2235 cm_1). This band is used for estimating the acrylic composition in blends. Regardless the origin of acrylic fibres, the position and intensity of the nitrile band are not much affected. The nitrile band is also independent of other functional groups, and so blend analysis by means of the infrared absorption spectra of the (C≡N) band is justified. Measurements of the intensity of the nitrile band for a series of acrylic/Palf blend samples yielded a calibration plot, shown in Figure 1. The individual points fall very much on a straight line, and scattering from the KBr disks is no problem. The calculated correlation coefficient is 0.9986 which is highly significant. BhamaIyer et al. observed that particle size plays a very important role in the peak intensity of the C=O stretching band of the carbonyl group in polyester, the absorption band recommended for analysis of cotton/polyester blends [13,14].
Table 1: Blend Extimation by Chemical Method.
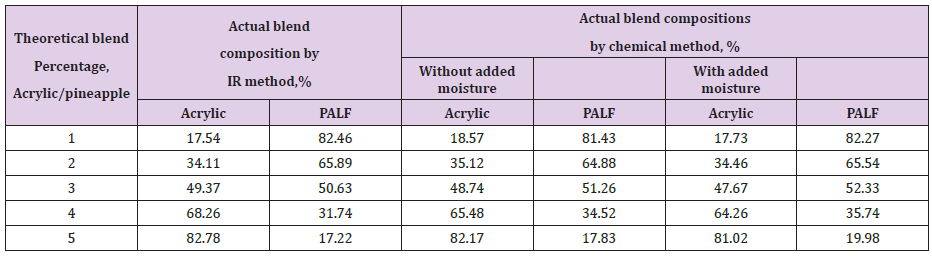
Figure 2: Infrared spectra of (a) PALF, (b) 50/50 PALF/ acrylic, and (c) acrylic fibre.
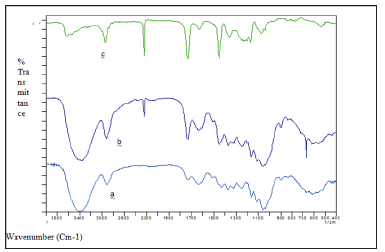
The absorbance of the C=O band versus composition does not yield a straight line. Soosamma et al. reported in their earlier work that the intensity of the (C≡N) band remains unchanged during ball milling period. This indicates that below a certain particle size, ball milling does not have any effect on the (C≡N) band. Hence, the absorption of the (C≡N) band versus composition gives a straight line. From such a calibration plot, the actual composition of any blend sample can be obtained rapidly with high accuracy. Blend compositions of the yarns based on the theoretical blend compositions of PALF/acrylic yarns spun on the jute spinning system measured by means of calibration plots and chemical methods are enumerated in Table 1. Figure 2 reveals the nature of the infrared spectra of PALF, 50%/50% PALF/acrylic blend and acrylic fibres. The results obtained with the infrared method using a calibration graph show the true compositions as given by the chemical method to a high degree of accuracy. After gaining some familiarity with the spectra of fibres, IR spectroscopy can provide a good technique for estimating blend composition-rapidly, reliably and with reasonable sensitivity.
Conclusion
The calibration plot will help to assess the blend compositions of acrylic/PALF blends unambiguously using their infrared spectra. The theoretical and actual blend composition by chemical method unveils matching with each other.
Read More About Latest Trends in Textile and Fashion Designing (LTTFD) Please Click on Below Link: https://fashion-technology-lupine-publishers.blogspot.com/
No comments:
Post a Comment
Note: only a member of this blog may post a comment.