Lupine Publishers| Journal of Nanomedicine
Abstract
Metals like lead, copper, cadmium dispersed in environment. Heavy metals considered toxic. They have adverse and acute after effects on humans. These metals although have beneficial effect but hazards are pronounced. Level of heavy metals is increasing due to rapid industrialization and pollution. Toxicity of metals causes diseases and health issues among people. It is complicated to measure possible health risk of occupational persons. So detection of these metals in blood is important issue. Even at low amount intake of trace element can lead to health problems among people. Blood is directly influenced by toxicity when inhaled these metals from environment where existence of heavy metal is high. This presently, initiate to work on scientific detection of metals effect on human and health assessment. From study metals copper, cadmium, lead concentration in blood samples were found slightly above the recommended values. Cadmium concentration examined at moderate. Results predict the lowest and high concentration in whole blood of contacted HM group was (0.56–8.78ppm) and (.08 – 4.67ppm). Cadmium highest value among whole blood exposed samples range (.03 - .98 ppm). Range of copper in blood from table in whole blood is from (0.01 – 1.107ppm).In affected person’s blood samples metals found at greater level and related with contact period. Inhalation of fumes of metal in industrial places causes hazards.
Keywords: AAS, Copper, Cadmium, Lead, Whole Blood, Serum, Vaccutainer, Nitric Acid, Heavy Metals, Nitrification
Introduction
Irnius [1] worked on heavy metals copper, cadmium, and lead by using FAAS techniques. He proved that metals present in blood makes bond with blood and are hazardous for health. He compared the toxicity level and influence of theses metals on health. Tautkus [2] investigated metal concentration of cadmium, lead and cobalt in diseased persons by using AAS techniques. After centrifugation sample of blood were burned in furnace followed by nitrification. He concluded that these metal concentrations were under below limits because they were bonded with blood cells. These metals were present in different form. He also worked on presence of metal in blood cells and plasma. Ivanenko [3] analyze the trace metals in blood by using technique GFAAS. Samples were diluted only with 1:5 ratio .Digestion pretreatment was not performed. It consumes time and makes it possible to use in precise research. Trace elements in whole blood were determined by graphite furnace atomic absorption spectrometer. This technique is advance and modulated techniques which need no sample digestion before analysis this work illustrate the metal analysis by using only deionized water. As surface modified noble gases were used. Results of metal concentration were found precise. Blood samples were collected in vacum tube. This technique can be used for toxic metals investigation Ivanenko [4].
Blood estimation of thallium direct analysis by applying Zeeman absorption background. Digestion process of sample not necessary in this research .Five time dilution of samples with tritox was performed .0.2microg/liter was the limit of the estimation of thallium. The blood samples were directly entered into furnace of instrument these performed experiment give accurate result for whole blood samples analysis. Procedure is validated. This is conventional method for determination of heavy metal in blood samples. Level of trace metal in blood is in small amount in this study. Accuracy was achieved successfully. Kensova [5] used EDTAa indicator and metal lead coordination was studied in blood. Heavy metals are very toxic mostly lead present in plasma instead of whole blood. A minute amount cause cancer but results were still inconclusive. Limited data was also collected with changing metal. Cobalt instead of lead which is less harmful as metal mentioned above plasma sample were micro wave digested. After that these mixture were analyzed by using electrochemical atomization for determination of trace metals carbon electrode was used .multi instruments were used to estimate the blood plasma lead and found compatable.
Perumal [6] worked on lead and chromium in humans whom exposed to these metals mostly workers of industries. These metals were collected from different industries. Samples were washed digested and analyzed .The concentration of metal resulted high due to environmental issue or food intake and chemical industries .in this research scientist also observed that lead level is high in males instead of female. Concentration of heavy metal was different in different location of under observed area. Metal concentration found inverse relationship with age. Zhang [7] in this study lead and harmful metal cobalt was analyzed by using atomic absorption. The present study emphasize on heavy metal toxicity, effect on human health, beside this it also cover different analytical technique for metal detection, digestion method, and results of work of previous research workers.
Materials and Methods
Reagents and Solution
Analytical reagent grade HCl and HNO3 were procured from E. Merck Germany. Certified standard solution of copper, lead, cadmium was prepared. Fresh standard solution was prepared from stock solution whenever required in work. They were diluted with 5% HNO3 solution in distilled water. Blank solution were treated and prepared exactly in same way. Nitric acid HNO3 (perk grade 65%), Hydrogen peroxide H2O2 and De ionized water used was de ionized in all standard solution. Washing of all equipment was done by distilled water [8].
Apparatus
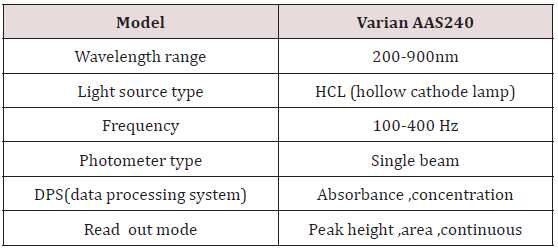
All glassware and apparatus used were cleaned by soaking in nitric acid before use. All working solution was prepared in deionized water. AAS model Varian AA 240 was used for blood samples analysis. Triplicate sample prepared to ensure the accurate results [9].
Specification of AAS
For precise work correct analytical procedure glassware used were high quality and were borosilicate Pyrex glass. Leaching effect of chemicals was not susceptible. Glassware used were of 50, 100, 250ml flasks, beakers, and pipettes, measuring cylinders. Calibrated apparatus were used Specification of AAS (Table 1).
Sample Selection
Criteria of selection of blood samples are cited below. There were different working places and common places of Lahore. The age was between 25-60yrs. Working duration period of exposure was noted. Freshly collected blood samples were analyzed. All blood samples from industrial or non industrial places followed by aseptic condition. Amount of blood sample was 5ml from forearm and kept in median cubital vein. Samples were divided in two parts first kept into the anti coagulated Vaccutainer and other 3ml collected in serum Vaccutainer.36 blood samples were collected from different places of Lahore mostly exposed and non exposed from heavy metals in November 2014 [10]. Blood were collected into phlebotomist from median cubital vein with sterilized disposable syringe . Ant coagulant was added for whole blood analysis and place in refrigerator.
Physical parameter determination of blood
Examination includes quantity of blood, age of blood taker, residential area, and contact time period of heavy metal acquision. Quantity of blood was equal for all samples .All samples were collected at same cite of persons [11-13].
Preservation of blood samples
After collection and examine the blood samples of persons blood samples were divided into two parts .First for analysis of total blood and other for serum. Centrifugation process separate blood and serum. Serum after adding de ionized water analyzed by instrument after digestion. For whole blood samples wet digestion apply before analysis. Blood samples before analysis were kept in freezer.
Digestion of samples
Different method of digestion are prescribed as pretreatment like dry digestion process, wet digestion procedure and microwave digestion process digestion in this work used is wet digestion for optimization. Wet digestion includes decomposition by acids carried out on hotplate. Same procedure can also be done in aluminum heating block, closed vessels at high P, with thermal heating. Took 5ml of sample in 100ml volumetric flask, followed by adding 10ml of nitric acid. Put it on hot plate for round about 2hr and allowed temperature to increase 160C.Continued boiling regularly for two hour to reduce volume .Filtration applied to samples by filter discs which were grade of 389 and blood samples kept allowed to cool. After completion of digestion add 10ml of hydrogen per oxide. At the end dilute it up to 50ml and filtered. Important parameters under investigation were acids volume, digestion time period, pre digestion period, temperature and also the amount of samples [14- 16].
Sample and standard solution preparation for analysis
Blood samples were prepared in two steps. Preparation of standards (Cu, Cd ,pb) was done followed by wet digestion and analysis of HM. Standards of different concentration for heavy metals prepared from SS (standard solution). There was correlation in standard and signal. Working standard produced by liquefy solution. After signal analysis graph was plotted. After all, concentration of unknown metal found by graph.
Result and Discussion
Standard calibration of metal
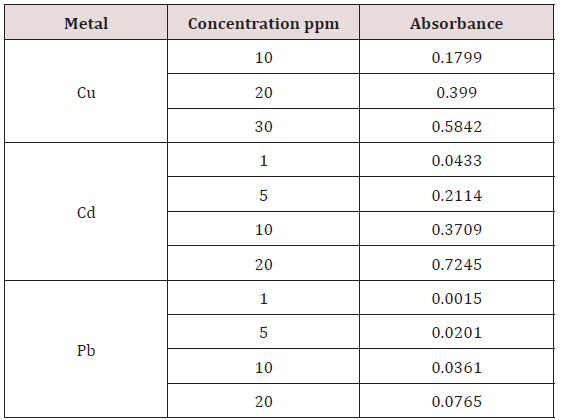
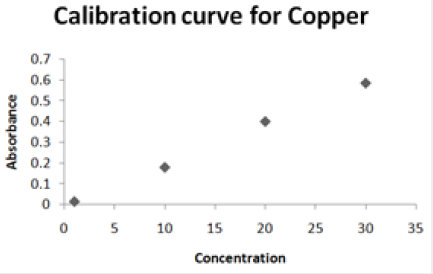
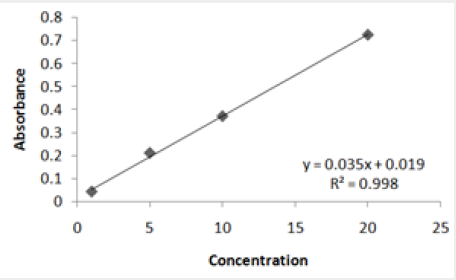
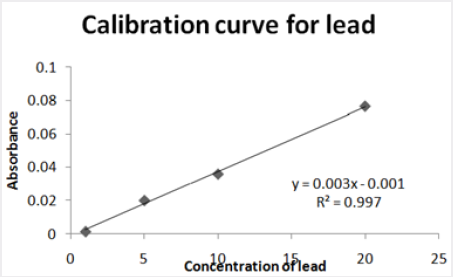
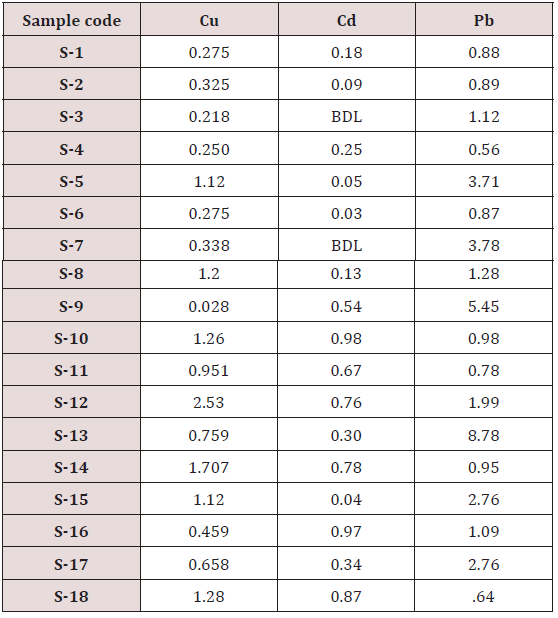
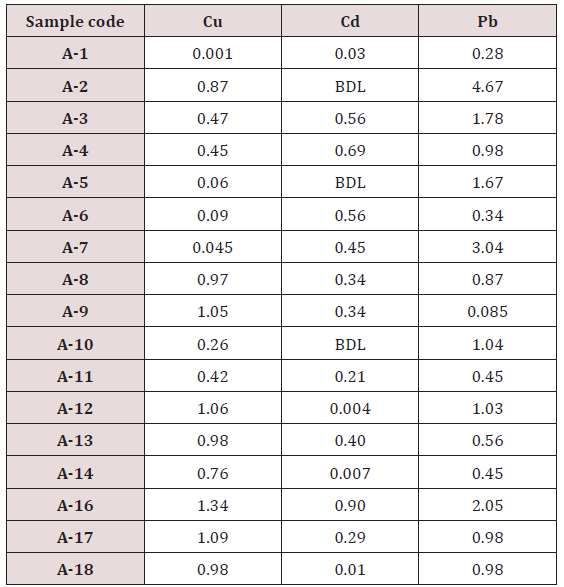
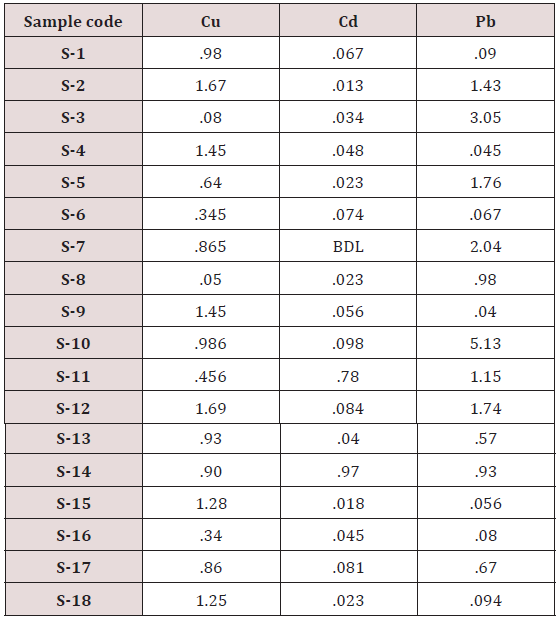
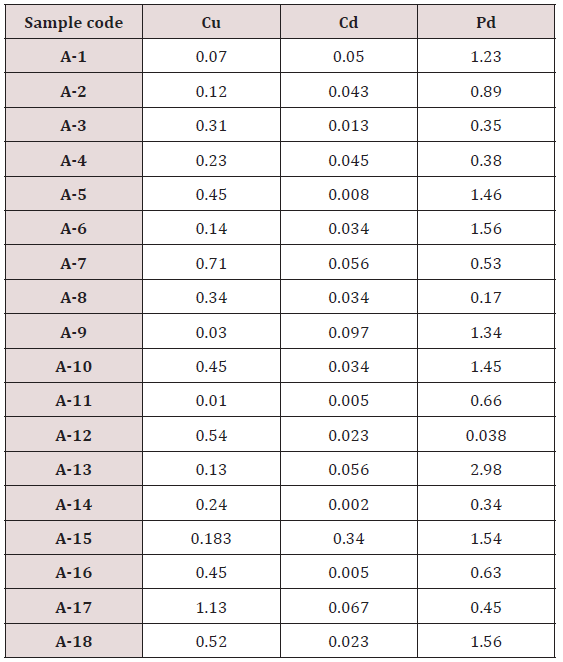
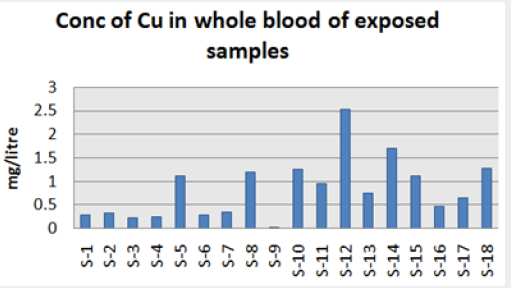
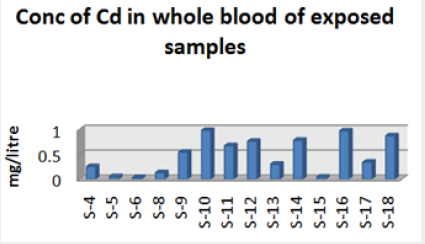
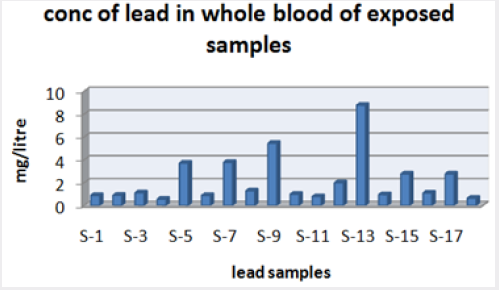
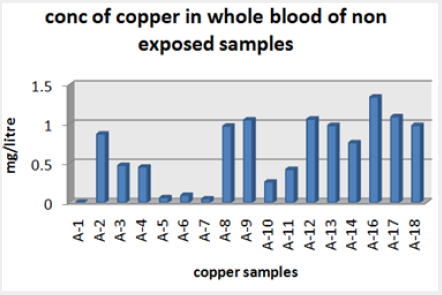
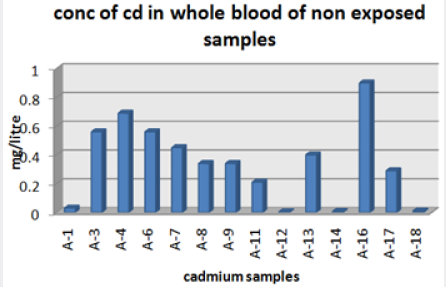
Absorbance of different concentration of metals is given below for calibration (Table 2) and (Figures 1-3). Calibration curve for Cu was straight line. Linear regression was shown to Y=0.019X-0.007 with R=0.998. Calibration curve for Cd was straight line .linear regression was shown to be Y=0.035-0.019 with R=0.998 while the calibration curve for Pb was straight line .linear regression curve was shown Y=0.003X-0.001 with R=0.997.Concentration of lead, cadmium, copper (mg/liter) in whole blood of exposed samples (Table 3). Concentration of lead, cadmium, copper (mg/liter) in whole blood of non exposed samples (Table 4). Concentration of copper, cadmium, leads in serum blood of exposed samples (Table 5). Concentration of copper, cadmium, lead in serum blood of non exposed samples Table 6.
Range of metal concentration in (mg/liter) in blood
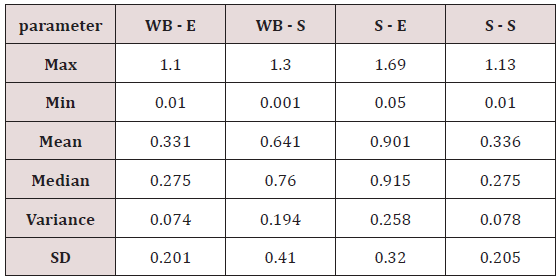
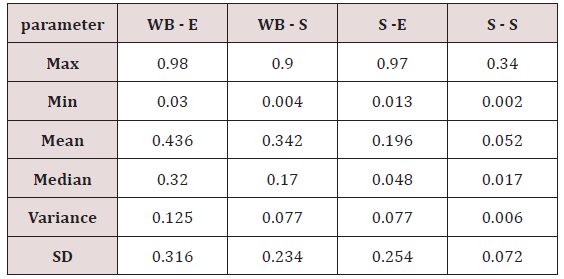
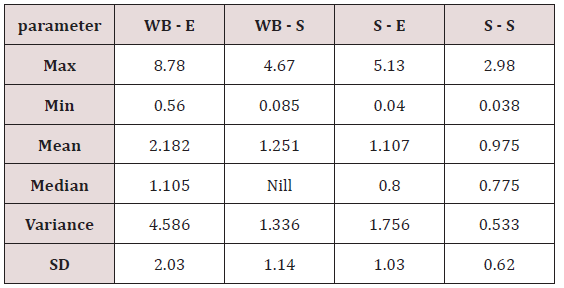
Maximum and minimum limit in blood samples was not regular. In whole blood exposed and not effected samples found increase lead metal. Copper and cadmium level moderate. There was not gradually fall or up in serum samples. Random range of copper, cadmium, lead is listed in table 7. Mean, median, maximum and minimum were calculated by statistical formulas. Mean was calculated as Mean = total sum all of blood samples/total no of blood samples. Variance was calculated by subtracting mean from individual reading and squares the resulted value. After that sum up all the square digits divided by n-1 no of blood samples. Standard deviation was calculated then taking square root of variance. Analyzed all the blood and serum samples statistically. Results after calculation are listed in (Tables 8-10) and (Figures 4-9). Study has shown that heavy toxic metals are increasing in exposed working people or persons directly in touch with toxicity.
A little bit different trend of metal existence in serum and whole blood was examined. Lead metal concentrate most in whole blood rather in serum. Cadmium and copper present in both in almost same amount. Lead and copper level observed high as compared to cadmium which was very low. There may be many other reason of high HM level in environment but we focus on working and common places use of these. Although level was not too much high in blood sample but toxicity effect are menacing. This study undertaken metal level in blood .Analysis of three prominent metals result shows level of increase trend is not parallel. Lead metal concentration high than copper and its amount comparatively higher then cadmium. All metals results show that elevation is above stated safe amount. Graphically comparison also performed. Blood serum and WB samples HM amount was not same. Study also reveals that elevation is positive influence by their working places. Exposed persons are in danger of toxicity. Moreover, exposed samples observed high values than general one. Furthermore it should be recognized good health and protection measures are required.
To Know More About Lupine Publishers Journal of Nanomedicine Please Click on Below Link: https://lupine-publishers-nano-science.blogspot.com/



No comments:
Post a Comment
Note: only a member of this blog may post a comment.