Showing posts with label agricultural engineering journals. Show all posts

Wednesday, 7 July 2021

Lupine Publishers| Influence of Inoculation Methods of Rhizobial Strains Having ACC-Deaminaze Activity on Growth and Yield of Rice Crop Under Salt-Affected Field

 Lupine Publishers| Current Investigations in Agriculture and Current Research (CIACR)


Abstract

A field experiment was conducted at Soil Salinity Research Institute, Pindi Bhattian, experimental farm to evaluate different Rhizobial inoculation methods on growth and yield of rice (Oryza sativa) cv. Basmati-385 under natural salt-affected soil (pH= 8.55, ECe= 5.32 dSm-1 and SAR=25.46) during 2015-16. Seeds of rice were inoculated with four rhizobial strains (RPR-32, RPR-33, MW- 20 (PSB) and SBCC (M8) in three ways i.e. rice seeds inoculated for direct seeding and nursery and dipping seedling roots in the solutions of these rhizobial strains. Maximum tillering was observed with all strains under different inoculation methods. Although, the strains performed better as compared to control, however, dipping of nursery roots produced significantly higher yield followed by seed inoculation for direct seeding. Overall, among all the rhizobial strains, MW-20 (PSB) and SBCC (M8) produced comparable paddy yield. The highest paddy yield (291gm-2) was harvested with SBCC (M8) seed inoculation which was 19% more than that of un-inoculated (control).

Keywords: Rhizobial strains (RPR-32, RPR-33, MW-20 (PSB) and SBCC); Rice; Number of tillers and Paddy yield

Introduction

Rice is a grain crop for feeding more than half of the world population [1]. The entire form of life is reliant on plants as they produce oxygen and form the staple food for humans and animals. According to report, 98% of the world’s food necessities are fulfilled by 12 plant species and 14 animal species. Above 50% of the world energy ingestion is met by crops such as wheat, rice and maize [2]. Soil salinity is one of the chief abiotic factors affecting soil microbial activities and crop productivity. Reports showed that over 20% of agricultural land internationally is affected by salt [3]. It is estimated that the salinization will cause the loss of 50% arability of agricultural land by the middle of the 21st century [4]. Saline soil adversely retards the plant growth and productivity by shifting the normal metabolism of plants. Mitigation of salinity stress by plant growth promoting rhizobacteria plants. One of the effects of salt stress is an increase in the band of 1-aminocyclopropane-1- carboxylic acid (ACC), a precursor of ethylene, which consequences in accretion of ethylene. Increase in the rank of ethylene away from a threshold level is termed ‘stress ethylene’, which minimizes plant growth [5] and alters photosynthesis and photosynthetic components [6]. Besides salt stress, other stresses such as flood, drought, wounding, pathogen attack, temperature stress, and mechanical stress also contribute to considerable rise in the level of endogenous ‘stress ethylene [7].

Bio-fertilizers are defined as biologically active products or microbial inoculants of bacteria, algae and fungi (separately or in combination), which possess the innate ability either to fix or mobilize important nutrient elements from non-usable forms through biological process. Bio-fertilizers also include organic fertilizers (manure, etc.), which are rendered in an available form due to the interaction of micro-organisms or due to their association with plants. They need to be applied to soil to enhance microbial activity in the rhizosphere playing a significant role in integrated plant nutrient systems [8]. Excessive and imbalanced use of chemical fertilizers has adversely affected the soil causing decrease in organic carbon, reduction in microbial flora of soil, increasing acidity and alkalinity and hardening of soil. Moreover, excessive use of nitrogenous fertilizer is contaminating water bodies’ thus affecting aquatic fauna and causing health hazards for human beings and animals. Hence world is shifting gradually to replace chemical fertilizers with Bio-fertilizers. Bio-fertilizers are organisms that enrich the nutrient quality of soil [9]. For many farmers, BNF is, therefore, an essential, cost effective alternative or complementary solution to industrially manufactured N fertilizers for staple cereal crops [10,11] reported that calcium and phosphorus were limiting factors for BNF under acidic soil conditions.

In Pakistan, phosphorus in soil is generally quite abundant but it reacts readily with iron, aluminum and calcium to form insoluble compounds. These reactions result in very low phosphorus availability and low efficiency of phosphorus fertilizer used by the plants [12]. The outcome of PGPR on agricultural crops has been investigated and published by various scientists during the last two decades [13-17]. The capability of these strains for improving plant growth was tested in agriculture by using bacterial inoculation in greenhouse as well as under natural field conditions [18-20]. Ethylene is a simple, two-carbon, unsaturated hydrocarbon which is a potent regulator of plant growth and progress [21]. Initially, ethylene was known as a ripening hormone, but later demanding studies, tied with the advent of highly sophisticated analytical techniques, like gas chromatography, unveiled its role in growth and development all over the life cycle of the plant. Because of its varied and effectual role in plant growth and development, ethylene virtues equal category with other classes of plant hormones [22]. Therefore, a field experiment was conducted at Soil Salinity Research Institute, Pindi Bhattian, experimental farm to evaluate different Rhizobial inoculation methods on growth and yield of rice (Oryza sativa) cv. Basmati-385 under natural salt-affected soil.

Materials and Methods

A field experiment was conducted at Soil Salinity Research Institute, Pindi Bhattian, experimental farm to evaluate different Rhizobial inoculation methods on growth and yield of rice (Oryza sativa) cv. Basmati-385 under natural salt-affected soil (pH= 8.55, ECe= 5.32 dS m-1 and SAR=25.46) during 2015-16. Seeds of rice were inoculated with four rhizobial strains (RPR-32, RPR-33, MW- 20 (PSB) and SBCC (M8) in three ways i.e. rice seeds inoculated for direct seeding and nursery and dipping seedling roots in the solutions of these rhizobial strains. Randomized complete block design was applied with three replications. The data obtained were subjected to statistical analysis using the STATISTIX statistical software (Version 8.1) and the mean values were compared using least significant difference (LSD) [23].

Results and Discussion

Table 1: Effect of inoculation methods of Rhizobial strains having ACC-Deaminaze activity on growth (plant Height, panicle length and number of tillers) of rice crop under saline environment.

Lupinepublishers-openaccess-Agriculture

Values followed by same letter(s) are statistically similar at P=0.05 level of significance.

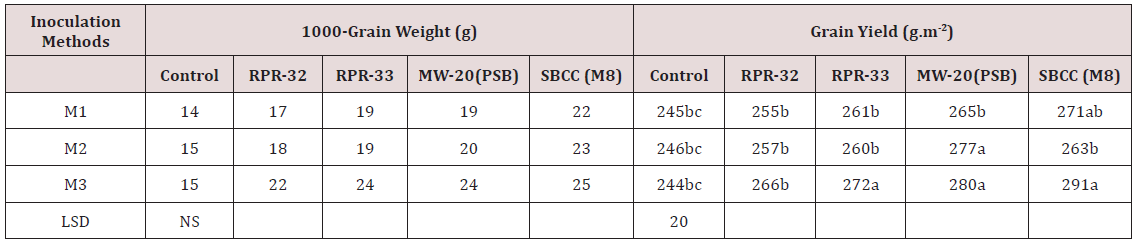
Growth parameters (plant height, panicle length and tillering) data was represented in Table 1. Plant height and panicle length showed non- significant results among three inoculation methods. However, all the inoculation methods exhibited better performance than control i.e. without-inoculation.MW-20(PSB) attained the highest plant height (117cm) in seedling root dipping inoculation methods. Similar trend was also predicted in panicle length. Significant results were indicated regarding tillering of the rice plants. SBCC (M8) rhizobial got maximum number of tillers m-2 (245) among other rhizobial strains, Seedling root dipping technique was the best inoculation method than other two methods. Maximum tillering was observed with all strains under different inoculation methods [24] investigated that biozote significantly affected on germination, root length, fresh weight and dry weight in all mung bean varieties [25] concludes that growth of maize plants behaves better under saline environment as inoculated with different rhizobial strain showing ACC Deaminaze activity due to the production of ethylene under stressed conditions. Reduction in sodium uptake by the utilization of different rhizobial strains under saline environment is a positive sign to induce salt tolerance biologically. Data regarding 1000- grain weight and grain yield indicated in Table 2 Non- significant results were attained in 1000- grain weight among inoculation methods as well as rhizobial strains. But three inoculation methods performed better than control. SBCC (M8) rhizobial strain produced the highest 1000- grin weight (25g) among other strains under seedling root dipping inoculation method [26] resulted that growth of wheat plants performed better under saline environment as inoculated with different rhizobial strains due to the production of ethylene under stressed conditions.

Table 2: Effect of inoculation methods of Rhizobial strains having ACC-Deaminaze activity on1000- grain weight and yield of rice crop under saline environment.

Lupinepublishers-openaccess-Agriculture

M1 = Seed Inoculation for DSR M2 = Nursery Seed Inoculation M3 = Seedling Root Dipping Values followed by same letter(s) are statistically similar at P=0.05 level of significance.

Although, the strains performed better as compared to control, however, dipping of nursery roots produced significantly higher yield followed by seed inoculation for direct seeding. Overall, among all the rhizobial strains, MW-20 (PSB) and SBCC (M8) produced comparable paddy yield. The highest paddy yield (291gm-2) was harvested with SBCC (M8) seed inoculation which was 19% more than that of un-inoculated (control) [27] reported the reduction in sodium uptake by the utilization of different rhizobial strains having ACC deaminaze activity under saline environment is an encouraging sign to induce salt tolerance naturally and reduce the toxic effects of utilization of chemicals for reclamation of salt – affected lands.

Conclusion

This study concluded that maximum tillering was observed with all strains under different inoculation methods. Although, the strains performed better as compared to control, however, dipping of nursery roots produced significantly higher yield followed by seed inoculation for direct seeding. Overall, among all the rhizobial strains, MW-20 (PSB) and SBCC (M8) produced comparable paddy yield. The highest paddy yield (291gm-2) was harvested with SBCC (M8) seed inoculation which was 19% more than that of uninoculated (control).

Read More About our Lupine Publishers Current Investigations in Agriculture and Current Research (CIACR)  Please Click on Below Link: https://lupinepublishers-agriculturalsciences.blogspot.com/

Wednesday, 3 March 2021

Lupine Publishers | The Newest Agricultural Technologies

   Lupine Publishers | Current Investigations in Agriculture and Current Research


Abstract

The primary objective of agricultural production is to provide an economical, sustainable and productive industry in plant and animal production. For this purpose, alternative solutions are provided to the problems that need solution or improvement and to facilitate agriculture in various areas such as increasing productivity and product quality, minimum input usage, food reliability, protection of natural resources and environment in agricultural production. In this study, the technologies which are successfully applied in plant production and animal breeding were addressed by taking into consideration the advances made especially in recent years.

Keywords: Precision agriculture; Smart farming; Precision livestock farming; Autonomous tractor; Unmanned aerial vehicles

Introduction

The agricultural sector has been adversely affected by global market instabilities, economic crisis, animal diseases and climate changes in recent years. In addition, structural problems such as the average size of farms not allowing adequate investments to increase productivity, absence of large-piece agricultural lands, lack of education, agricultural employment and population growth as well as the emergence of alternative uses of agricultural products such as biofuels cause inefficiencies [1]. Due to the rapid increase in the world population and urbanization, agricultural land per capita and natural resources such as water are decreasing due to the decrease in agricultural areas. For this reason, it has become necessary to increase productivity in agricultural production through technological and genetic methods. Excessive use of chemicals and fertilizers, during the intensive agricultural practices made to increase efficiency, has caused problems such as environmental pollution in soil and ground water and the loss of the production power of the field over time. Today, increasing product quality, minimum input usage, food reliability, protection of natural resources, increased environmental awareness, economic production and sustainable agriculture concepts have become a priority, despite the previous goals of increased yield and productivity.

As a result of the rapid developments in information technology following the mechanization, automation, and control technologies during the development period of agricultural production, today, intelligent machines and production systems that control machines have begun to take over traditional production methods. Information technology consists of hardware, algorithms and software developed for the management of the collection, processing, storage, transfer and use of information processes. The implementation of present knowledge and experiences in agriculture together with the machine learning, deep learning, artificial intelligence, modeling and simulation applications enabled the development of real-time and automated expert systems, autonomous tractors or agricultural machines and agricultural robotics applications.

Precision Agriculture

Precision agriculture technologies, combining with control, electronics, computer and data base with the account data, present an advanced system approach. Using global positioning system, geographic information system, variable rate application and remote sensing technologies, precision agriculture technologies, contrary to common fixed-level application methods which are applied at all same to whole land, use the variable-level application methods (based on application of fertilizer and chemicals to each section to its own needs, tillage at different levels, planting at different norms, irrigation and drainage at different levels) determining land and plant characteristics of small sections (soil moisture, nutrient level of soil, soil structure, product requirements, yield, etc.). As a result, Precision agriculture technologies are agricultural production and management methods whose targets are more economic and more environmentally sensitive production [2].

Precision agriculture practices start with the acquisition of data through the use of various sensors and remote sensing technologies and continue with the determination of soil properties of the production area through soil tests. All information such as yield values, fertilizer and pesticide application norms, climatic data, topographic data, weed density, disease status of the previous production seasons are associated with their actual location in the production area. Then, the applications to be done are decided using appropriate hardware and software. And, it ends with the application of variable-level practices in the field according to the application form decided. In addition, variable rate application systems and real-time product monitoring systems have been developed as a result of the sensors and software developed by the manufacturers of precision agricultural equipment and technologies:

a) Increased production efficiency,

b) Improved product quality,

c) The use of more effective chemicals and other inputs,

d) Energy saving,

e) The soil and ground water protection.

In addition to the production of field crops, precision agriculture technologies have been successfully applied in vineyards and orchards, pasture and meadow management and in animal production. Applications vary from tea industry in Tanzania and Sri Lanka to sugar cane production in Brazil, rice in China, India and Japan, grain and sugar beet production in Argentina, Australia, Europe and the United States [3]. Although it is expressed using different terms such as precision agriculture, precision farming, smart farming, variable rate application, site specific farming, site specific management, computer aided farming and prescription farming, the term smart farming has become more widely used recently.

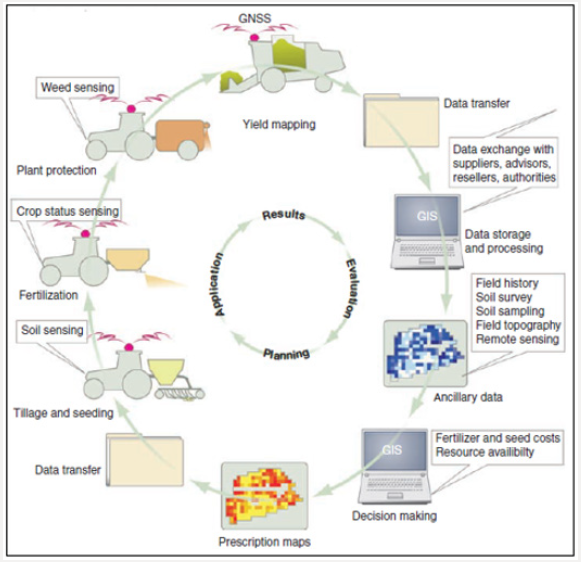
Figure 1: A typical crop growing cycle in precision agriculture [5] modified [4].
Lupinepublishers-openaccess-Agriculture

The precision agriculture, or the knowledge-based management of agricultural production systems, has emerged in the mid-1980s as a method for implementing the right process at the right time in the right place. The increased awareness of the variability in soil and product conditions has been combined with emerging technologies such as global navigation satellite systems, geographic information systems, and microcomputers. In the beginning, precision agriculture has been used to adapt the fertilizer distribution to the variable soil conditions in the agricultural area. Since then, additional applications have been developed, including the automatic steering applications of agricultural vehicles, autonomous machinery and processes, product monitoring, farm research and software for the general management of agricultural production systems. A typical crop growing cycle in precision agriculture is shown in Figure 1 [4].

Precision Livestock Farming

The first desired condition in animal production is breeding races with higher meat and milk yield. Second one is to make sure that the highest level of individual potential of animals is achieved through an adequate and balanced nutrition. The third is to take preventive health measures against diseases that cause the major losses in animal production and to minimize the use of drugs with the early detection of diseases and the necessary intervention [5]. Precision livestock production practices have contributed significantly to the solution of the problems experienced in animal breeding and in increasing the desired yield and quality in meeting the increasing animal food needs. Effective decisions are made by using precision livestock production practices in animal production and by monitoring individual animal conditions (amount of mobility, water consumption, milk conductivity value, amount of milk, etc.); necessary health measures are taken as soon as possible with the early identification of negative changes in animal health; and, sustainable and productive management is provided by ensuring that the individual potential of the animals is utilized at the highest level by making the herd management applications accurate and timely [6].

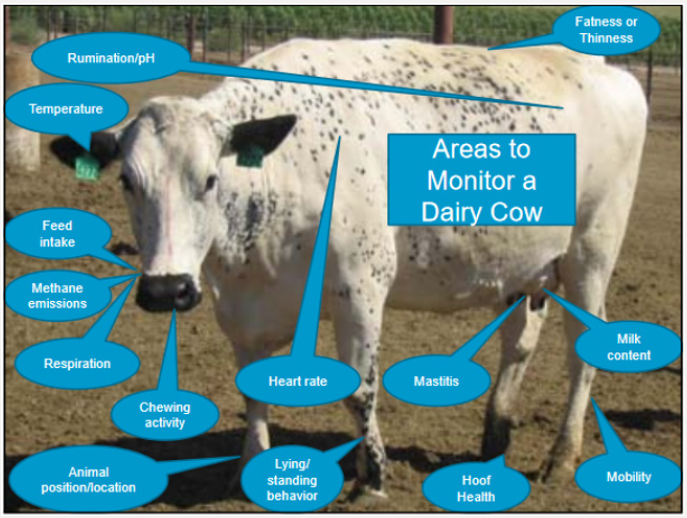
Precision livestock production allows collecting data at individual cow level as well as precision (individual) nutrition, regular milk recording (yield and components), pedometer, pressure plates, milk conductivity indicators, automatic oestrus detection, body weight, temperature, lying behavior, ruminal pH, heart rate, feeding behavior, blood analysis, respiratory rate, rumination time and movement skill scoring using image analysis. In this way, it minimizes drug (antibiotics) use and provides and proactive animal health strategy through preventive health by focusing on health and performance [7]. Benefits from precision animal production technologies include increased efficiency, reduced cost, improved product quality, minimized negative impacts on the environment and improved animal health and welfare. These technologies are likely to have a major impact on health, reproduction and quality control [8]. Figure 2 shows the areas observed in dairy cattle in precision livestock production.

Figure 2: The areas to monitor in dairy cattle in precision livestock production [9].
Lupinepublishers-openaccess-Agriculture

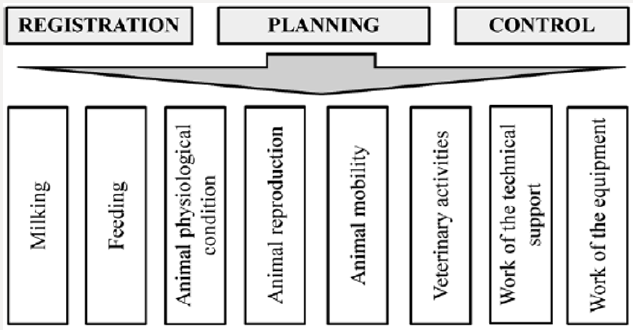
Figure 3: The tasks of the automated control systems for dairy farming [10].
Lupinepublishers-openaccess-Agriculture

Automatic control systems developed for dairy cattle farms provide solutions to the following tasks (Figure 3) [10]:

a) Getting the current information about animals;

b) Fast access to the animal history;

c) Increasing the milk yield because of the preclinical disease diagnosis;

d) Structure analysis of the herd and the animal physiological condition;

e) Reducing veterinary medicine costs;

f) Detection of the breaches in the herd reproduction technology;

g) Reducing the number of unpregnant animals and increasing the calf’s productivity;

h) Increasing the feeding effectiveness;

i) Reducing work costs and the improvement of work culture.

Autonomous Tractor

The concept of autonomous refers to the functions performed by the tractor without any human intervention. The concept of autonomous tractor and automatic steering should not be confused with each other. A tractor with automatic steering requires an operator for safety, avoiding unknown obstacles and performing unspecified tasks. An autonomous tractor can operate without the operator in overcoming the numerous uncertainties in the agricultural environment. In autonomous tractors, the necessary hardware and software are developed for obstacle avoidance, localization and mapping in addition to determining algorithms, models and methods for movement control. In order to implement route planning and navigation for this purpose, it is necessary to accurately estimate the position of the vehicle and to detect the environment sensitively during the movement of the vehicle.

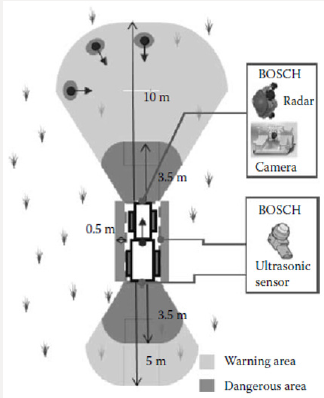
Figure 4: Safety sensor for an autonomous tractor [11].
Lupinepublishers-openaccess-Agriculture

Various equipment and systems are used to determine the position of autonomous tractors, to set the desired route correctly, and to map the obstacles and objects around correctly. The information collected from the sensors should allow the autonomous tractor to move safely. Since autonomous tractors operate in outdoor and in diverse environments, errors may occur due to inability to receive information from some of the sensors or due to the errors in the information received. For this reason, it is preferable to process the data from different sensors together and unique advantages of the different types of sensors are used together to obtain a more comprehensive perception (Figure 4). In this way, the information from the sensors provide more detailed information about the location, environment and surrounding objects during the movement of the tractor. And, in order to turn this information into useful information, advanced decision mechanisms, utilizing applications such as image, audio and video processing algorithms, neural networks, machine learning, statistical data analysis, are used and the autonomous tractor is operated successfully in this way. The equipment used in autonomous tractors are listed below:

a) Radar Sensors

b) Laser Scanners,

c) Lidar,

d) GPS / Inertial Navigation System,

e) Ultrasonic Sensor,

f) Cameras.

When developing an autonomous tractor, combining a large number of tasks to increase operational success will relatively facilitate the task. These tasks include [12]:

a) Coordination: The coordination of multiple vehicles can be done centrally. Each vehicle operates independently and does not know necessary information about other vehicles, but it has its own tasks to fulfill.

b) Solidarity: Solidarity refers to the awareness of multiple vehicles, working in the same field, from each other and tasks of the others. For example, if three vehicles carry out the same task, such as clearing the same area from the weeds mechanically, then each vehicle needs to know the rows in which other vehicles were running before selecting a new row to begin. It would not make sense to have two vehicles come to head-to-head at the same time. Real-time communication is needed between the paired vehicles.

c) Cooperation: It refers to multiple vehicles sharing the same task at the same time. Using multiple vehicles to pull a large trailer that a vehicle cannot pull alone is an example of cooperation.

Agricultural Robots

Agricultural robots are classified as indoor and outdoor robots, in general. Outdoor robots include GPS assisted steering systems, meadow robots, pruning robots, spraying robots, seeding/planting robots and silage robot. Indoor robots include harvesting robots, milking robots and barn robots [13]. Autonomous agricultural robots are now an alternative to tractors in the fields. Breeding operations can be carried out by the fleets of autonomous agricultural robots in the future, such as seed sowing, spraying, fertilization and harvesting robots. Agricultural robots must have some basic capabilities and the ability to support multiple applications. A navigation system is required for safe and autonomous navigation as a basic capability [14]. When different applications of autonomous vehicles in agriculture have been compared with conventional systems, it has been found that the first three main groups of potential practical applications include plant cultivation, plant care and selective harvesting [15].

In the last two decades, special sensors (machine vision, GPS, RTK, laser-based devices and inertial devices), actuators (hydraulic cylinders, linear and rotary electric motors) and electronic equipment (embedded computers, industrial PC and PLC) have integrated into numerous autonomous vehicles, especially the agricultural robots. These semi-autonomous/autonomous systems provide correct positioning and guidance in precision agricultural tasks, when equipped with appropriate equipment (agricultural tools or equipment) [16]. Field map can be generated by estimating the location of the plants in the surrounding environment through image processing and recorded data detected by sensors. The position estimation of the robot can be done by a navigation system or relative calculation of the movements of the robot. The distance of the plants to the robot can also be detected by sensors or image processing, and the calculated positions can be marked on a map [17].

The Use of Unmanned Aerial Vehicles in Agriculture

Aerial vehicles that can operate through remote control or autonomously with its own power system, and that can load and unload payloads depending on the place of use are called Unmanned Aerial Vehicles (UAV). There are two types of aerial vehicles, including UAVs that can fly autonomously on a certain flight plan and remote controlled drones. Although these vehicle names are commonly used interchangeably, the term UAV is a general term for all unmanned aerial vehicles, whether autonomous or remotecontrolled.

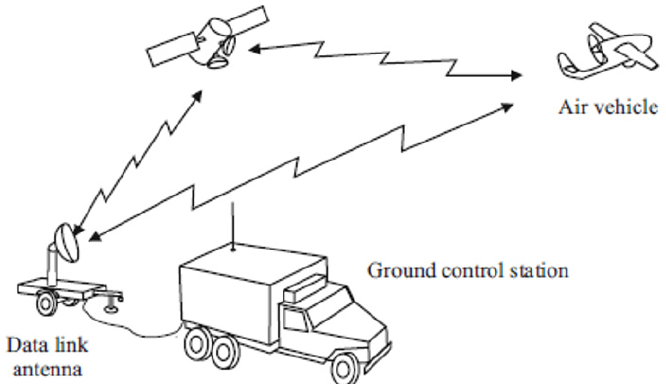
A typical UAV system consists of the aircraft, one or more ground control stations and/or mission planning and control stations, payload and data connection. In addition, many systems include launch and recovery subsystems, aerial vehicle carriers and other ground services and maintenance equipment. A very simple general-UAV system is shown in Figure 5. Being more complex and having more parts than drone systems increase [18] the cost of system installation of UAVs. In drone systems, however, drones can be used immediately after purchasing drones together with the apparatus without the need for any other costs. Due to the lower cost of purchasing than the UAVs, their ease of use and their capabilities, drones are preferred in agricultural applications.

Figure 5: Generic UAV system [18].
Lupinepublishers-openaccess-Agriculture

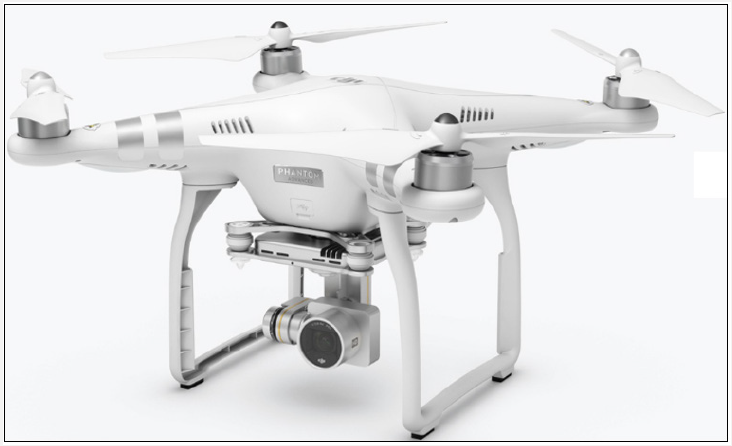
Drone systems provide fast and safe solutions and analysis for numerous situations, particularly for military applications, including natural disasters, monitoring of various sports activities, traffic control, wildlife monitoring, and agricultural applications. Therefore, drone systems are produced in different formats according to their area of use. One of the most preferred applications of drone systems is the four-rotor drone system known as the quadrotor shown in Figure 6. Quadrotor, as the name suggests, is a general term of the drone systems with four independent rotors. The most important advantage of the quadrotor is its high maneuverability. This superiority gives the quadrotor the capability of vertical takeoff and landing in dangerous and confined spaces. Due to the highpower consumption of four rotors of a quadrotor, it cannot perform long-term flight duty. The capacity of the device can be increased by increasing the number of rotors. Six-rotor hexacopters and eightrotor octocopters are the examples of different forms of quadrotor obtained by increasing the number of rotors [19].

Figure 6: Four-rotor drone system [20].
Lupinepublishers-openaccess-Agriculture

Increasing productivity and improving product quality in agricultural production depends on good monitoring of the plants’ development process and taking the necessary actions at the most appropriate time. Drone systems, which have a simple technical structure and are easy to use, offer farmers an opportunity to make plans in agricultural activities using their embedded sensors and cameras, providing high quality and 3D images. Varies studies are carried out with drone systems, such as product development monitoring, plant species separation, crop harvest determination, automatic harvest, drought, detecting diseases, agricultural pests, etc., damage detection, fruit and vegetable and soil moisture classification, field management, organization of agricultural activities, and agricultural insurance [21].

Drone systems have 5 effective use areas in agriculture. These are [22]:

a) Product status monitoring: Farmers can inspect their growing products faster and more effectively with drones with NDVI or NIR sensors.

b) Irrigation systems monitoring: Large enterprises are able to monitor irrigation systems for the supply of water needed for certain products such as corn, which are spread over large areas, after having reached specified sizes.

c) Weed identification: Weed maps are generated by postprocessing the flight images and NDVI sensor data. In this way, farmers can easily distinguish between high density weeds growing together with healthy plants.

d) Variable rate applications: Variable-rate maps are rapidly and practically generated with the use of NDVI sensors in drone systems, instead of using variable-rate application maps prepared by ground-based or satellite images. In this way, it is possible to increase the efficiency by decreasing fertilizer costs.

e) Herd management and monitoring: The amounts and activity levels of free-bred ovine or bovine animals can be monitored from above through a drone.

Conclusion

Agriculture is a vital industry due to its contribution to the sustainability of lives of people, to national income and employment and its provision of raw materials to other industries. Therefore, the agricultural sector has a direct impact on all segments of the society with its economic, social and environmental dimensions. Economically, subjects such as increasing agricultural production and farmer revenues, minimum use of production inputs, improving marketing conditions, etc. are addressed. Socially, there are topics such as food quality and safety, agricultural employment, socio-economic sustainability of rural areas, animal welfare, etc. And, environmental issues include biodiversity, protection of wildlife, meadow-pasture, forests, underground and surface waters, and soil resources. Utilizing the opportunities offered by advanced technologies is becoming increasingly mandatory in order to achieve high success in studies conducted on all these comprehensive issues, due to the importance of the subjects and difficulties involved.


Read More Lupine Publishers Agriculture Journal Article:

Tuesday, 2 February 2021

Lupine Publishers | Economic Analysis of Poverty Status of Small-Scale Farmers in Bayelsa State, Nigeria

    Lupine Publishers | Current Investigations in Agriculture and Current Research


Abstract

The study analyzed the household poverty status of small scale farmers in Bayelsa State, Nigeria using a multi-stage random sampling technique to sample six hundred farmers. Data were collected using structured questionnaire and were analyzed using descriptive statistics, FGT [1] index and the logistic regression model. The result revealed that the majority of the farmers 80% were females, while 79% of the respondent was married with 46% of them having no formal education. Twenty-seven (27) percent of the crop farmers are poor while thirtyeight (38) of the livestock farmers were poor. Also, the poverty depth and severity of crop farmers were 0.072 and 0.038 respectively whereas they were 0.098 and 0.052 respectively for the livestock farmers. The logistic regression model revealed that age, educational level, household size, farming experience, farm/herd size, household income, household expenditure and membership of cooperative contributed significantly in determining the poverty status of the farmers. This study therefore recommends measures needed to be put in place to encourage and improve the welfare of the farming household towards productive and sustainable agricultural development for poverty reduction.

Keywords: Economic; Poverty; Status; Small Scale; Farmers

Introduction

Nigeria is a vast country endowed with substantial natural resources which include; 68 million hectares of arable land, fresh water resources covering about 12 million hectares, 960 million hectares of coastline and ecological diversity that favor the production of a wide variety of crops, livestock, forestry and fisheries product [2]. These coupled with its 37 million hectares of natural forest and rangeland and total land mass of 923,768km2 [3] makes agriculture one of the prominent sub-sector. In spite of these resources’ endowment, the productivity of agriculture continues to dwindle. One of the major problems confronting Nigeria today is how to improve the quality of life in the rural areas and reduce the level of poverty [4]. Poverty in Nigeria is not only a state of existence but also a process with many dimensions and complexities [5]. The report of the 2006 Nigerian Core Welfare Indicator (CWI) on the poverty profile in the country stated that the dependency ratio, which was defined as the total number of household members aged 0 – 14 years and 65 years and above to the number of household members aged 15 – 64 years was 0.8 Central Bank of Nigeria [6]. This indicated that almost a one-to-one dependency ratio and reflected the high population growth rate in the country. There is also large income inequality with the top 10% of the income bracket accounting for close to 60% of the total consumption of goods and services [7].

The World Bank [8] describes poverty to comprise of many dimensions. It includes low incomes and the inability to acquire the basic goods and services necessary for survival with dignity. It encompasses low levels of health and education, poor access to clean water and sanitation, inadequate physical security, lack of voice and insufficient capacity and opportunity to better one’s life. It may also result in not having enough capacity to feed and clothe the family and/or earn a living. About 90% of the country’s food is produced by small scale farmers cultivating tiny plots of land who depend on rain fed agriculture [9]. According to Omonona [10], poverty is pervasive although the country is rich in human and material resources that should translate into better living standard. Despite its plentiful resources and oil wealth, poverty is widespread in Nigeria [11]. The situation is said to have worsened since the late 1960s, to the extent that the country is now considered one of the 20 poorest countries in the world. Over 70% of the population is classified as poor, with 35% living in absolute poverty. Poverty is especially severe in the rural areas, where social services and infrastructure are limited or non-existent. Majority of those who live in rural areas are poor and depend on the agriculture for food and income.

The concern on the threat posed by poverty has led the Nigerian government over the years to devote considerable attention to alleviating its scourge through various policy projects and programmes which seems not to have stem the ugly situation till date. In view of these, the question about the poverty status of rural dwellers especially the small scale farmers remained unanswered. It is on this premise that this study was carried out to answer these questions.

a) What are the socio-economic characteristics of these small scale farmers?

b) Are the small-scale farmers really poor?

c) What are the factors influencing poverty status of the small scale farmers? and

d) What options are available to small scale farmers in reducing their poverty levels?

Thus, the main objective of this study is to evaluate the poverty status of small scale farmers in Bayelsa State, Nigeria. The specific objectives are to:

a) Describe the socio-economic characteristics of small scale farmers.

b) Compare the poverty status of crop and livestock farmers in the study area;

c) Determine the factors influencing poverty status of the farmers; and

d) Make policy suggestion towards poverty alleviation.

Methodology

Study Area

The study was conducted in Bayelsa State, Nigeria. It is located between latitude 5° 001 to 10° 301 N and longitude 4° 551 to 6° 001 E and covers an estimated land area of 1,810km2 with a population of about 856,729 thousand [12]. It shares local boundary with Delta State, Anambra State and Rivers State with the Bight of Benin at the Southern Flank. There are eight (8) Local Government Areas (LGAs) in the state with Ijaw as their major language. Mean annual rainfall of the area is 2,200mm for upland or dry regions where water bodies are few and 3,500mm for wetland or lowland region which comprises of land areas being surrounded by water bodies. Temperature range is between 23 – 31°C and vegetations found in the area include the saline water swamp, mangrove swamp and the rain forest. Major seasons are the dry (November – February) and wet seasons (October – March). Also, the seasonal condition of the area presents a healthy environment for farming which is the main source of income and livelihood of the state’s population and agriculture accounts for about 72% of the labor force.

Sampling Procedure and Sample Size

The sampling involved a multistage random sampling technique. Firstly, six (6) local government areas were randomly selected using the proportionate sampling method at 75% precision level from the purposively selected three (3) agricultural zones according to Agricultural Development Programme (ADP) structure. In the second stage, ten (10) villages were also randomly selected from the six (6) LGAs each making a total of sixty (60) villages. The third stage involved a simple random selection of five (5) crop and five (5) livestock farmers each from the villages using the list provided by ADP from each of the villages. A total of six hundred (600) respondent farmers were used.

Data Collection

Both primary and secondary data were used for the study. The collection of primary data was achieved using a set of structure questionnaire that was administered by the researcher and trained enumerators complemented with oral interview, information that was collected covered the areas of socio–economic characteristics, farming operations, and income and expenditure patterns. Secondary data were sourced from relevant material both published and unpublished.

Analytical Technique

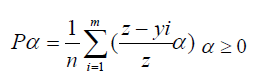
Three analytical tools namely; descriptive statistics; Foster, Greer and Thorbecke (FGT) model of poverty decomposition [1]; Logistic regression were used for the study. Descriptive statistics such as frequency, percentages, mean were used to profile the socio-economic characteristics of the farming households and also to present the results of the findings. The FGT measure was used to assess the incidence, depth and severity of poverty of the farming households. The approach makes use of the aggregate values of the poverty indices – poverty headcount, poverty gap, and squared poverty gap. The use of the FGT measures required the definition of poverty line and this was calculated on the basis of aggregated data on household income. The FGT measure as used by Baiyegunhi and Fraser [13] is expressed as:

Lupinepublishers-openaccess-Agriculture

Where:

z = Poverty line

m = Number of households below poverty line

n = number of households in the reference population

yi = Per adult equivalent income of ith household

α = Poverty aversion parameter

z-yi = Poverty gap of the ith household

z – yi = Poverty gap ratio

The headcount index was obtained by setting a = 0, the yield poverty gap index when a = 1, and squared poverty gap index when a = 2. The poverty line is a predetermined and well defined standard of income and value of consumption. In this study, the poverty line was based on the income of the households. A relative poverty line was used in which a household was defined as poor relative to others since they are all farmers. Two third of the mean per capita income (MPCI) was used as a moderate poverty line while one third was taken as the line for extreme poverty. Thus, the farming households were grouped into three categories based on their levels of poverty: the extremely poor (those whose income was less than one-third of MPCI), the moderately poor (those whose income lies between onethird and two-third of the poverty line) and the non-poor (those whose income was above two-third of the poverty line).

Adult equivalents were generated following Nathan and Lawrence [14], thus:

AE =1+ 0.7(N1 −1) + 0.5N2

Where

AE = Adult equipment

N1 = Number of adults aged 15 years and above

N2 = Number of children aged less than 15 years.

Logit Regression Model

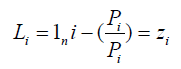
A binary logistic regression model was used to analyze the determinants of poverty. Thus, poverty is the dependent variable and is determined by independent variables such as socioeconomic characteristics of households and access to services. The dependent variable is binary (1 if the household is poor and 0 if the household is non-poor). The logit model is based on the cumulative logistic distribution function expressed as:

Lupinepublishers-openaccess-Agriculture

Where:

Li = log of the odd ratio, which is not only linear in Xi but also linear in the parameters,

Pi = is the probability of being poor and ranges from 0 to 1.

Zi = the function of the explanatory variables (x) which is expressed explicitly as:

Lupinepublishers-openaccess-Agriculture

Where:

Bo = Intercept, Bi – B9 = coefficient of the independent variables, xi = is the vector of relevant independent variables and U = is the stochastic error term, z = the dependent variable defined as the mean annual per capita expenditure. It was measured in binary terms such that 0 = poor, that is if the mean per capita household expenditure is below the poverty line and l = not poor, that is if the mean per capita household expenditure is above the poverty line and:

X1 = Age (number)

X2 = Farm size (number of herds/hectares)

X3 = Marital Status (1 = Married, 0 = otherwise)

X4 = Household size (number)

X5 = Education Level (number of years)

X6 = Major Occupation (1 = farming, 0 = otherwise)

X7 = Farming Experience (years)

X8 = Household income (Naira)

X9 = Household Expenditure (Naira)

X10 = Extension contact (1 = yes, 0 = otherwise)

X11 = Cooperative Membership (1 = yes, 0 = otherwise)

Results and Discussion

Socio-Economic Characteristics of Respondents

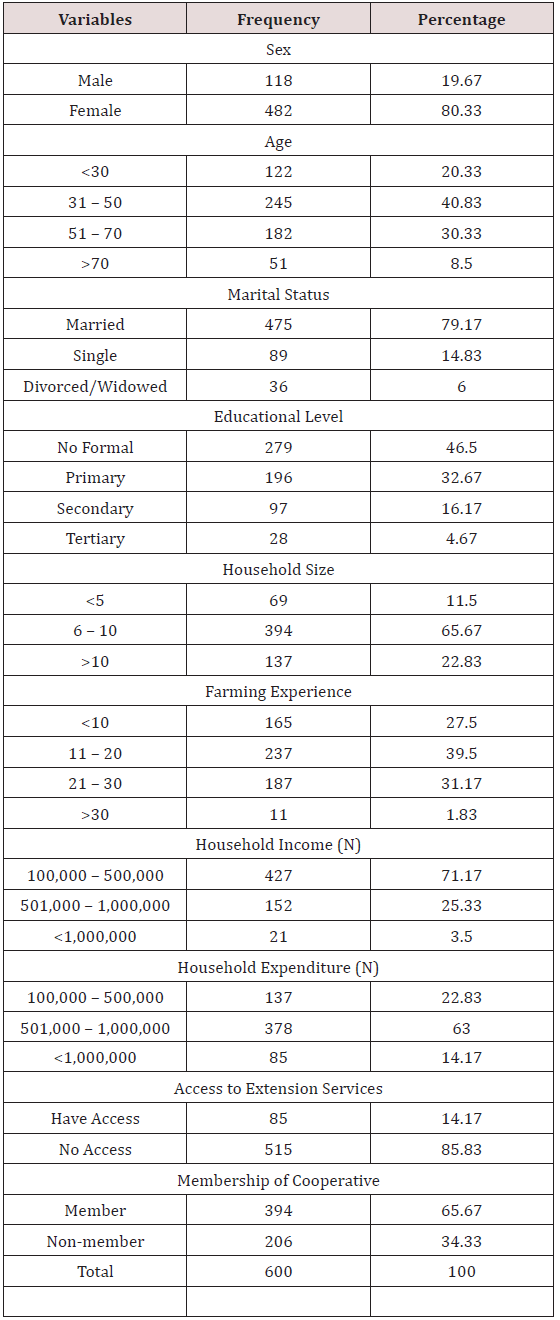
Table 1 shows the socio-economic characteristics of the respondents. The majority, 80.3% of the respondents were female while 19.7% were male. This suggest that majority of small scale farmers in the study area are female. About 61% of the respondent were age <30 to 50years with the mean age of 41 years. These results suggest that majority of the farmers were in their active productive age. Moreover, 79.17% of the respondent farmers were married, only 14.83% were single and 6.00% of the farmers were either divorced or widowed. About 46.50% of the farmer does not have formal education, while 32.67% had primary education. Only 16.17% and 4.67% of the respondents had secondary and tertiary education respectively. These result confirm the low level of education in the study area as the state was rated as an educationally disadvantage state in Nigeria. Majority of the respondent farmers 65.67% had a household size ranging between 6 – 10 persons, while 11.50% had less than 5 persons and 22.83% of the respondent had above 10 persons. The result suggests a large household size among the respondent farmers (Table 1).

Table 1: Socio-Economic Profile of Respondents.

Lupinepublishers-openaccess-Agriculture

On the basis of farming experience, about 27.50% of the respondents had less than 10 years farming experience, while 39.50% had farming experience ranging between 11 – 20 years. Only 31.17% had farming experience ranging between 21 – 30 years and 1.83% had farming experience of more than 30 years. Based on household income, about 71.17% of the respondents had annual income ranging between N100,000 – N500,000, while 25.33% had annual income ranging between N501,000 - N1,000,000, only 3.50% of the respondents had annual income above N1,000,000. Majority of the farmers 63.00% had household expenditure ranging between N501,000 – 1,000,000, while 22.83% had expenditure ranging between N100,000 – N500,000 and 14.17% of the farmers had household expenditure above N100,000. These result suggest that majority of the respondent farmers spend more than they earn thereby pushing them more into poverty. Majority of the farmers 85.83% have no access to extension services while only 14.17% of the farmers have access to extension services. Moreso, 65.67% of the respondent farmers are members of cooperative societies while 34.33% do not belong to cooperative society (Table 2).

Table 2: Poverty Incidence, Depth and Severity of Respondents.

Lupinepublishers-openaccess-Agriculture

Analysis of Poverty Status of the Farmers

Table 2 shows the summary of the poverty incidence (P0), depth (P1) and severity (P2) among the respondents. The MPCI of the crop farmers was 21,017.20. This gives a moderate poverty line (2/3 MPCI) of 14,011.47 and a core poverty line (1/2 MPCI) of 7005.73. The MPCI of the livestock farmers was 17,213.10. This gives a moderate poverty line (2/3 MPCI) of 11,475.40 and a core poverty line (1/2 MPCI) of 5737.70. Hence, crop farmers whose monthly per capita income falls between 14,011.47 and 7005.73 were regarded as moderately poor while those who fall below 7005.73 were regarded as core poor and those above 14,011.47 were regarded as non-poor. For the livestock farmers, households whose monthly per capita income fall between 11,475.40 and 5737.70 were regarded as moderately poor while those below 5737.70 were regarded as core poor and those who are above 11,475.40 were regarded as non-poor. The poverty incidence (Table 2) shows that among the crop farmers, 27% of the populations were poor while among the livestock farmers, 38% of the populations were poor. The poverty depth of the crop farmers and livestock farmers was 0.072 and 0.098 respectively. This implies that they would need to be increased by 7.2% and 9.8% respectively for them to come out of poverty and become non-poor. The poverty severity measures the distance of each poor person to another. Among the crop farmers, the distance was 0.038 while in the livestock farmers the distance was 0.052. Overall, a comparison of the poverty status of the crop and livestock farmers indicated that the poverty status is relatively close even though it is higher among livestock farmers. The result may not be unconnected to excessive expenditure incurred by head of household as a result of increase household size and low-income occasion by subsistence nature of farming.

Factors Influencing Poverty Status of the Respondents

Table 3 shows the factors influencing poverty status of the farmers. The regression classification table revealed that the binary logistic model predicted 97% of the regression correctly. The model fits the data at (P<0.001) as indicated by the chi-square goodness of fit statistic (73.28). The goodness of fit of the model proved that the variables tested in this study were valid to explain the determinants of poverty in the study area. Besides, the Nagelkerte R2 value (0.867) shows that about 87% of the outcome (Likelihood of being poor) can be explained by the selected independent variables captured in the model (Table 3).

Table 2: Logistic Regression Result on Factors Influencing Poverty Status of the Respondents.

Lupinepublishers-openaccess-Agriculture

Percentage Prediction = 97.57%

Goodness of fit chi-square (df=11) = 73.28 (P<0.001) Nagelkerte R2 = 0.867

***, ** and * = figures significant at 1%, 5% and 10% levels respectively.

Source: Computation from field survey data, 2017.

The results of the regression model indicated that eight (8) of the eleven (11) explanatory variables influenced the poverty status of the farmers. The variables were age, educational level, and household size, farming experience, farm/herd size, household income, household expenditure and membership of cooperative. The coefficient of age of the farmer was significant and negatively related to the probability of a household becoming poor. This implies that the age of the farmers is a causative factor of poverty. As age of the farmers increase, the likelihood of being non poor is reduced. This conforms to a priori expectations and work by Ayalneh [15], Obiesesan [16], who opined that older households had greater likelihood of being non-poor. This may be attributed to increased experience and exposure to farming operations and management practices as their age increases.

A positive and significant relationship was found between educational qualification and the likelihood of being non-poor, hence, the higher the educational level, the lower the tendency of been poor. The result is in conformity to a priori expectations and work by Ogwunike [16] who found that a positive significant relationship existed between educational level and the probability of being non-poor. The coefficient of household size was negative and was significant at 1% level. This implies that, the higher the household size, the more likely to become poor. Ceteris paribus. This could be as a result of the fact that the members of such households would have to depend on the limited resources that is available to the household thereby reducing the per capita income of the household. This is in agreement to a priori expectations and work by Khan [5] and Ogwumike [16].

A positive and significant relationship was found between farming experience and the likelihood of being non poor at 5% level. This implies that the higher the years of farming, the higher the probability of being non-poor. This is in conformity to a priori expectations and work by Omonona [10] who stated that exposures and experiences gathered over the years help rural poor people to fight poverty. The author further opined that experience in farming help to reduce losses thereby encouraging proper handling and management of relatively scarce resources. There was a positive and significant relationship between farm/herd size and the likelihood of being non-poor. This implies that as the farm/herd size of the farmer increases, the probability of the household being nonpoor is increased. This finding conforms to a priori expectations and work by Eneyew [17] and Alemu [18] who found that a unit increase in land holding increased the probability of being nonpoor. The coefficient of household income was significant at 1% level and positively related. This implies that as the household income increase, the probability of being non-poor increases. This is in agreement to a priori expectations and work by Alemu [18] who found a positive relationship between household income and the likelihood of being non-poor.

In conformity to a priori expectations, the coefficient of household expenditure was negative and significant at 5% level. This indicated that, the higher the household expenditure, the lower the likelihood of being non-poor. Ogwumike [19] stated that, excessive expenditure by household head is a pointer to poverty. The coefficient of membership of cooperative was positive and significant at 5% level. This implies that, if a household head is a member of cooperative, the likelihood of being non-poor increases. This will not be unconnected with the fact that members of cooperative in the rural settings help their cooperative members in time of needs and also provide incentive and loan facilities to those in need.

Conclusion

The research has shown that, the incidence, depth and severity of poverty were high among the farming households even though some of the farmers fall above the poverty line. The study has also shown that the rate of poverty is relatively higher among livestock farmers compared to crop farmers. Meanwhile, the study has revealed that several factors influences the poverty status of the farming households such as age, educational level, household size, farming experience, farm/herd size, household income, household expenditure and membership of cooperative [20].

Given these findings, therefore, it is recommended that:

a) Government and other relevant non-governmental organizations should provide incentives and infrastructures that will enhance productive and sustainable agricultural development in the rural areas.

b) The farming households need to diversify their productive activities through mixed farming and value addition to improve their non-farm income thereby reducing poverty.

c) Policy makers and the operators of rural economy should carefully understand those variables that influence the poverty status of the farming households and address them critically and vigorously.


Read More Lupine Publishers Agriculture Journal Article:

Wednesday, 27 January 2021

Lupine Publishers | Performance of West African Dwarf (Wad) Goats Fed Dietary Levels of Boiled Rubber Seed Meal (Hevea Brasiliensis)

   Lupine Publishers | Current Investigations in Agriculture and Current Research


Abstract

Effect of boiled rubber seed meal (BRSM) based diets on the performance of West African Dwarf (WAD) bucks was investigated. Four groups of WADS were randomly fed with the 4 experimental diets (A–D) formulated to contain 0, 10, 20 and 30% BRSM. The experiment lasted for 56 days. Average daily feed intake (g) were 417.90; 428.93; 322.00 and 288.10 for diets A, B, C, D, and the corresponding average daily weight gain was 31.69, 53.92, 46.62, and 34.64 respectively. Feed/gain ratio was 6.90 for goats fed diet C and 7.95 for those fed with diet B. Feed cost per Kg weight gain was N 115.29 for diet C and N 120.42 for diet B. The warm carcass and dressing % were insignificant among the 4 treatment groups, but goats fed diet C showed superiority. Legs, shoulder, sets and bone to lean ratio differed significantly between the treatment groups.

Keywords: Conventional; Non-Conventional; Rubber Seed; West African Dwarf Goats

Introduction

The economic depression of nations has greatly reduced meat availability, and the inadequacy of meat supply has been aggravated by a combination of environment, feed and management factors Wikipedia, [1], Udo [2]. In recent years many categories of Nigerian farmers tend to invest in ruminant livestock farming Hoffmann [3] yet cost of conventional feeds still posed big challenge Hassan [4]. Feed as reported by Akpodiete and Inoni [5], accounts for 60 – 70% of total cost of livestock production and that it’s inadequacy in quality and quantity could lead to a situation of low nutritional status, poor weight gain, poor reproductive ability, poor production, poor health condition and poor conversion ratio Fajemisin [6]. It therefore, becomes important to supply adequate feed in quantity and quality for optimal performance by livestock. Goats’ farming offers ample opportunity for meat inclement and availability. They are easy to keep, require smaller capital investment, play significant role in socio-economic life of the people as they contribute about 35% Nigerian meat supply Oloche [7], and provides income to farmers Peacock [8]. West African dwarf goats are the prevalent and trypono-tolerant breed in the derived and guinea savannah zones Eroarome [9], Udo [10]. But it is worrisome that lack of government legislation for the multiplication of this hardy breed, nutritional constraint particularly during the dry season coupled with the extensive mode of production posed serious problem to their production in the tropic Ahamefule [11] and Ahamefule and Udo [12]. To address the nutritional need of goats, it is therefore, important to supplement their diet with concentrate. As a result of high cost conventional feedstuff and in attempt to reduce competition between man and livestock, nutritionists are in search for alternative non-conventional feedstuff that are cheap and readily available Ahamefule and Udo [12]. There are huge naturally occurring non-conventional feedstuffs that can profitably be used to stimulate small ruminant production Udo [2], Udo [10]. Prominent among them is rubber seed which has no feed value for human Udo [10]. The Humid tropics has large acreage of rubber plantation, and in Nigeria it is cultivated on estimated 185,000 hectares with seed collection of about 10,175 tonnes/year Udo [2], with crude protein content range of 21 – 28%, Crude fibre range of 4.47 – 8% (Udo [2], Udo [10], Njwe [13] and energy range of 2.32 – 2.58 MJ/Kg Udo [2]. Several works on rubber seed have been reported for some breeds animal: pigs Babatunde [14], poultry Nouke and Endeley, 2001, sheep Njwe [13]; but there is paucity of information on the feeding of rubber seed to West African Dwarf Goats. This work however, was designed to evaluate the performance of West African dwarf goat fed dietary levels of rubber seed meal based diet.

Materials and Methods

Experimental Site

The study was conducted at the Goat unit of the Teaching and Research farm, Akwa Ibom State University, Obio Akpa campus, Akwa Ibom State, Nigeria. Obio Akpa is located between longitudes 7° 27’ E and 7° 58’ E. It is located within 3500 – 5000mm annual rainfall with average monthly temperature of 25 °C

Animal Management

Sixteen (16) weaners West African Dwarf (WAD) bucks of 6-7 months old were procured from farmers in the University environment and used for the investigation. On the fifth day of arrival, these animals were all dewormed using albendazole thiabendazole. They were subsequently given acaricide birth using asuntol solution and after that quarantined for 21 days and fed forage and supplements of the test diet for acclimatization. They were vaccinated against Pestes des petite ruminant (PPR) using Rinder pest Tissue culture vaccine. The goats were randomly divided into four groups of four goats per treatment and housed individually in well ventilated cement floored pens equipped with feeders and drinkers.

Experimental Design/Procedures

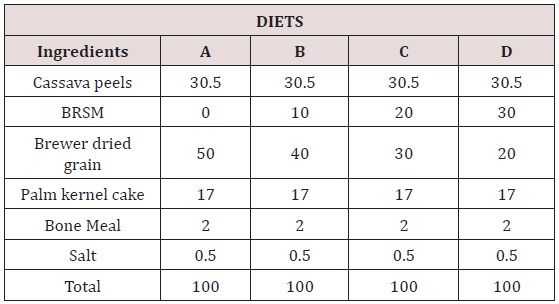
Four diets were formulated to contain 0 – 30% boiled rubber seed meal (BRSM) and designated as A, B, C and D. These diets were assigned randomly to the four animal groups in a completely randomised design. Each goat received 1kg of designated diet in addition to 2Kg of guinea grass (Panicum maximum). Daily feed intake was determined by subtracting daily feed refusal from the 1kg given the previous day. These were used to calculate the average daily feed intake, average daily weight gain feed conversion ratio, and feed economics of production for each treatment group.

Experimental Diets

Four (4) experimental diets (A-D) were formulated to contain various inclusion levels (0-30%) of boiled rubber seed meal (BRSM) with other conventional ingredients as shown in (Table 1).

Processing of Rubber Seed

Twenty (20) kilogrammes of raw rubber seeds were introduced into cooking pot (in batches) whose water has attained boiling temperature (100 °C) and allowed to boil for 30 minutes after which the seeds were decanted. The boiled seeds were sun-dried for seven (7) days, then dehulled and nuts milled, pressed using garri processing machine to remove oil and the products used to formulate boiled rubber seed meal-based diet (BRSM).

Slaughter Technique

At the end of the feeding trail, three goats per treatment group were starved for 24 hours prior to slaughter. Each goat was weighed before slaughter, after bleeding and after dressing. Dressing percentages were calculated as the weight of dressed warm carcass in relation to the live weight before slaughter. The dressed warm carcass is defined as the weight of the goat after the removal of the head, skin, content of the thoracic, limbs, distal to the carpal and tarsal joints and pelvic cavities (including the diaphragm and kidney). The lungs, head, heart, liver, limb (four feet) and skin were weighed also.

Carcass Evaluation

Three animals per treatment group were slaughtered for carcass evaluation. Jointing of carcass (meat cut) was done following the method adopted by Ahamefule [11]. Each dressed warm carcass was divided down the spinal cord by means of meat saws into two (2) equal half and weighed individually. The left half was subsequently divided into various cuts consisting of thigh, shoulder, loin, sets and ends. Each of the cuts was weighed and the weight doubled in each case before expressing it as percentage of the dressed carcass. The leg (thigh) was severed at the attachment of the femur to the acetabulium; the loin consists of the lumber region plus a pair of ribs, the ends (spare ribs plus belly) consist of six (6) abdominal ribs, the shoulder consist of the scapular, and the sets made up of the breast and the neck. The loin cuts were then dissected into muscles and bone with ligament to obtain the meat to bone ratio.

tatistical Analysis

The experiment was laid out as completely Randomized design. All data were analysed in a one –way analysis of variance (ANOVA) using SPSS [15] package. Duncan’s Multiple Range Test Duncan [16] was used to separate significant means.

Chemical Analysis

All feed samples were analysed for proximate composition using AOAC (2007).

Results and Discussion

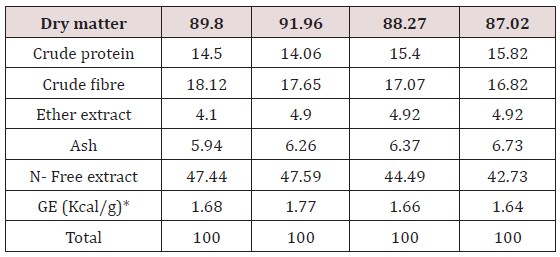
The composition and proximate assay of the experimental diets formulated to contain 0-30% boiled rubber seed meal (BRSM) are presented in (Table 1). The dry matter (DM) content of the diets, save for ration B (10% BRS), were fairly comparable (Table 2). The crude protein (CP) ranged from 14.06 – 15.82% and increased as inclusion levels of BRSM increased from B-D. Crude fibre (%) (CF) followed a reverse trend of the CP values. The ether extract (EE) composition (%) increased from diets A-D and stabilized in C and D. the ash contents (%) of the diets followed similar pattern as the EE, rising and stabilizing as the case was. Nitrogen free extract (NFE) values (%) rose from A-B and subsequently decline in diets C and D. The energy values (Kcal/g) followed similar trend as NFE. CP and energy content of the four diets were all above what is required by WAD goats as reported by Ahamefule [11], Akinsonyinu [17].

Table 1: Proximate composition of experimental diets containing various levels of boiled rubber (Hevea brasiliensis) seed meal.

Lupinepublishers-openaccess-Agriculture

Table 2: Chemical assay of experimental diets containing various levels of boiled rubber (Hevea brasiliensis) seed meal (%DM).

Lupinepublishers-openaccess-Agriculture

*Calculated, BRSM= Boiled rubber seed meal.

Response of West African Dwarf (WAD) Goats

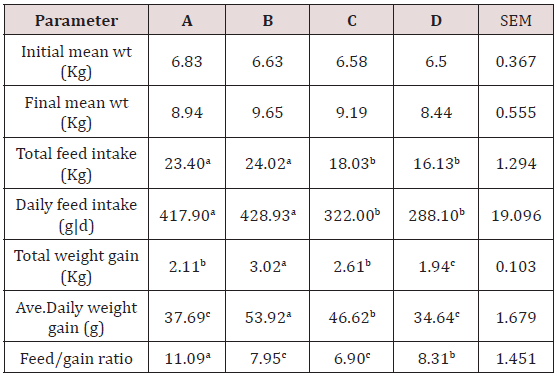
The performance of WAD goats fed various inclusion level of boiled rubber seed meal (BRSM) is shown in Table 3. Goats fed 10% BRSM consumed significantly (P<0.05) more feed (428.93g/d) than goats fed diets containing 0% (417.90 g/d), 20% (322.00g/d) and 30% (288.04g/d) BRSM. Goats fed diet A (Control) had similar intake (P>0.05) with goats fed 10% BRSM diet; their values were significantly different (P<0.05) with the feed intake of goats fed diets C and D. This may be due to the increasing levels of rubber seed meal from B-D which Gohl [18] reported that rubber seed is not quite palatable and appetizing to ruminant. However, the values obtained in this report is in consonance with previous reports by Spring [19] that feed intake and growth decreased as rubber seed meal (RSM) incorporation levels increased in poultry rations. Njwe [13] also reported that rubber seed is not quite appetizing to sheep and that RSM should not exceed 20% level incorporation and not more than 10% for poultry Babatunde [19] while Devendra [20] considered 20% as optimal inclusion level for pigs. The trend of intake in this study agrees with the report by Rajan [21] that weight gain was not affected when fed diet containing 20% BRSM, but subsequently, a linear decrease in feed intake and daily weight gain occurred as the incorporation of BRSM exceeds 20%. The feed gain ratio for goats fed 20% BRSM was least (6.90) and apparently best and was in line with the reports Njwe [13], Rajan [21] that small ruminants can utilize up to 20% rubber seed without adverse effect on performance. The average daily weight gain range of 34.64 – 53.92g obtained in this study compared favourably with the range reported for WAD goats within the first 12 months of life Nuru [22], Anya [23].

Table 3: Performance of WAD Goats Fed Experimental Diets Containing Various Levels of Boiled Rubber (Hevea brasiliensis) Seed Meal.

Lupinepublishers-openaccess-Agriculture

a,b,cMeans on the same row with superscripts differ significantly (P<0.05).

Feed Economy

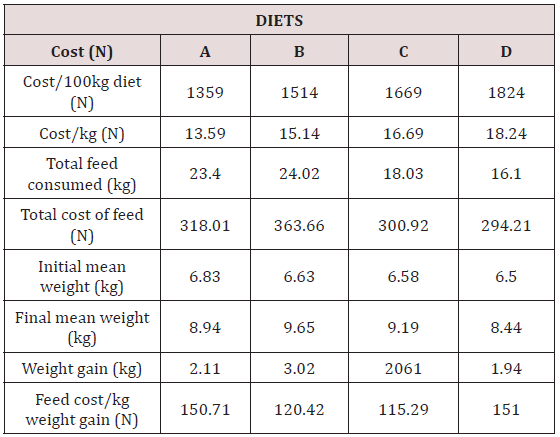
Table 4: Feed economies of WAD goats fed various inclusion levels of boiled rubber seed meal-based diets.

Lupinepublishers-openaccess-Agriculture

The economy of feeding WAD goats with various inclusion levels of boiled rubber seed meal (BRSM) is presented in Table 4. Daily feed consumed by animals in treatment A and B were similar, but the two groups differed significantly (P<0.05) from animals fed diets C and D that were also similar in their feed intake. Goats fed diet B (10% BRSM) supported highest daily weight gain followed by 20% and 30% respectively. The daily weight gain range (34.64 – 53.92g/d) reported in this study is lower than the range (35 – 65 g/d) reported by Nuru [22] for WAD goats. The feed cost per kilogram weight gain was N150.71 for goats fed diets A of 0% BRSM. The corresponding values for animals fed diets B, C and D were N120.42, N115.29 and N151.65 respectively. The result obtained in this study followed the findings trend of similar investigations by Ahamefule [11] and Anya [23]. They also reported superior feed cost per kilogramme weight gain for WAD goats fed diets containing 20% Pigeon pea and African yam bean respectively. For best yield returns on investment, incorporation of 20% BRSM in WAD goat’s diet is advisable.

Carcass Characteristics

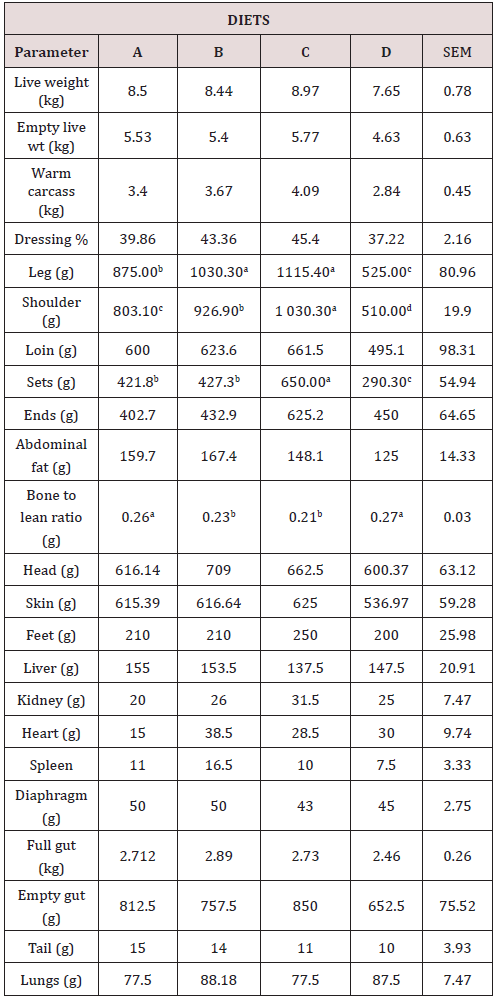
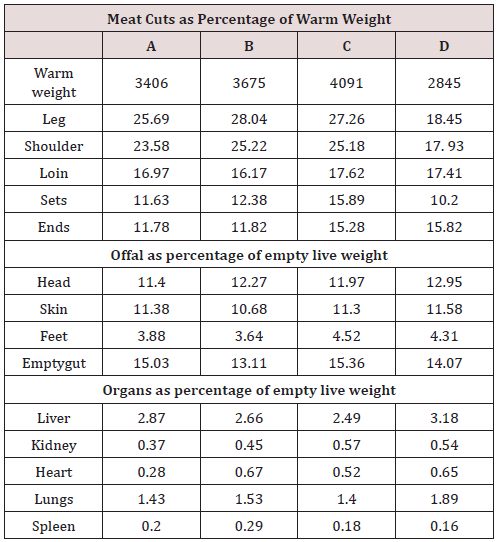
Table 5 shows the carcass yield of WAD goats fed graded levels of diets. The superior warm carcass value (4.09Kg) obtained for goats fed 20% BRSM was not significantly (P<0.05) different from the values of 3.40Kg, 3.67Kg and 2.84Kg recorded for goats fed 0%, 10% and 30% BRSM respectively. More so, there was no significant different (P<0.05) in their dressing percent, though goats fed diet C (20% BRSM) has a superior value of 45.40. The range of dressing percent (DP) obtained in this study (37.22 – 45.40) was comparable with the values (33.05 – 58.07) reported by Udo and Nuru (1985) 45 – 52% for WAD goats in different feeding trials. In Table 6 significant differences (P<0.005) only occur among treatment groups for leg, shoulder, sets and bone to lean ratio. The leg meat cut (g) was best for goats fed diet C (1115.40) and was not significantly different (P<0.05) from goats fed diet B (1030.30), but however differed (P<0.05) significantly from values for goats fed diets A (875.00) and D (525.00). In the shoulder cut (g), goats fed diet C had best cut (1030.30) which also differed (P<0.05) significantly from corresponding values obtained for goats fed diets A (803.10), B (926.90) and D (510.00) Goats fed 20% BRSM (C) diet had sets value (650.00g) which was superior (P<0.05) to other treatment groups. In all parameters investigated goats fed BRSM yielded superior meat cuts relative to other treatment groups indicating that it was best utilized of all the diets. The relatively high but comparable bone to lean ratio obtained for goats fed 0% and 30% BRSM diets in this study is an indication of high feed conversion efficiency by goats in group C (20% BRSM). This is also confirmed by the superior dressing percent (45.40%) and lowest (6.90) feed conversion ratio of goats fed 20% BRSM diet. The mean organ weight for the different group of goats fed the BRSM diets in Table 4-6 shows that all the organs (Liver, Kidney, Heart, Lungs and Spleens) weights were similar (P<0.05); they were not affected by the dietary treatments. Proving that all the inclusion levels of BRSM were safe as dietary concentrate for WAD goats but 20% BRSM diet gave outstanding performance in feed gain ratio, daily weight gain, dressing percent, meat cuts (leg, Shoulder, loin, sets, ends) and bone to lean ratio of WAD goats. Therefore for goat’s production/ fattening programmes, 20% inclusion level of boiled rubber seed meal is recommended as it also produced the cheapest cost per. kilogramme weight gain. This study has shown that if WAD goats are given right nutrition, sixty days could be used to fatten them to market weight, therefore making it possible for a farmer to carry out fattening programmes up to 6 times in a year. Thus generating good income for the farmer.

Table 5: Carcass yield of West Africa dwarf goats fed various levels of boiled rubber (Hevea brasiliensis) seed meal-based diets.

Lupinepublishers-openaccess-Agriculture

abcdMeans in the same row with different superscripts differ significantly (P<0.05).

Table 6: Average weight of meat cuts, organs and offal weights expressed as percentages of warm carcass or empty live weight.

Lupinepublishers-openaccess-Agriculture

Conclusion

This study revealed that boiled rubber seed meal generally enhanced performance at different level (10-30% BRSM) with all the inclusion levels being safe as dietary supplement for WAD goats. However, 20% BRSM inclusion level gave the best performance, and is therefore recommended for goat’s production/fattening programme as it also produced the cheapest cost per kilogramme weight gain.

Read More Lupine Publishers Agriculture Journal Article:
Monday, 25 January 2021

Lupine Publishers | Study on On-farm Dairy Cattle husbandry Practices in Walmera District of Oromia Regional State

    Lupine Publishers | Current Investigations in Agriculture and Current Research


Abstract

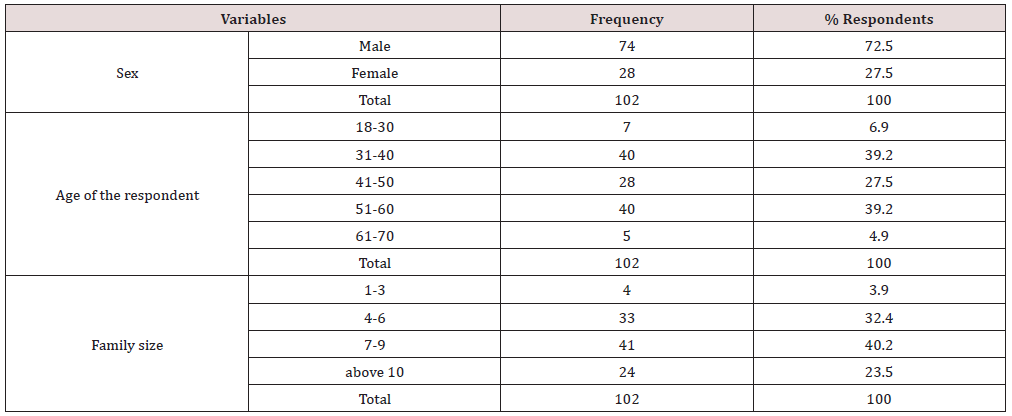
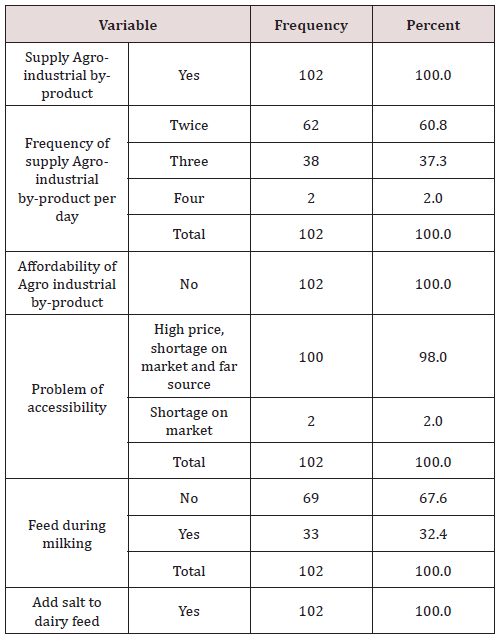
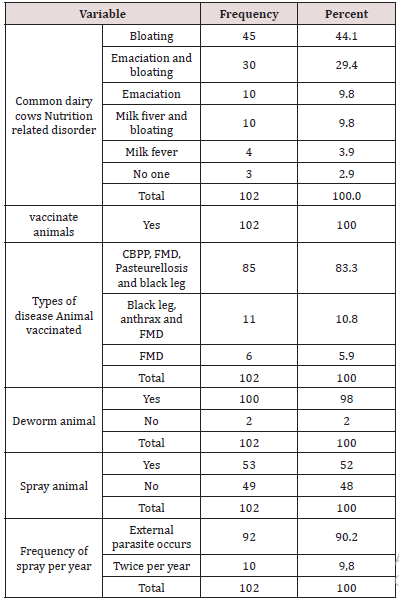
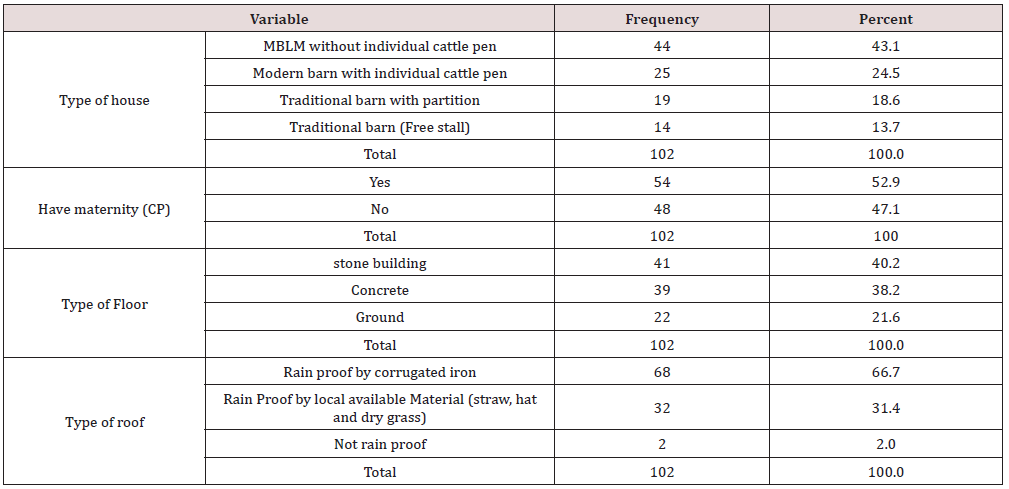
This study was carried out with the objective of studying on-fam dairy cattle husbandry practices in the Walmera district of Oromia regional state. The dairy cattle husbandry practices were based on field observation, questionnaire survey, focus group discussion and key informant interview. A total of 102 dairy producers were selected by using stratified random sampling technique from purposively eleven target kebeles. The survey result indicated that majorities 72.5% of household heads under investigation were male and the rest 27.5% were females. Majority of the respondents 40.2% had the family size of 7-9 members and about 23.5% had family size more than 10. Literacy wise, nearly half of the respondents (46.1%) were attended elementary education (1-8 grade), whereas 31.4% illiterate and unable to read and write. The breeding method preferred and perceived as more effective for conception by respondents were natural mating (65.7%), AI (20.6%) and others did not identify the difference between natural mating and AI (13.7%). Majority of respondents in the study area fed their dairy and other animals separately (80.4%) and 19.6% of them fed all animal together. Feeding of dairy cows based on the milk yield and separately practiced by 65.7% of the respondents, while the rest were not practiced. Grazing land was decreased from year to year mainly due to urbanization and land used for crop cultivation. However, 63.7% of the farmers did not have experience to establish improved forage but only 36.3% had grown improved forage. Even if, there was no accessibility of agro-industrial by-products because of high price, shortage of supply and far distance from the source agro-industrial center, 98% of respondents were supplementing their dairy animals with agro-industrial by-products and only 2% of respondent had reported unavailability of agro-industrial by-products in the market. Bloating (44.1%), emaciation and bloating (29.4%) and milk fever and bloating (9.8%) were among the most nutritional related diseases hampering dairy production in the study area. Majority (43.2%) of the respondents were used modern barn type constructed from local materials without cattle pen. It could be concluded from the study that in the study area on-farm dairy cattle husbandry practiced by dairy producers are encouraging for future dairy development as a whole with minor improvements.

Keywords: Dairy cattle; Husbandry practice; On-farm; Walmera district

Introduction

Ethiopia, with 59.5 million heads of genetically diverse cattle, has the largest population in Africa. Cattle production plays an important role in the economies and livelihoods of farmers and pastoralists through contributing products and by-products in the form of meat, milk, honey, eggs, cheese, and butter supply etc. that are essential sources of animal protein that contribute to the improvement of the nutritional status of the people. Cattle produce a total of 3.1 billion liters of milk annually [1]. Livestock are, therefore, closely linked with the economic, social and cultural lives of millions of resource-poor farmers for whom animal ownership ensures varying degrees of sustainable farming and economic stability. In spite of the existing enormous livestock resource, the contribution of the sub sector to the agricultural production, foreign currency earnings and total GDP is not up to expectations. The potentials for increased livestock production and the productivity is proportionally lowered by various poor livestock management problems, prevalence of major endemic diseases, poor feeding and high stocking rate on grazing lands, lack of support services such as extension services, veterinary services, insufficient data to plan improved services and inadequate information on how to improve animal breeding, marketing, and processing [2].

Assessment of the cattle husbandry practices is a pre-requisite to bring improvement in cattle productivity in the country in general and in the study area in particular. Understanding of dairy cattle husbandry practices also helps to design appropriate technologies, which are compatible with the existing system; and to plan development and research activities and bring improvements in productivity. So far, most of the studies were limited to overall livestock management systems and carried out mainly on station; and on-farm dairy cattle husbandry practices have not fully studied yet in the study area. Therefore, it is apparent that there is a need to study on-farm dairy cattle husbandry practices in the Walmera district as a system approach to design appropriate technologies compatible with the existing system and to plan development and research activities aimed at improving dairy cattle production. Moreover, this study was also furnished essential information and experience for future dairy development efforts. Therefore, this study was intended to amplify and characterize the overall on-farm dairy cattle husbandry practices in the study area.

Materials and Methods

Description of the Study Area

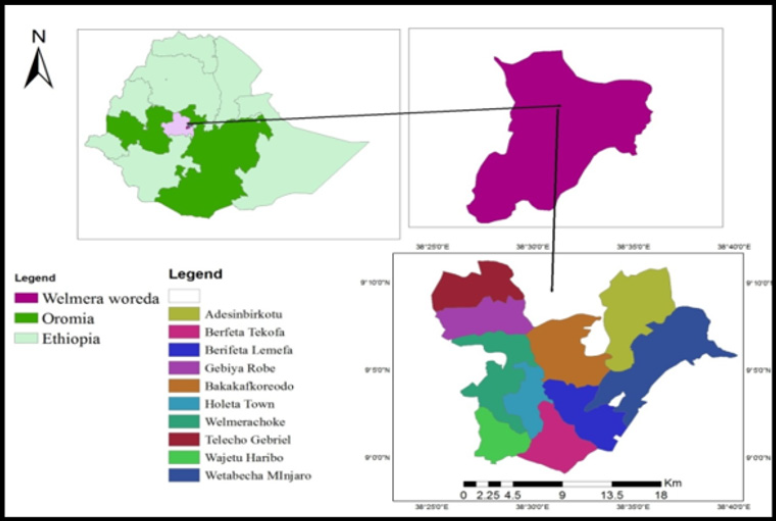
The study was carried out in Walmera District of West Shoa Zone of Oromia, which is located 30km to the west along the main road to Ambo. Geographically, the district is found 9o 0’ 0’’-9o 10’ 0’ N latitude and 38o 25’ 0’’- 38o 30’ 0’’ E longitudes. The study area has an altitude of 2400m. asl and receives an average annual rainfall of about 1000mm.The mean minimum and maximum temperatures are 6 and 22 oC, respectively [3]. The mean relative humidity is 59%. The study area obtains short rainy season (March to May), long rainy season (June to September) and dry season (October to February) [4]. The total human population of the district is 104,932 and cattle are the dominant livestock of the smallholder farmer in the area, although limited number of small ruminants and equines are kept [3]. Animals largely depend on natural grazing, which were supplemented with crop residues late in the dry season.

Research Design

Dairy cows raised under small scale production systems in the selected study sites constitute the study population. Cross-sectional type of study was conducted to collect data required for this study from 2016 to 2017 using questionnaire survey, observation and group discussion. The sampling units were defined as households keeping dairy cows.

Sampling Techniques and Sample size

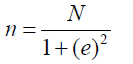
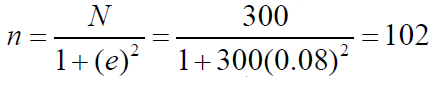
Prior to conducting field survey research, discussion was conducted with the head of Walmera district livestock and fishery resource development office and dairy expert to select sites and respondents. Eleven target kebeles: two from urban area and nine kebeles from rural area were selected purposively based on the number of dairy cows that farmers own, availability of model farmers and ease of access. Sample of respondents from each selected kebeles were selected randomly using stratified random sampling technique. The numbers of respondents in each kebele was selected using proportional to size sampling approach. The sample size to collect data for this research was determined by using [5] formula:

Lupinepublishers-openaccess-Agriculture

Where;

n = designates the sample size of the researcher uses;

N = designates total number of households in eleven kebeles.

N = designates total number of households in eleven kebeles.

1= designates the probability of the event occurring.

During the study period, about 300 households in the randomly selected kebeles own dairy cows of any breeds and size.

Thus, which is the determined sample size for the study.
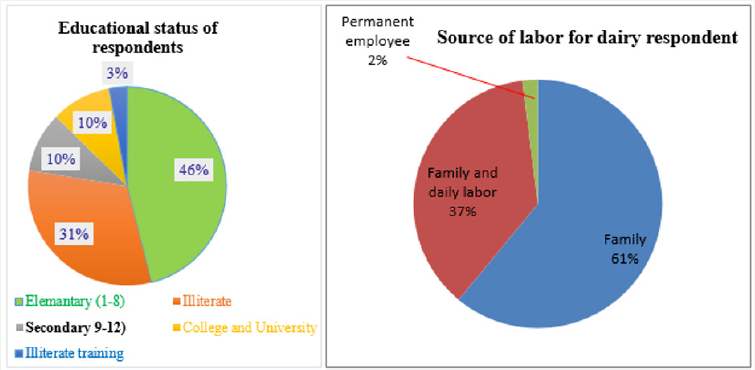
Methods of Data Collection and Analysis

Both primary and secondary data sources were used for this study. Primary data were collected from respondents by pre-tested semi-structured questionnaire, key informants’ interviews, focus group discussion and personal observation. Whereas, the secondary data were collected from various sources such as agricultural office, published and unpublished materials and CSA reports. The collected data from different sources were coded and recorded using Microsoft Excel spreadsheet 2007. Descriptive statistics such as frequency and percentage were used to analyze the quantitative data using SPPS version 23 software. Then the analyzed data were presented in the form of table and pie chart.

Results and Discussion

Demographic Characteristics of the Respondents

Sex, Age and Family Size: Majority of the respondents in the study area were male (72.5%) and the rest 27.5% were females (Table 1). The highest proportion of the respondents age were ranging from 31-40 years old which accounts about 39.2%, and the second highest proportion age was ranging from 41- 50 years old that accounts 27.5%. Thus, the study area had relatively better potential of economically active population who could participate in dairy cattle production. Majority of the respondents (40.2%) had the family size of 7-9 members and about 23.5% had family size more than 10 (Table 1). From this result, it clearly could elucidate that household with more family members tended to have more labor and to adopt dairy technology than household with less family members which in turn increased milk production and then milk market participation of the households.

Table 1: Respondent sex, age group and family size in study area.

Lupinepublishers-openaccess-Agriculture

Education Status and Source of Labor

Literacy wise, nearly half of the respondents (46.1%) were attended elementary education (1-8 grade), whereas 31.4% illiterate and unable to read and write. Out of the total respondents, only 9.8% respondents had secondary education (Figure1). Education affects the production and management of improved dairy cows; most importantly improved dairy cows breed needs high management and husbandry practices. Majority of the respondents who have crossbred dairy cows were educated from elementary up to university and have training on dairy production. Like the current result, according to [6], education levels of household heads have impacts on potential of milk production. Therefore, uneducated farmers are challenge for adoption of new technology in the development of dairy sector such as uses of AI for breeding and synchronization. The majority of the labor source of the respondents were own family labor (60.7%), 37.3% own family and daily labor, and only 2% were permanent employee (Figure 2). The reason may to use money paid for labor and proper farm management. This was an indication that dairy cattle management requires the attention of family members since they have high value. In line with the current result, [7] reported the same result.

Figure 1: Map of the study area.

Lupinepublishers-openaccess-Agriculture

Figure 2: Educational status and source of labor of respondents for dairy in study.

Lupinepublishers-openaccess-Agriculture

General Dairy Husbandry Practices

Table 2: Source of cattle for herd establishment in the study area.

Lupinepublishers-openaccess-Agriculture

Source of cattle for herd establishment: Majority of respondents reported that first herd establishment was made using the herd of local dairy cow inherited from family and purchased from market (Table 2). The percentage of local dairy cows inherited from family was high because of dairy cows have many roles in the socio-cultural values, like marriage and in solving disagreements. However, more of the respondents owned first crossbred dairy cattle that were purchased from market (55.9%), born on farm (27.5%) and from project (16.7%). Educated farmer in study area were rearing upgraded and improved dairy cows that give high milk yield. According to the Ethiopian Standard Authority, the scale of dairy production has been set to cluster dairy producers in Ethiopia into small scale dairy producer (1-10 dairy cows) (52.9%), medium scale dairy producer (11 to 20 dairy cows) (36.3%) and large-scale dairy producer (>20 dairy cows) (10.8%) were dairy producer respondent interviewed.

Dairy Cows Breed Preference

In the study area, almost all of the respondents (92.2%) preferred to keep Holstein Friesian and their cross due to their high milk production and fast growth. Whereas, 7.8% of the respondents prefer Jersey and their cross because of their higher butter yield and small body size (Table 3). In contrast, according to Sheki [13], there was no significance difference in the preference of dairy animals across Sinana by farmers. On the other hand, cattle keepers in Ethiopia prefer to select their herd based on marketable traits such as milk yield, growth rate and reproductive performances of the heifers/cows, steers/bulls. However, traits such as coat color and adaptability traditionally taken into account when selecting the dairy cattle [14] in western Oromia.

Table 3: Selection of exotic breed type and level exotic blood inheritances in the study area.

Lupinepublishers-openaccess-Agriculture

Majority of the respondent (77.5%) prefer 50-75% HF crossbred blood level (exotic blood inheritance), 20.6% prefer 50% HF crossbred and 2% prefer more than 75%HF. A similar finding was reported by Goshu [8] Chefa farm. The author concluded that Friesian blood levels in Ethiopian dairy cattle should stabilized at a maximum of 75%. In addition, in the study area for jersey breed all of the respondents prefer to keep 50-75% blood level of jersey. Almost all of the farmer in the study area have 50% exotic crossbred dairy cows (kilisi) (Dikala faranji) and above 50% (Hori Faranji). Additionally, in the study area, majority of the farmer practiced natural mating using bull with 75% exotic blood level for cross dairy cow (heifer blood level 50%) then the next generation of heifer F2 will be above 50% exotic blood inheritance. As the focus group discussion, KII, field observation and some document from Walmera district of Livestock Development and Fishery office indicated the bull used for natural mating were HF 75% and above exotic blood level. Most of the respondents managed high exotic blood level inheritance dairy cows (50%-75%) were more productive. Due to majority (68.6%) of the respondents were educated at list from short term training up to higher level and they were experienced on dairy production managing skill, knowledge, breeding methods, feeding practice, watering frequency, housing and health care practice for upgrades.

Breeding Methods, Types and Source of Bull

Table 4: Breeding method, types of bull and source of bull used for breeding in the study area.

Lupinepublishers-openaccess-Agriculture

Two types of breeding method, natural mating and AI were mainly practiced in the study area. Bulls used for two main types of natural mating either for uncontrolled mating (free mating) or controlled mating. In uncontrolled mating, the bull carries out heat detection and cows in heat were mated during each heat period. In controlled mating systems, the farmers carry out heat detection and timing of service, and each cow mated once or twice during each heat period. In addition, for AI the farmers carry out heat detection and timing of service and each cow inseminated once or twice during each heat period. Most of the farmers in the study area bred their dairy cows using natural mating and AI (50%), natural mating (46.1%) and only AI (3.9%) (Table 4). In contrast to this, Blen [9] reported dairy producers bred their animals using artificial insemination (89.0%) and few use natural method (bull) (11.0%) in Bishoftu. Besides, dairy producers were used crossbred bull (68.6%), pure exotic (21.5%), crossbred and local bull (4.9%), only AI service (3.9%) and local bull breed (2%) for breeding. The source of bulls was from neighbors (62.7%), uses own bull (29.4%), and uncontrolled mating (3.9%) (Table 5).

Table 5: Types of feeds and feeding practice of dairy cows in the study area.

Lupinepublishers-openaccess-Agriculture

MY=Milk Yield

Breeding Method Preference, Ai Service Provision and Accessibility in Study Area

On-farm breeding methods preferred by small scale dairy producers in the study area were depicted in (Figure 3). Even if, AI offers several advantages over the natural service, it was not found to be as effective and efficient as that of natural mating. AI is a means of genetic improvement, cost effectiveness, disease control, safety breeding, flexibility, and fertility management [7]. However, AI includes poor conception rate due to poor heat detection and inefficiency of AI technicians, dissemination of reproductive diseases and poor fertility rates, if AI centers are not equipped with appropriate inputs and are not well managed [8]. In the study area, due to similar reason most of the respondents prefer natural mating. All the respondents repeatedly told that most of the AI service provided by the government technician was not easily accessible for the farmers. In the current study, only 24.5% of the respondents had easy access to AI service and the rest did not have easy access to AI service; hence government should design strategies to address the interest of the farmers [10].

Figure 3: Breeding methods preference by dairy producers in the study area.

Lupinepublishers-openaccess-Agriculture

Animal Feeds and Feeding Practice

All of respondents feed their cows both roughage and agroindustrial by-products (concentrate) (Table 6). The respondents feed roughage like grazing pasture, hay and straw (78.4%) as basal diet for dairy cows. Similar finding was reported by Mustefa [11] in Sululta and Walmera districts. The major feed resources identified were native pasture, crop residues, agro- industrial by-products; few fodder crops (oats and vetch mixture). Majority of respondents in the study area fed their dairy and other animals separately (80.4%) and 19.6% of them fed all animal together. Feeding of dairy cows based on the milk yield and separately practiced by 65.7% of the respondents, while the rest were not feeding their dairy cows based on their milk yield.

Table 6: Grazing land status and establishment of improved animal forage in study area.

Lupinepublishers-openaccess-Agriculture

CCS= Cut and Carrying system.

Grazing Land and Establishment of Improved Animal Forage

In the present study, grazing land was decreased from year to year in the study areas. However, 63.7% of the farmers did not have experience to establish improved forage but only 36.3% had grown improved forage (Table 7). Majority of the respondents who had experience to grow improved forage, they utilize the forage through grazing the animal directly along with cut and carry system (21.6%) and cut and carrying system alone (14.7%).

Table 7: Cropping season, way of storing and the common crop residues in study area.

Lupinepublishers-openaccess-Agriculture

CCS= Cut and Carrying system.

Common Types of Crop Residues and Way of Storing

There was only one cropping season in study area and then the crop residues produced only once year. Almost all of the respondents (91.2%) in the study area properly store crop residues under shade while the few (8.8%) stored outside without shade (Table 8). The most common type of crop residues used for animal feed in the study area were barley, wheat and teff straw (63.7%), and barley, wheat and oat straws (36.3%). According to Mohammed [12] in Jimma Zone, crop residues were the second feed resources for livestock followed by wild browse/fodder trees and shrubs, crop thinning, weeds, and non-conventional feeds including household left over.

Table 8: Supply agro-industrial by product, feed during milking and add salt in the study area.

Lupinepublishers-openaccess-Agriculture

CCS= Cut and Carrying system.

Feeding Agro-Industrial by Products

As the survey result indicated in study area, all the respondents supply agro- industrial by-products for their animals (Table 9). Even if, there was no accessibility of agro-industrial by-products because of high price, shortage of supply and far distance from the source agro-industrial center, 98% of respondents were supplementing their dairy animals with agro-industrial by-products and only 2% of respondent had reported unavailability of agro-industrial byproducts in the market. In contrast to Mohammed [12] reported for Jimma zone, none of the household use agro-industrial by products as a potential concentrate for livestock feeds. About 88.15% of the respondent households reported high cost of agro-industrial byproducts as the main limiting factors not to use it as livestock feeds while lack of awareness on use of agro-industrial by-products as livestock feed was reported by 5.93% of the respondents. About 5.93% of the households reported that all agro-industrial byproducts were produced in a distant area. In study area, most of the respondents (60.8%) supply agro- industrial by product twice per day, 37.3% of the respondents supply three times per day, and 2% of them were supply four times day. In the study area, almost all of the respondents also provide table salt and bole (Amole) as minerals supplement. Similarly, Sheki [13] reported the findings in Sinana district of Bale zone.

Table 9: Respondent Health Care practice, Vaccinate, Deworm and Spray in the study area.

Lupinepublishers-openaccess-Agriculture

CCS= Cut and Carrying system.

Source of Water and Frequency of Watering Dairy Cows

In the study area, the sources of drinking water and frequency of watering were depicted in Figure 4. During the dry season 16.7% of farmers were get water from well. From the result, in the study area, it could understand that there was no problem of drinking water.

Health Care Practice

In the study area most, common nutritional related disease occur was bloating (44.1%) that the respondent facing on the farm, emaciation and bloating (29.4%), emaciation (9.8%), milk fiver and bloating (9.8%), milk fiver (3.9%) and 2.9% of the respondents reported that they were not face any nutrition related disease (Table 10). All of the respondents in the study area were vaccinate their animals for different types of disease. About 83.3% of the respondents vaccinate their animal for disease like CBPP, FMD, Pasteurellosis and black leg, and about 10.8% for black leg, anthrax and FMD and about 5.9% FMD. Almost all of the respondents dewarm their animal (98%) and the remaining 2% were not de-warm and those spray their animals were 48%. Most of the respondent spray their animal during prevalence of external parasites (90.2%) and 9.8% of the respondent practice spraying twice a year in the April and May. This health control practices in the study areas could contribute for effective dairy production. Market oriented smallholder dairy farms have access to veterinary services due to the income they get from the sale of milk that enable them to cover veterinary costs.

Figure 4: Source of water and frequency of watering dairy cows per day.

Lupinepublishers-openaccess-Agriculture

Table 10: Type of house and house comfort for dairy cows in Walmera district.

Lupinepublishers-openaccess-Agriculture

CCS= Cut and Carrying system.

Housing System

In the study area, all of the respondents house their animal in different types of houses. About 43.1% of the respondents were used modern barn type constructed from local material without individual cattle pen, 24.5% modern barn with individual cattle pen, 18.6% traditional barn with partition and 13.7% traditional barn (free stall). Similar results were reported by Mustefa [11] in Sululta and Walmera districts. Currently the types of roof the respondents in Walmera district had rain proof corrugated iron (66.7%), rain proof by local material covered (31.4%) and (2%) not rain proof barn. The floor types were built by stone (40.2%), concert (32.6%) and earthen floor (21.6%). This showed that there were many improvements in the dairy production system in the district [14].

Conclusion and Recommendation

It could be concluded from the study that in the study area on-farm dairy cattle husbandry practiced by dairy producers are encouraging for future dairy development as a whole with minor improvement on breeding strategies, identifying types of feeds along with types of dairy cows to be fed, and deep awareness and training on most nutritional related diseases. Therefore, appropriate intervention in nutritional related diseases and prevention activities, breed improvement strategies, deep and regular training on basic principle of animal feeds and feeding are highly recommended so as to improve sustain productivity of dairy cows and being benefited from the existing market and high demand of products.

Read More Lupine Publishers Agriculture Journal Article: