Lupine Publishers | Current Investigations in Agriculture and Current Research
Abstract
Crossability of various accessions of pea on the basis of pollen development and fruit set was studied along with genetic diversity by SSR markers. This study was taken up with 37 pea accessions to analyze genetic diversity with the help of 17 SSR primers. From these accessions, 6 random accessions were selected for the crossability studies on the basis of their fruit set. Among the selfing, the maximum pollen fertility was observed in Pant-5 (98.31%) and minimum in VRP-228 (94.11%). Pollen germination after 24 hours in VRP-372 was maximum amongst parents (22.52%) and the least was found in AP-3 (17.73%). In crosses, maximum pollen germination after 24 hours was found in VRP-61 X Pant-5 (17.69 %) and the minimum in VRP-21 X VRP-372 (13.93 %). The longest pollen tubes after 24 hours were observed amongst parents in Pant-5 (895.67μm) and the smallest in VRP-372 (785.89μm). In the crosses the maximum pollen tube growth was in VRP-372 X Pant-228 (1000.44μm) and minimum in VRP-61 X VRP-21 (723.21μm). The maximum fruit set among parents was 95.22% in Pant-5 and the least in VRP-228 (83.22%) and in crosses it was recorded in VRP-61 X VRP-228 (87.50%) and the least in VRP-21 X VRP-228 (76.47%). The data was subjected to correlation studies which showed that there was non- significant correlation between pollen germination, pollen tube growth and fruit set. A total of 17 SSR primers were selected to assess genetic diversity of 37 accessions of pea. Based on the PIC value, SSR AA446 and SSR AA473were found to be more informative. The data obtained from SSR primers were subjected to generate Euclidean distance and clustered dendrogram was made [1], which indicated that Morana-2 and PS are more distinct from each other and VRP-262, GS-10, Parthana, VRP-176 and VRP-243 were found to be very less distinct.
Keywords: Crossability; Pisum sativum; Pollen tube; Fruit set; SSR
Introduction
Pea (Pisum sativum L.) is a leguminous, annual herbaceous plant with a one-year life cycle. Pea is considered a cool season crop with planting taking place from winter to early summer depending on the location. Green pea is eaten cooked as a vegetable and is marketed fresh, canned or frozen. Pea is a self-pollinated, annual and diploid crop having 14 chromosomes (2n=14, n=7). Due to continual self-pollination in pea, undesirable linkage can hamper recombination and hence crop improvement. The yield of pea is low in India as compared to the world average yield owing to the narrow genetic base and limited variability used in the development of improved varieties. The current area and production of pea in India is 475.9 thousand ha and 4651.5 thousand MT, respectively [2]. For the success of hybridization, the interaction between pollen tube and various pre-fertilization processes affect cross ability. For an effective breeding programme, information concerning the extent and nature of genetic diversity within a crop species is essential. It is particularly useful for characterizing individual accession and cultivar and as a general guide in the selection of the parents for the hybridization. Molecular markers have enormous potential to explore genetic diversity by detecting polymorphisms to improve the efficiency and precision of conventional plant breeding. SSR markers are the most widely applied technique for genetic diversity analyses in crop species [3]. SSR markers are highly reliable because they are reproducible, co-dominant in inheritance and generally highly polymorphic. This paper reports pollen germination and pollen tube behavior in relation to cross ability between various accessions of pea and seed set and genetic diversity using SSR primers.
Materials and Methods
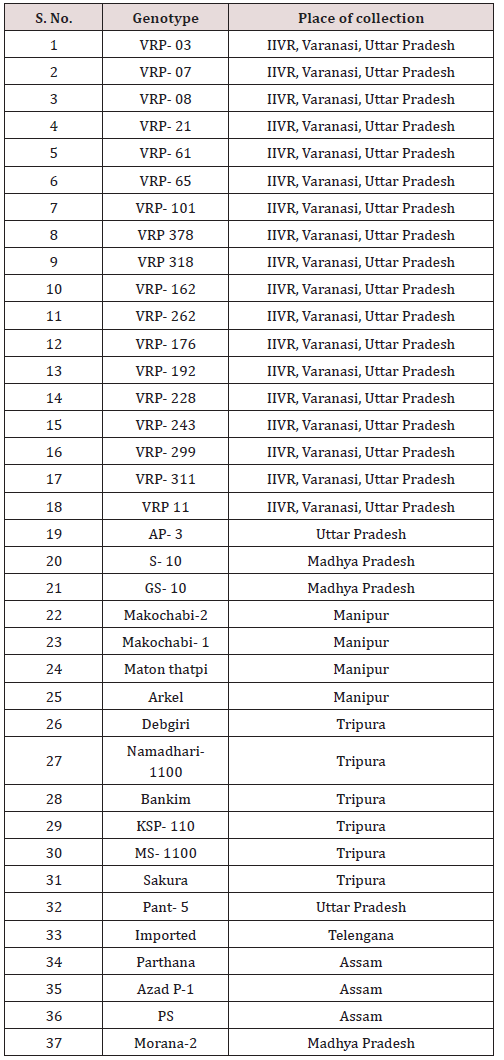
A total of 37 pea (Pisum sativum) genotypes were used in the current investigation. These were planted in the pots with three replications and kept in the Field and the Greenhouse in rabi season, 2016. Complete details of the collected germplasm along with their respective places are given in Table 1. The maximum number of genotypes (19) was collected from Uttar Pradesh, of which 17 genotypes (designated as VRP) were collected from IIVR, Varanasi. The rest of the genotypes (18) were collected from Madhya Pradesh (2 genotypes), Tripura (6 genotypes), Manipur (4 genotypes), Assam (3 genotypes), Uttar Pradesh (2 genotypes) and Telengana (1 genotype).
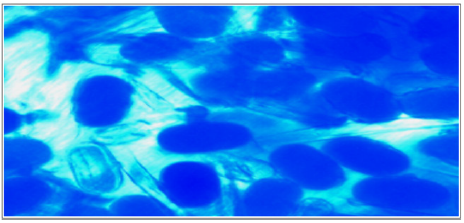
Five parents were selected for crossability studies. They were used for one way crossing and so the total number of selfing and crossing were 15 (Table 2). For each cross at least fifteen flowers were randomly selected from plants. Pollinations were performed from April to June 2016 and care was taken to avoid any damage to the stigma. The styles were collected 1 to 4 hours (as fertilization takes place within that period) after hand pollination and fixed immediately in 1:3 glacial acetic acid-ethyl alcohol for at least 24 hours and then preserved in 70 per cent alcohol till further use. For pollen germination and pollen tube growth observations, the pollinated flowers were gently rinsed in distilled water and pistils were separated from the flowers after which they were kept in a drop of 1N HCl for 10 minutes. They were again rinsed in distilled water and stained in 1 percent aniline blue [4,5]. The time required for staining was 10-20 seconds depending on the thickness of the style and the stage of penetration of the pollen tube in the stigma. After staining, the pistils were destained for 20-24 hours in a 1:1:1 mixture of 40% acetic acid: orthophosphoric acid: distilled water. The pistils were then rinsed in distilled water and mounted in pure lactic acid and studied under the microscope. The pollen grains and pollen tubes stained deep blue.
During morning hour, at the time of or after anthesis, dehiscent anthers were collected from randomly selected flowers. The collected anthers were stained with 2% acetocarmine solution. Gentle tapping of the material after placing of cover slip was done in order to release pollen grains from the anthers prior to microscopic observations. Observations were taken using microscope at 400 times magnification i.e. 10 X objective lens with 40 X eyepiece. Total number of viable and non-viable pollen was recorded and was expressed in terms of percentage which was again used to compare with percent of fruit set. Analysis of genetic diversity among collected germplasm was done using a set of 17 polymorphic SSR primers. Extraction of genomic DNA was done from young leaf sample. CTAB method of DNA extraction [6] was followed in the present study. The quantification of DNA was done by staining DNA with ethidium bromide after electrophoresis in 0.8% agarose gel at 80 V for 1 hour in TBE buffer (0.04 M Tris borate, 0.001M EDTA, pH 8.0) using known DNA concentration standards. Molecular weights of bands were estimated by using 100 bp for SSR.
The homology of bands was based on the distance of migration in the gel. SSR amplicons obtained from each entry were resolved as multiple and a single band, respectively on the agarose system and the pair-wise correlation matrix was developed on the normalized data set to find out the relationship among 37 accessions of pea. Scoring of PCR product was done in 2.5% agarose gel (Sigma, UltaPure Agarose 1000). For loading in the gel, 5μl of PCR product was mixed with 2μl (1X) loading dye and 100 bp of a DNA ladder (GeneRuler, Fermentas) was used as a size standard. The gel was run at 90 volts for around 2½ hours. Gel picture was taken at 320nm using proteinsimple AphaImager MINI gel documentation system and scoring of the bands was done according to the size of the amplified PCR products. Calculation of allele frequency was done using Microsoft excel while heterozygosity and PIC were calculated using online PIC calculator (https://www.liverpool. ac.uk/~kempsj/pic.html). The SSR data archived in the Microsoft excel sheet were used to generate cluster dendrogram according to Ward’s minimum variance method.
Results and Discussion
Pollen fertility
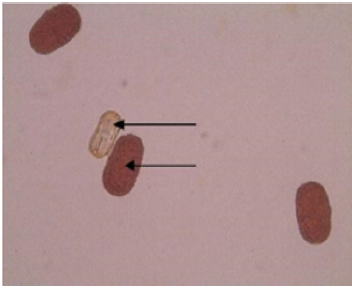
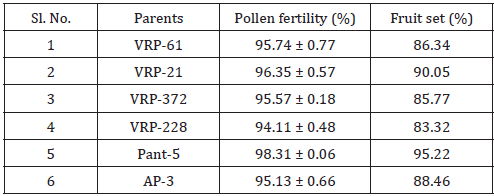
In this study, maximum pollen fertility was observed in Pant- 5 (98.31%) whereas the lowest pollen fertility (94.11%) was recorded in VRP-228 (Table 3). However, the average percent pollen fertility did not show too much difference among the accessions. Munhoz [7] performed an experiment related to the fertility of pollen grain in case of Carica papaya. In this experiment, they compared the effectiveness of in vitro germination technique and pollen staining test in papaya variety i.e. Sunrise Solo. In case of in vitro germination technique, germination was higher in the media without essential elements but with a higher concentration of agar (65% compared with 51.5%). In another case, they used five stains namely 2,3,5-triphenyl tetrazolium chloride, Alexander’s stain, acetocarmine, iodine-potassium iodide and Sudan IV. They found that the pollen viability estimated with TTC was 67.5% and similar to germination results providing a reliable estimate of in vitro germination. But the four other stains overestimated pollen viability (>90%) (Figure 1).
Pollen germination
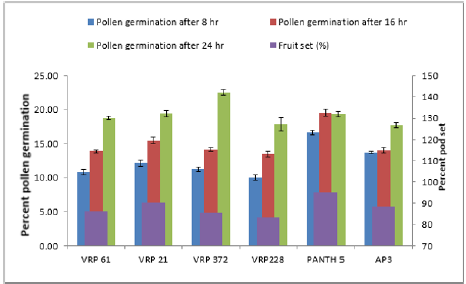
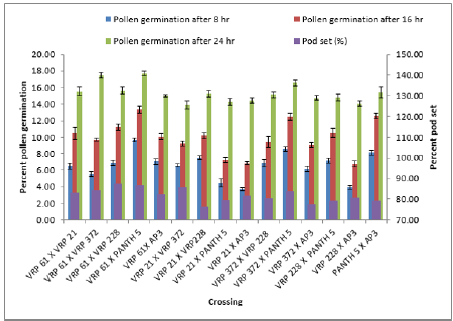
In crosses between the parents, the maximum pollen germination was recorded in VRP-61 X Pant-5 (9.68%) and the least was found in VRP-21 X AP-3 (3.71%) after 8 hours of pollination. After 16 hours of pollination, maximum pollen germination was recorded in VRP-61X Pant-5 (6.76%) and the least germination was recorded in VRP-228 X AP-3 (6.76%). After 24 hours of pollination, maximum pollen germination was recorded in VRP-61 X Pant- 5 (17.69%) and the least was recorded in VRP-21 X VRP-372 (13.93%). Fruit set on selling was maximum in Pant-5 (95.22%) where pollen germination was also maximum i.e. 16.67 % and the least was in VRP-228 i.e. 10.04 % after 8 hours of pollination. In crosses, VRP-61 X VRP-228 showed the highest fruit set (87.50 %) with 15.24% pollen germination after 24 hours of pollination. The highest pollen germination after 24 hours of pollination was recorded in the cross VRP-61 X Pant-5 (17.69%) where fruit set was also good i.e. 86.67 %. The least pollen germination was seen inVRP-21 X VRP-372 (13.93%) after 24 hours of pollination. Pollen germination increased from 8 hours to 24 hours after pollination.
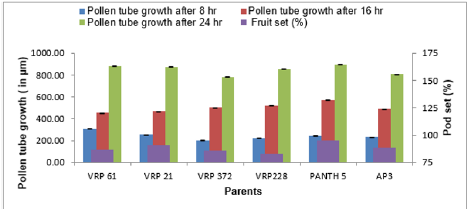
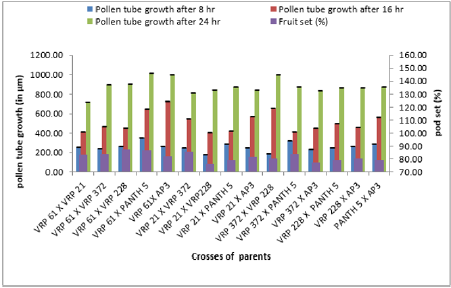
In the present study there was a regular increase in percent pollen germination after 8 hours to 16 hours in both selfing and in crosses (Figure 2 & 3). After 8 hours of pollination in selfing, the maximum pollen germination was recorded in Pant-5 (16.67%) and the least pollen germination was recorded in selfing of VRP- 228 (10.04%). There was an increase in pollen germination from 8 hours to 24 hours. In crosses between the parents, the maximum pollen germination was recorded in VRP (18) X Pant-5 (9.68%) and the least was found in VRP-21 X AP-3 (3.71%) after 8 hours of pollination. Highest pollen germination was recorded in VRP-61 X Pant-5 (17.69%) suggesting a very high pollen-style compatibility among these accessions and lowest in VRP-21 X VRP-372 (13.93%) after 24 hours of pollination. Monika [8] reported that the common pre-fertilization barriers found to occur in many wide crosses are pollen-pistil incompatibility and stated that these barriers are influenced by delayed pollen grain germination and pollen tube growth of one species on the stigmas of another species. Erdogan [9] reported that the effects of sucrose concentration on pollen germination were statistically significant with increase in sucrose concentration resulting in increase of germination and it decreased after that point.
Pollen tube growth
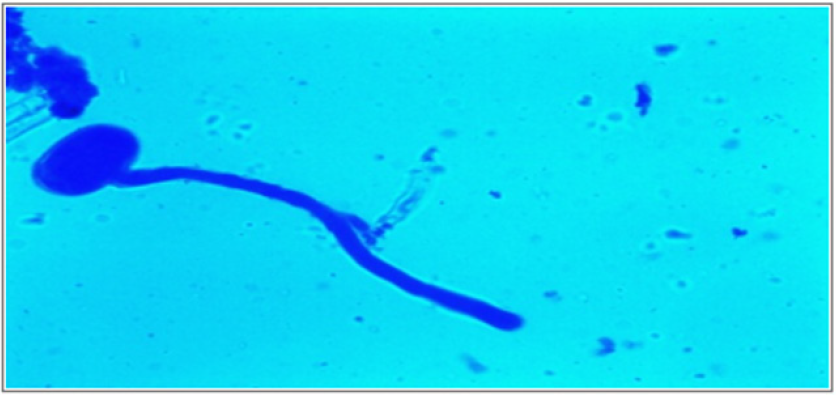
The emergence of pollen tubes on the stigma and the style was seen after different time intervals on selfing and in crosses. After penetrating the stigma hairs, the tubes grew through these hairs into the style. Pollen fall on the stigma of each individual floret was variable. Because of the irregularity in pollen grain germination and poor staining of pollen tubes it was very difficult to measure the pollen tube length in the thick tissues at the base of the style. At 8 hours after pollination, a number of pollen grains had germinated, and the tubes had penetrated into the stigma hairs. Some of the pollen tubes had just started their growth in the hairs and a few had already entered the transmitting tissue of the style. After 8 hours of selfing, the maximum pollen tube growth was observed in VRP-61 (309.73μm) and the minimum in VRP-372 (119.62 μm) (Figure 4). In crosses, maximum pollen tube growth was observed in VRP-61 X Pant-5 (354.11μm) and minimum was observed in VRP-21 X VRP- 228 (182.30μm) (Figures 5 & 6).
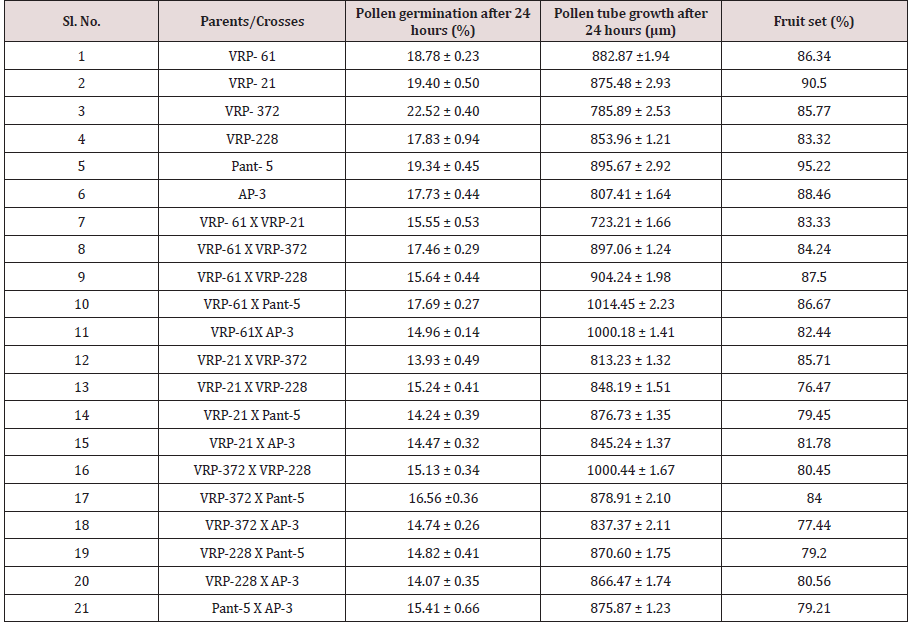
After 16 hours of pollination, there was a greater differentiation and elongation in the pollen tubes where some had just started to elongate and all intermediate stages were observed. On selfing, maximum pollen tube growth was observed in Pant-5 (568.70μm) and the least in 61(453.11μm). In crosses, maximum pollen tube growth was observed in VRP-61 X AP-3 (724.01μm) and the least in VRP-21 X VRP-228 (407.21 μm). After 24 hours of pollination, very long pollen tubes were recorded and since the styles were quite long, the pollen tubes could not be traced up to the base of the style as their staining became faint when they worked their way towards the ovary. On selfing, maximum pollen tube growth was observed in Pant-5 (895.67μm) and the minimum was observed in VRP-372 (785.89μm). In crosses, maximum pollen tube growth was observed in VRP-61 X Pant-5 (1014.45μm) and minimum pollen tube growth was observed in VRP-61 X VRP-21 (723.21μm). In some crosses pollen tube growth was more than in the selfings (VRP-61 X Pant-5, VRP-372 X VRP-228 and VRP-61 X AP-3) as well the fruit set, for example in VRP-61 X VRP-228, VRP-61 X Pant-5 and VRP-21 X VRP-372, respectively.
Cheung [10] observed that pollen tube penetrates the pollen grains coat through preformed apertures in the exine. They reported that almost all metabolic activity is localized in the tip of the pollen tube. Georgieva [11] reported that the highest germination percentage also correlated with the greatest pollen tube length, regardless of cultural medium. Rangkham [12] reported a positive correlation between pollen germination and fruit set in cowpea accessions. It was like that also between pollen tube growth and fruit set. Similar results were obtained by Debbarama [13] in Capsicum during wide hybridization and also by Kharkongar [14] during wide hybridization in Solanum.
Fruit set
Table 4 shows that the maximum fruit set was obtained in selfing as compared to crosses. Among the selfing, the maximum fruit set was obtained in Pant-5 (95.22%) and the least in VRP-228 (83.32%). When the parents were crossed, the maximum fruit set was obtained in VRP-61 X VRP-228 (87.50%) and the least fruit set was obtained in VRP- 21 X VRP-228 (76.47%). In general, fruit set was less in crosses. From this study, it was observed that fruit set had a non-significant correlation with pollen fertility, pollen germination and pollen tube growth. Suganiya [15] observed that boron treated plants showed higher percentage (91.4%) of fruit set than untreated control (62.77%). This may be due to role of Boron in maintaining of cell integrity, enhancing respiration rate and metabolic activities. Vez [16] examined the pollinator contribution to the production of cowpea. They found that higher fruit set in the presence of pollinators (83%) than in their absence (77%). They also observed that cross pollination reduced both the number of seeds per pod and fruit set relative to self-pollination.
Correlation studies in crosses of Pisum sativum
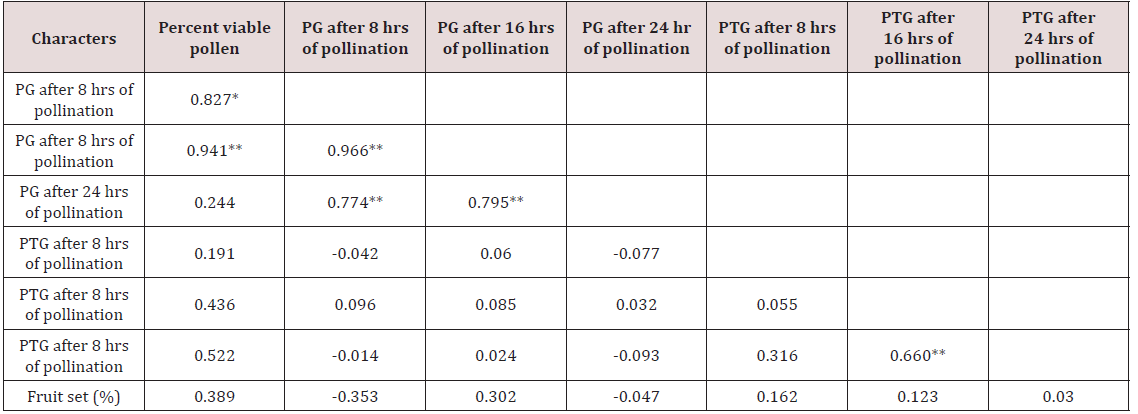
Correlation studies on pollen germination showed nonsignificant values for percent viable pollen. However, pollen germination after 8 hours of pollination was highly correlated with pollen germination after 16 hours of pollination and 24 hours of pollination had a highly significant correlation with pollen germination after 8 hours and 16 hours of pollination, respectively (Table 5). Similarly, pollen tube growth recorded non-significant correlation with percent viable pollen. Pollen tube growth after 8 hours of pollination was observed to be negatively correlated with pollen germination after 8 hours, 16 hours and 24 hours of pollination. In the same way, pollen tube growth after 16 hours of pollination was observed to be highly correlated with pollen tube growth after 24 hours of pollination.
Fruit set had a negative correlation with pollen germination (-0.353 and - 0.047) after 8 hours and 24 hours of pollination, respectively. A positive correlation with pollen tube growth was seen which was non-significant (0.162, 0.123 and 0.030) but a positive non-significant correlation was established between fruit set and percent viable pollen (0.389). Pollen fertility had a nonsignificant correlation with fruit set (0.389). Similarly fruit set had non-significant negative correlation with pollen germination (-0.353 and -0.047). Jaitly [17] reported that percent pollen germination was more directly correlated with seed set, and the rate of pollen tube growth and percent pollen tube abnormalities do not seem to be affecting seed set to that extend. And there was also positive correlation with pollen tube growth with fruit set (0.162, 0.123 and 0.030).
SSR analysis
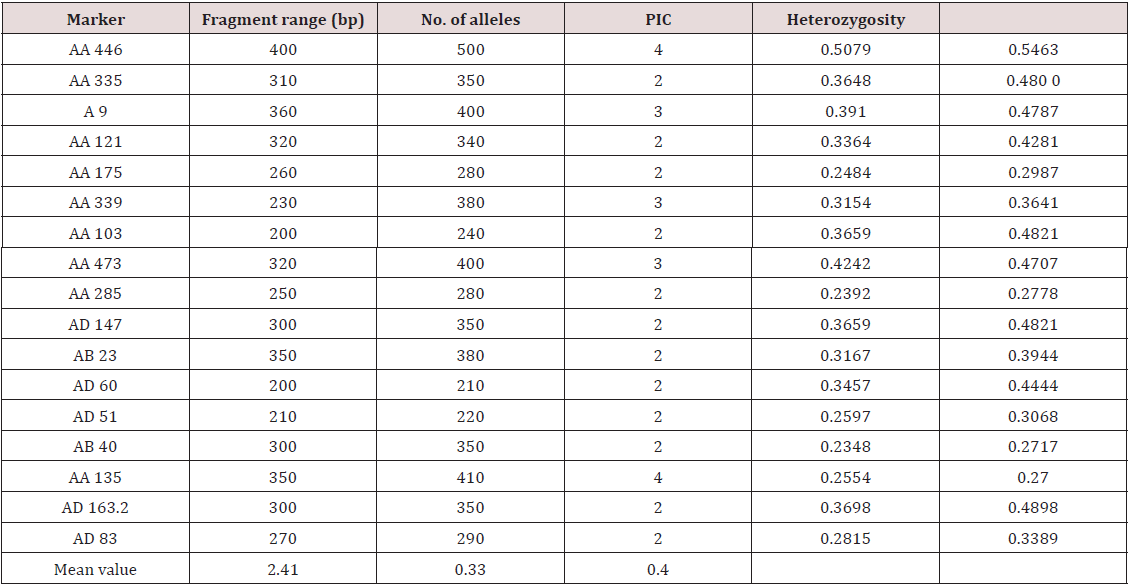
Twenty-one primers were used for genetic diversity analysis and 17 primers were found to be polymorphic. The polymorphic primers generated a total of 41 alleles. The number of alleles ranged from 2 (AA 335; AA 121; AA 175; AA 103; AA 285; AD 147; AB 23; AD 60; AD 51; AB 40; AD 163.2; 22) to 4 (AA 446 and AA 135), with an average of 2.41 per locus (Table 6). The number of alleles suggested that most informative loci were AA 446 and AA135 (4 alleles each), AA 9, AA 339 and AA 473 (3 alleles each). Contrarily, the least informative loci were all others (2 alleles each). The data obtained from SSR analysis were subjected to Euclidean distance matrix analysis to find out the relationship among the accessions analyzed. The value of Euclidean distance matrix coefficient ranged from 1.41 to 5.00. Based on Euclidean distance matrix it was found that the highest genetic distance coefficient was found between Morana-2 and Makochabi-1 (5.00) whereas (VRP-262, GS-10), (VRP-262, Parthana) and (VRP-262, VRP-243) showed lowest genetic distance coefficient. From the dendrogram generated using Euclidean distance matrix analysis of the data, the genotypes were grouped into two major clusters (Figure 7).
The first major cluster I comprised of 21 accessions, which was divided into I A (VRP-7, Parthana, VRP-262, GS-10, PS, S-10, MS- 1100, Arkel, and I B sub clusters. This I B cluster was further divided into small sub clusters i.e. II B I (VRP-176, VRP-03, and VRP-243) and IIB II (VRP-61, Debgiri, VRP-299, VRP-65, VRP-21 and VRP- 318). The second major cluster II was divided into II A and II B sub clusters. The sub cluster II (18) A consisted of KSP-110, VRP-313, VRP-228, Makochabi -1, PP and VRP-378 which are highly similar to each other and sub cluster II B comprises of Sakura, VRP-101, VRP- 8, Matonthatpi, VRP-162, Morana-2, VRP-192, Makochabi-2 and VRP-11. A number of studies have been carried out to study genetic diversity within the pea germplasm, including wild and cultivated species, using various approaches [18]. In addition to morphological traits and biochemical assays, molecular markers [19] have been used to identify genetic relationships among various accessions to explore the genetic diversity. Molecular markers have the potential to explore genetic diversity by detecting polymorphisms that improve the efficiency and precision of conventional plant breeding. A variety of DNA-based marker systems have been used extensively for diversity analysis in plants, including random amplified polymorphic DNA (RAPD) marker, amplified fragment length polymorphism (AFLP) [20], and simple sequence repeats. Among these SSRs, or microsatellites are the most widely applied technique for genetic diversity analyses in crop species [2]. SSRs are very reliable owing to their high polymorphism level, codominant inheritance, and good reproducibility [21-24].
The present study revealed the genetic diversity within a collection of pea germplasm representing different regions of India, using molecular (SSR) approaches. Assessment of genetic variability within a germplasm is of interest for practical applications such as conservation of genetic resources and for breeding purposes, to predict the ability to combine or to rapidly verify the breeding material. Hence, it is crucial for genetic improvement and elite gene exploitation, such as tolerance genes to abiotic stresses (Figures 8 & 9). In the present study genetic diversity has been carried out among 37 accessions of pea by using 17 SSR markers. All 17 primers showed polymorphism with total number of 41 alleles with an average of 2.41 per locus. The coefficient of genetic distance obtained in the present study ranged from 1.41 to 5.00, indicating that high level of genetic diversity among the 37 genotypes. These scores are higher than previous pea studies [14]. Kumari [14] analyzed genetic diversity among 28 genotypes using 32 SSR markers. Among them 44 polymorphic bands per primer were obtained (Figure 10).
Figure 8: Hierarchical cluster plot generated using Euclidean distance matrix showing relationship among 37 accessions of Pisum sativum using 17 SSR markers.
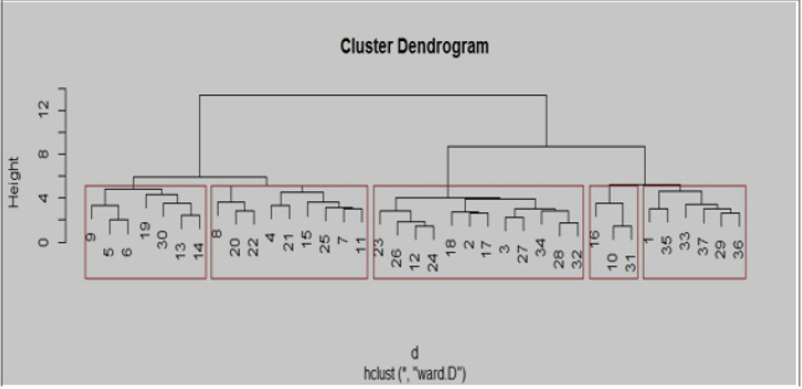
Figure 9: Gel image showing SSR profile obtained by SSR AA 446. Lane 1-37 represent the genotypes (Genotypes name given in Table 1).
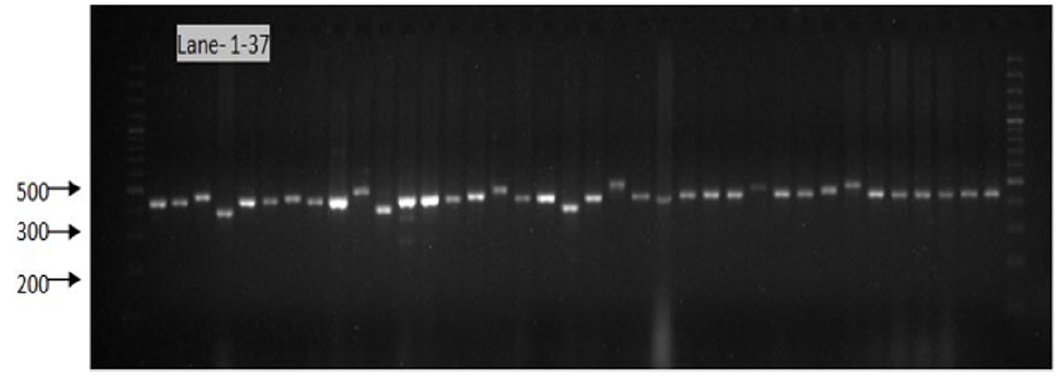
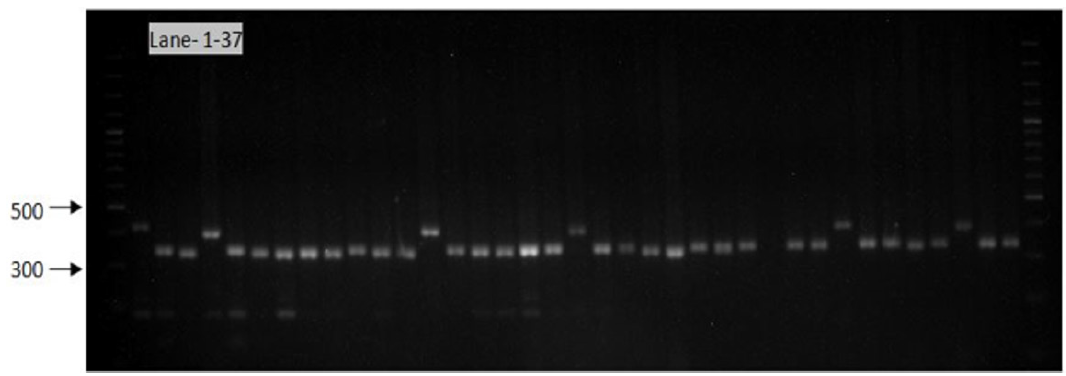
Figure 10: Gel image showing SSR profile obtained by AA473 primers. Lane 1-37 represent the genotypes (Genotypes name given in Table 1).
The variation in genetic diversity among these cultivars ranged from 0.11 to 0.73. In this present study polymorphic information content (PIC) values ranged from 0.23 to 0.50 with an average of 0.33 which is higher in previous study [19]. Smykal [19] surveyed 164 pea accessions using 10 SSR loci. A total of 53 alleles were identified with a minimum three and maximum eight alleles per locus. Twelve rare alleles (22%) with frequencies below 0.05 were found at six SSR loci. Calculated PIC values were high, ranging from 0.697 to 0.964, with an average of 0.89. Pyngrope [25] did genetic diversity study in blackgram with SSR markers and found these markers very useful. Ahmad [26] used 35 diverse Pisum accessions to assess genetic diversity in using 15 polymorphic microsatellites located on different pea chromosomes. Microsatellites were found to be polymorphic, amplifying a total of 41 alleles and were able to differentiate all 35 Pisum genotypes. These markers were scored by their polymorphic information content (PIC), ranging from 0.055 (AA 206) to 0.660 (AB 72) with an average of 0.460, and by their discriminating power (D), which varied from 0.057 (AA 206) to 0.679 (AB 72) with an average of 0.475 [27].
Read More Lupine Publishers Agriculture Journal Articles:


No comments:
Post a Comment
Note: only a member of this blog may post a comment.