Lupine Publishers | Current Investigations in Agriculture and Current Research
Abstract
Sudan is endowed with vast and diverse agricultural resource base that provides various means of sustaining livelihood. Although there is sufficient production in some seasons, but it cannot achieve food and nutrition security for the whole population. Food security depends in Agriculture as a backbone for food availability among the farm households in Blue Nile State, which make it difficult to obtain their sufficient food needs from their low production. The overall objective of this research is to measure food insecurity and malnutrition situation within the farm household in the state through specific objectives to: Identify the main livelihood systems among households, analyze the food and nutrition insecurity and to identify prevalence of undernourished and the depth of food insecurity. The adopted research methodology started by developing a questionnaire to gather the primary data supported by secondary data from different sources. The selection of the studied area (Blue Nile state), is based on the fact that the situation need to be deeply investigated for better analysis and better interventions. The analysis based on two analytical methods; descriptive analysis and modeling by using ADePT – FSM, to reach the results that satisfy the objectives of the research. Sets of indicators are analyzed to get a real picture on the food and nutrition situation in the state, some among others are; production, food consumption, coping mechanisms, Household Diet Diversity Score, estimation of nutrient intake by income quantiles and estimation depth of food deficit and prevalence of undernourished people.
The main results obtained by the analysis indicated that during the hazards the households practice some coping mechanism to adapt the situation. It is found that at state level 45% do not practice any of the coping mechanisms which means that they can withstand the shocks, while 23% use low coping mechanism, 19% and 14% use medium and high coping mechanisms respectively. Low diet diversity exists among the households which illustrated that 5.64 and 4,65 food groups were consumed (with and without sugar) respectively and this is one of the drivers of malnutrition status. When analyzing the nutrition in the different income group, it is revealed that the lowest macro nutrient intake is estimated within the lowest income quantile; 54,57, 342,32 and 37.57 g/ person/day for protein, carbohydrate and fats respectively, while the results for the middle-income quantile showed an estimation of 62.92, 363,48 and 48.66 for proteins, carbohydrates and fats respectively. The highest income group which consume diversified food shows a result of 118.71, 643,06 and 90.02 g/ person/ day, and this support them with enough energy to maintain a good life. The results of Prevalence of Undernourishment indicate the levels of undernourished between the farm HH as 26.61 which is considered high. Depth of food deficit is found to be very high (257.7 kcal/person/day), compared to FAO standard (177.2). To improve the deteriorated food and nutrition situation in the state a number of policies and interventions have been proposed by the researcher including transformation the subsistence agriculture into a productive enterprise through forming series of agricultural policies that aimed at improving production, markets performances, post-harvest process and credit facilities to enhance availability and access. In terms of utilization; improving nutrition status by diversification and awareness raising. Nevertheless, the focusing in children’s feeding and improving food cultures by enhancing the production and manufacturing of nutritive products especially for children and other targeted groups.
Keywords: Farm Households; Coping mechanisms; nutrient intake; Depth of Food Deficit; Malnutrition; ADePT – FSM
Introduction
Sudan is endowed with vast and diverse agricultural resource base that provides various means of sustaining livelihood. The natural endowments are abundant but not equally distributed over the whole area of Sudan.
Sudan economy is agricultural-based. The overwhelming proportions of the population live in rural areas depend upon subsistence farming for survival. In spite of its wide and diverse agricultural resource base relative to population size, Sudan’s economic performance is substantially based on agriculture that should maintain food, nutrition security and livelihood.
The agricultural sector is almost totally dependent on rainfall. This heavy dependency on rain-fed agriculture renders the majority of Sudan powerless in the face of erratic and unpredictable rainfall. As a result, the majority of the poor are severely affected by drought. This performance is below its potentials and this provides a general expiation to the puzzle that some of its population have no reliable accessibility to sufficient quantity and quality of nutritious food. Although there is sufficient production in some seasons, but it cannot achieve food security for the whole population due to multidimensional factors affecting food security, include:
a) The people live below the poverty line, are perpetually in a state of food insecurity.
b) Productivity decline due to physical, biotic, institutional and socio-economic factors.
c) The harsh climatic conditions such as low rainfalls, droughts and fragile ecosystem.
d) Conflicts and insecurity
e) Increasing rate of human and animal population.
f) Damage to soil, trees and pasture caused by overstocking and over grazing.
g) Serious suffering by the inhabitants as they are faced with several constraints and uncertainties in meeting their day-today livelihood needs.
h) The soaring prices for food and non– food items corresponding to low income levels.
i) Degradation of the resource base due to mono - cropping, erosion, encroachment by sand dunes, desertification etc.
j) Poor cultural practices and poor food diversification.
k) Poor public services such as health care, sanitation, infrastructure and markets etc.
The nutrition situation in Sudan is characterized by chronically high levels of Global Acute Malnutrition- (GAM > 15% in many parts – NNP reports 2013), which remains consistently above the international ‘emergency’ thresholds. Severe Acute Malnutrition (SAM) rates are also worryingly high at 5.3%. Furthermore, it is estimated that 2.2 million children are stunted (S3M, 2013). Stunting and other forms of under nutrition reduce a child’s chance of survival.
This paper aims to deeply analyse the food insecurity and the influencing food deficits in Blue Nile State and cover some linkages that have not been investigated in the previous researches (few researches analysed the food security situation and linked it with the malnutrition status as one of the main outcomes of food insecurity). More or less to propose policies to contribute in resolving the deteriorated situation based on the results of the analysis.
Objectives of the study
The overall objective of this research is to measure food insecurity and malnutrition situation within the farm household in Blue Nile state.
The specific objectives to:
a) Identify the main livelihood systems among households based on food and income sources.
b) Analyze the food and nutrition security based on different indicators.
c) Identify prevalence of undernourished.
d) Identify the depth of food insecurity.
e) Come up with recommendations and proposed policies to achieve food and nutrition security.
Research Methodology
Selected Area
a) Blue Nile state is one of the rainfed agricultural sector. lies in the tropical climate zone, which is characterized by high temperatures and heavy rainfall.
b) In Blue Nile state as a resource-based area on agriculture and livestock there is a great opportunity to utilize these resources to enhance food security.
c) Blue Nile as state lies in two dominant livelihood zones which have their implication on production, and hence food security and nutrition.
d) The total population of the state is 1,017,510 persons of which 44% live in urban areas and 55.5% in rural areas. The percentage of males to females is 51% and 49% respectively; CBS (2009).
e) The largest area cultivated by food crops which is significantly important factor in improving food availability from the own production.
f) Blue Nile state is a resource-based area on agriculture and livestock, there is a great opportunity to utilize these resources to enhance food security, not only for the state but also for other states in the country by searching out the situation and look for effective policies to contribute in resolving the constraints( constraints analysis).On the other hand, large number of households need more food considering that the average number of HH is about six persons as estimated by the (CBS – Sudan), added to that large family labor saves the cost of labor which is increasing during the recent years (opportunity cost).
Sampling
a) A numbered list of all households, acquired from the local committees, was used as a sampling frame to select households in each locality.
b) The type of sampling used in the study is the random sampling (multi stage sampling), to avoid bias in selecting the targeted households.
c) Three localities were selected; Damazine, ELrosairis and Altadamon with a total sample of 232. (Table 1)
Data collection
Two types of data were collected: primary and secondary data. primary data was collected by questionnaire. The survey captured data related to demographic characteristics, asset endowment, household food consumption, economic activities, wealth and income, household expenditure, access to basic services, and household coping strategies. Besides other socioeconomic factors.
Analysis
Descriptive statistics: It is most often concerned with two sets of properties of a distribution (sample or population).
I. It is used in the study to show the analysis of indicators. Chi square test and F statistics were used to determine the significance of variation in the different indicators among the farm households.
II. It provides simple summaries about the sample and about the observations that have been made
III. Such summaries may be either quantitative, or quantitative using percentages i.e. summary statistics, or visual, i.e. graphs. Some indicators analyzed by descriptive analysis are:
a) Production of Crops and Livestock: Although the production is diversified, the farms HHs in Blue Nile State cultivate a combination of food and cash crops. The production of field crops has highly fluctuated during the last decades. They usually cultivate and produce mix of crops to avoid risk that associated with crops diseases or instability of rainfall. The households sell some of these crops to cover other livelihood expenses.
b) Food Consumption Score (FCS): FCS identifies the score of food consumed. It is calculated as: FCS = sum Xn*W where Xn = the times the food groups consumed in a week, W = weight of food groups. The typical thresholds are: FCS Profiles 0 -21 Poor ,21.5 -35 Borderline, >35 Acceptable (WFP thresholds)
c) Coping Mechanisms: CM starts from low to high coping mechanisms (WFP, 2008). The coping mechanism was developed by the World Food Programme, it is commonly used to measure the frequency and severity of coping mechanisms.
d) Household Diet Diversity Score (HDDS): HDDS is defined as the number of unique food consumed by HHs members over a given period, it has been validated to be a useful approach for measuring household food access. The value of this variable ranges from 0 to 12. HDDS (0 -12) Total number of food groups consumed by members of the household. Values for A through L will be either “0” or “1”. Sum (A + B + C + D + E + F + G + H + I + J + K + L), the average HDDS indicator is calculated for the sample population. Average HDDS Sum (HDDS) Total Number of Households.
Analytical Modeling
I. The ADePT – FSM module is used to test the Depth of food insecurity and undernourishment of population in the selected areas. It is a data set and synthetic data drawn from idealized model.
II. Many indicators can be analyzed to estimate food insecurity and malnutrition using ADePT- FSM module in order to ensure the analysis of different variables and to determine the interrelationship between food and nutrition situation.
III. ADePT-FSM does not limit its outcome to statistics belonging to the “access” dimension of food security, namely caloric intake and macronutrients consumption are considered.
IV. The end result of this analysis by this model is to estimate the depth of food insecurity and prevalence of undernourished HHs.
V. Indicators are expressed in terms of quantities, dietary energy, and monetary values per person per day. Procedures of standardization starts with the conversion of food monetary values or quantities collected in the survey into dietary energy.
a) Estimation of nutrient intake by income quantiles: The average daily calories consumed by a representative individual in a population group of analysis are estimated as follows:
Kcal/ P/ D = Σ h h=1 * DEC
Σh h=1(hh_sizeh* num _ daysh
where H is the total number of sampled households belonging to the population group of analysis;
hh_sizeh is the total number of members (household size) in household h; num_daysh is the number of days of the food data reference period for household h
b) Estimation of Coefficient of Variation of Dietary Energy Consumption: If it is true that people tend to consume according to their respective dietary energy requirements (DER) and as long as there is an inter-individual variation in DER there will be variation in DEC due to physiological factors. For this reason, a component reflecting the variability of DEC induced by the factors determining the variability of DER, CV x|r (X) = CV (r) is also considered to estimate the total CV. Since this variation of a random nature, it is not considered in deriving the dietary energy requirements. However, in this context, where the variation in energy requirement is used for estimating the variation in energy intake. Aggregation: Finally, the CV of DEC is derived as a sum of the square of the two CVs .CV(x)= CV(x/v) = σ(x/v). μ x In ADePTFSM, the Coefficient of Variation of dietary energy consumption correspond to the CV whose value is the lowest between the CV from the empirical distribution and the CV obtained as a combination of the two sources of variability.
c) Prevalence of Undernourishment: The PoU expresses the probability that, by randomly selecting one individual from population, a person will be found to consume (on average and over a period of time) a level of food energy below the minimum required to maintain a healthy life. The operational definition of food insecurity that is embedded in this indicator is best labeled as “chronic undernourishment in a population”
The probability distribution framework is:
PoU = P(x<r˪) = ∫ x<r˪/sub> fx (x)dx = Fx(x r˪)
Where PoU represent the probability that an individual randomly selected within a population is found to be undernourished; x represent the daily habitual dietary energy consumption within a year of a “representative individual” in the population; r˪ is the daily minimum dietary energy requirements of a “representative individual” in the population; and f(x) represents the distribution of the yearly habitual dietary energy consumption across individuals, or, equivalently, the probability distribution of habitual food intake levels for the population’s “representative” individual.
d) Depth of Food Deficit: The depth of food deficit indicates how many calories would be needed to lift the undernourished from their status, everything else being constant. The average intensity of food deprivation of undernourished, estimated as the difference between the average dietary energy requirement and the average dietary energy consumption of the undernourished population, is multiplied by the number of under nourished to provide an estimate of the total food deficit in the area, which is then normalized by the total population.
For each category of the population group, the depth of the food deficit has to be estimated as the absolute difference between the average calories consumed by the deprived population and the average dietary energy requirements multiplied by the prevalence of undernourishment. The average consumption of the undernourished population can be computed by taking the average consumption corresponding to the part of the distribution of dietary energy consumption below the minimum dietary energy requirement, as follows:
μμ=(∫0 MDERxf(x)dx)/(∫0 MDERf(x)dx)
Where μμ the average dietary energy consumption of the food deprived population; is the density function of dietary energy consumption; and MDER is the minimum dietary energy requirement.
Absolute food deficit from average dietary energy requirements (ADER) in food deprived population
Food deficit (kcal/(person/day)) = ADER-μμ
Depth of food deficit is then estimated as:
Depth of food deficit = kcal/(person/day) (ADER -μμ )*PoU
Where PoU refers to the Prevalence of Undernourishment.
Results and Discussions
Production
Crop production:
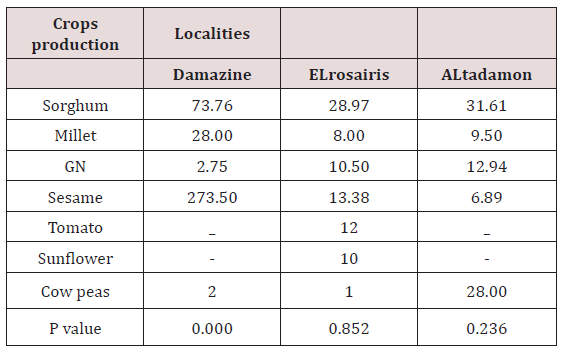
a) Sorghum production is 73.76 tons, 28.97 tons and 31.61 tons in Damazine, ELrosairis and Altadamon localities respectively.
b) For millet which is considered as one of the staple food crops the average production is about 28.00 tons,8.00 tons and 9.50 tons in Damazine, ELrosairis and Altadamon respectively.
c) On the other hand, the largest production of sesame is about 273.50 tons which allocated in Damazine. In ELrosairis and ALtadamon localities the averages production of sesame are about 13.38 tons and 6.89 tons, respectively.
d) In season 2015/2016 sunflower is only grown in ELrosairis locality with average production of about 12 tons. In Altadamon locality cowpea production is about 28 tons and tomato is cultivated in ELrosairis with average production estimated as 12 tons.
e) Insignificant variation among households in the selected localities (P< 1). Generally, the level of production for both food and cash crops seem to be very low.
f) This shows the insufficiency of food and income generated from cash crops (Table 2).
Source: Field survey 2016.
State – season 2015/2016 (000 tons).
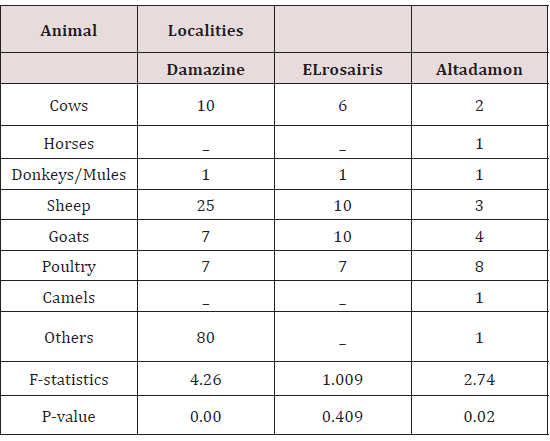
Livestock production: (Table 3)
Source: Field survey 2016.
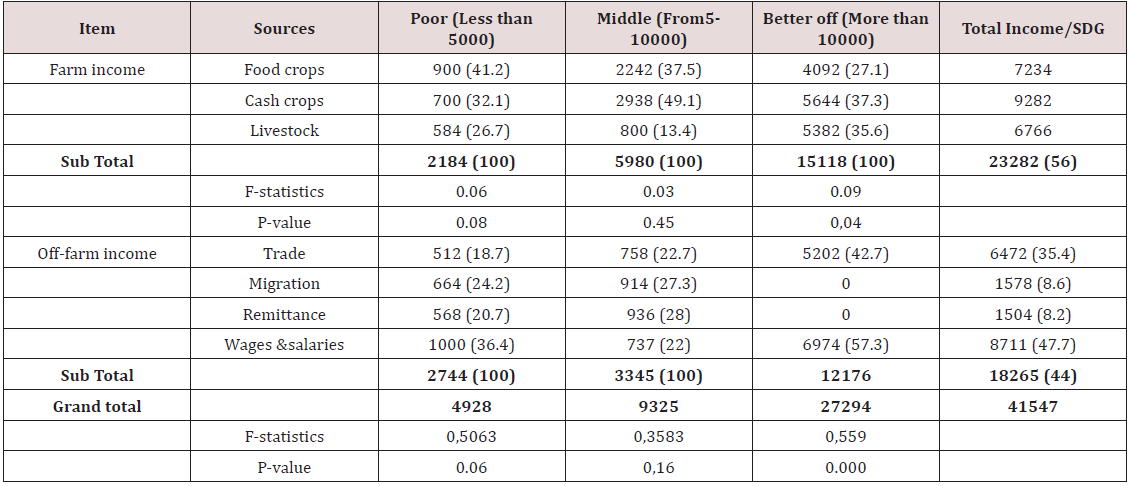
Fam and off Farm Households Income Groups: (Table 4)
Remarks: numbers between brackets are the percentages.
Source: field survey 2016.
Expenditure for Food and Non-Food: (Table 5)
Source: Field survey 2016.
Food Consumption Score – FCS:
98% described as acceptable while 2% are poor and no borderline FCS in Damazine. In ELrosairis; FCS is 82%. 14% and 4% for HH with acceptable, borderline and poor respectively. 80%, 20% FCS for acceptable, borderline in ALtadamon while poor FCS is 0%. The result research showed that the closeness of fit of the FCS to the benchmark classification improves when small amounts of food items are excluded from the assessment.
(Table 6).
Source: Field survey 2016.
Coping Mechanisms
a) Coping Mechanisms themselves are discussed before (Maxwell and Frankenberger et al., 1992), and (Maxwell et al., 1996), proposed a method for taking consumption-related strategies and constructing a numerical index. Method for generating these data is from the most knowledgeable woman in the household regarding food preparation and distribution within the household.
b) The HH who have no coping mechanisms represent the higher percentage in Damazine and ALtadamon, with the same percentage (55%), while in ELrosairis they are lower (31%). The HHs with poor coping mechanisms are 25%,18% and 30% in Damazine, ELrosairis and Altadamon respectively. The HHs practicing medium coping mechanisms are 14%,24% and 15% in Damazine, ELrosairis the ones with medium respectively. This means that less than half of HHs have no coping mechanisms followed by those who is practicing low coping mechanisms, while h coping mechanisms are 19% and 14% from the total HHs. (Table 7)
Source: Field survey 2016.
Household Diet Diversity Score (HDDS):
a) HDDS is analyzed for two categories: one is consumption of FG with sugar and the other without sugar. The results in the table showed that it is estimates as 6.12, 5.32 and 5.28 in Damazine, Elrosairis and Altadamon respectively with higher level in Damazine while the HDDS without sugar is indicated as; 5.13,4.35 and 4.30 in Damazine, Elrosairis and Altadamon respectively. i.e.it is higher in Damazine than in the other two localities.
b) While the results of (Gina K. and Andrea B. et al., 2018), by using SPSS developed a Comparison of the household dietary diversity and food consumption scores, and this is coinciding with the results of this research (Table 8).
Source: Field survey 2016.
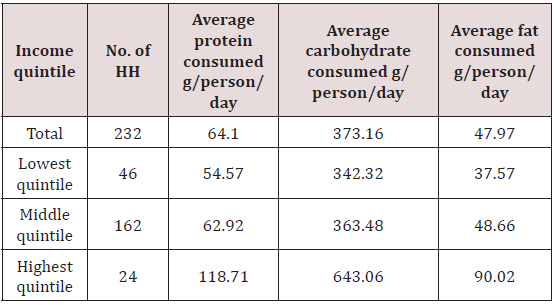
Average level of nutrient intake by income quintile:
The average daily carbohydrate intake is about 373.16 g/ person/day, 342.32 g/person/day and 363.48 g/person/day in the lowest, middle and high-income groups respectively. The average daily level of fat intake for farm HH is about 47.97 g/person/day, 37.57 g/person/day and 90.02 g/person/day for the HH for the low, middle and high-income groups respectively. It also appear in table that the average daily fat intake is different from HH in the lowest and middle group (the table) but it is significantly different in the highest group this implies that the highest group consume more fat which has an impact on their nutritional status.In summary nutrient intake for the lowest group is the least for the three nutrients which cause deficiency in these nutrients within the group (Table 9).
Source: Field survey 2016.
Coefficient of Variation due to income and other factors (CV):
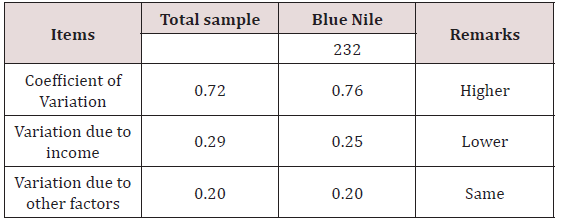
It is estimated that the coefficient of variation due to income in Blue Nile State is lower than the total sample and the one due to other factors (socio economic) is the same, because the state is affected by factors occurred in the total sample (Table 10).
Source: Field survey 2016.
Prevalence of Undernourishment (PoU):
a) The PoU expresses the probability that, by randomly selecting one individual from the population, a person will be found to consume (on average and over a period of time) a level of food energy below the minimum required to maintain a healthy life. The operational definition of food insecurity that is embedded in this indicator is best labeled as “chronic undernourishment in a population (Ana M. et al., 2015).
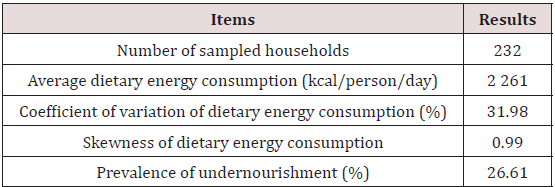
b) The results from the field survey indicates the levels of undernourished between the farm HH as 26.61 which is considered high (Table 11).
Source: Field survey 2016.
Depth of Food Deficit in Blue Nile State:
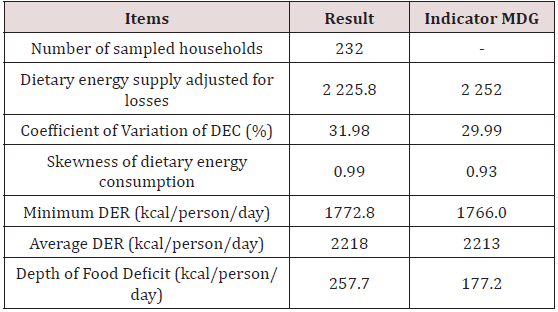
The Depth of the Food Deficit defined as the number of calories needed to lift the undernourished from their status, everything else being constant. The average intensity of food deprivation of the undernourished, estimated as the difference between the average dietary energy requirement and the average dietary energy consumption of the undernourished population (fooddepreviation), the results revealed that the Depth of Food Deficit in Blue Nile state within the farm households is estimated as 257. 7 kcal/ person / day, which is higher than the standard of the Millennium Development Goals (MDGs) by about 80.5 kcal / person / day (Table 12).
Source: Field survey 2016
Conclusion and Recommendations
Conclusions
a) The production for both food and cash crops is very low. This indicates the insufficiency of food and the low income from cash crops. Cereal balance sheet shows that HHs suffer from food gap.
b) Low diet diversity which is the main factor for malnutrition status among the farm households besides others.
c) The coping mechanisms frequencies revealed that the farm households were suffering from food insecurity and cannot be resilient to shocks. food deficit occurs mainly due to hazards, low income, low productivity and insufficient resources.
d) To recognize the severity of the situation and the drivers is important to implement planning for intervention in order to enhance the access to food which is hindered by low income within the farm households compared to the global standards which is 1 USD / P / Day
e) Food insecurity and malnutrition exist mainly driven by a number of determinants, which contribute to higher deficiency in energy, macronutrient intake and hence influence the nutritional status of the persons within the households who are relying on one or two food groups and this cause nutrient deficiency.
f) The outcome showed that households in the selected localities are mostly suffer from food insecurity reflected in the high depth of food deficit and high rates of undernourished people.
g) The overall conclusion is that Blue Nile State is falling under food and nutrition insecurity (although it is considered as one of the main rainfed areas). This situation can be implied to the traditional sector in Sudan because of the similarities in the livelihoods, production and consumption patterns.
Recommendations and Proposed Policies
a) Transforming the traditional subsistence agriculture into a productive enterprise that goes beyond meeting household’s food needs.
b) To help the rural farmers to diversify their food. It is recommended that crop diversification must have the priority in forming credible policies.
c) Restoring the livelihood assets lost during conflict and climatic variation through resilience building strategies.
d) Rural agricultural communities must also obtain greater access to credit through changing the attitude of the financial institutions towards small scale farmers.
e) Support policies to enhance cash crops production and marketing.
f) Importance of developing a food balance sheet rather than a cereal balance sheet to estimate the food gap in all food items (In Sudan only cereal balance sheet is used to estimate the gap).
g) Awareness raising by good food practices and diversification among household for better nutrient intake.
h) Making use of forest products and other local materials to manufacture nutritious meals for children to improve their nutrition status.
i) Enhance the decision-making abilities of the femaleheaded households concerning food production and consumption.
j) Efforts to improve nutrition must form the outset attack the detrimental reinforcing linkages among food insecurity, diseases, poor sanitation, inadequate education and malnutrition.
k) Rehabilitation and building of rural access roads is important to open up vast areas in the country to enhance food access, as well resilient marketing systems which will enhance food access.
l) Improve Post harvest techniques (transport, storage, handling, processing and marketing).to enhance food availability in all times.
m) The overall recommendation is to make the interventions oriented to humanitarian- development nexus to sustain food security and improve nutrition status.
n) It is highly recommended for future researches to deepen the analysis on some indicators and get evidence-based results from different angles.
Read More Lupine Publishers Agriculture Journal Article:




No comments:
Post a Comment
Note: only a member of this blog may post a comment.