Lupine Publishers | Journal of Oncology and Medicine
Mini Review
In 1927, Werner Heisenberg [1], published his “Uncertainty principle” which in brief states that it is impossible to simultaneously know both the position and momentum of an electron or any other particle with any degree of accuracy or “certainty.” To define the location of an electron required interaction with it. This interaction would result in movement of the electron and as a result, would move the electron. The best one could achieve is knowledge of where the electron was at the time of interaction. The first utilization of nuclear isotopes for medical imaging and evaluation of heart disease was conducted by Blumgart [2] in February of 1925 when he injected himself with Radium C, which emits alpha and beta particles and gamma rays. As such, the Geiger counter chamber developed by Blumgart and Yens, could detect the passage of blood carrying the radium. The studies would first be published in 1927 and become known as “circulation time” and would dynamically define myocardial contractility by comparing changes in count activity over time.
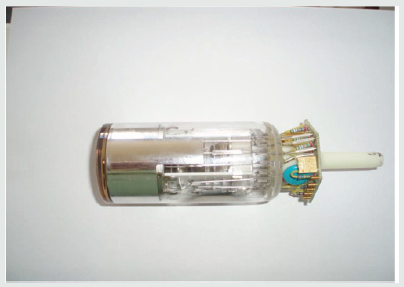
In 1957, Hal Anger [3] demonstrated the first gamma camera designed to detect the emission of radioactive decay emanating from the patient. In essence, a modern Geiger counter which could be held some distance from the chest to measure isotope decay while present in cardiac tissue. The decay (scintillation) is detected by the camera after being absorbed by the camera crystal (usually sodium iodide) with the subsequent release of an electron from the sodium iodide, which is subsequently detected by a photomultiplier (PMT) tube as shown in Figure 1, PMTs are composed of glass tube with a vacuum inside. Photons leaving the patient would approach the PMT from left to right, striking the photocathode material first. This results in electrons being produced as a consequence of the photoelectric effect. The focusing electrode subsequently directs these toward the electron multiplier composed of a series of electrodes (dynodes), each with a more positive voltage than the next. The electrons are accelerated toward the first dynode, arriving with a greater energy. This results in low energy electrons being generated by the first dynode, which are in turn accelerated toward the second dynode and so on.
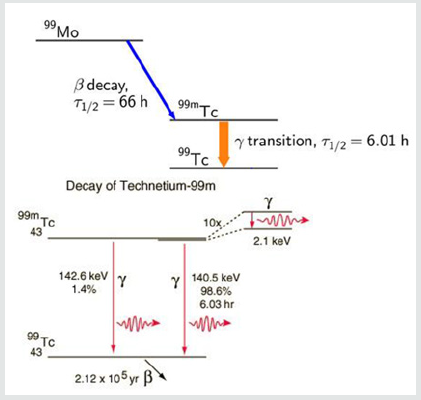
The process is known as secondary emission and results in an amplification of the original scintillation. The electrons finally reach the anode (far right part of PMT) where the accumulated charge results in a sharp current pulse indicating the arrival of the photon at the photocathode. These scintillations are tallied by the computer. These anger cameras have been used to image various regions of the body using radioactive isotopes which are known to localize to the tissues in question. For cardiac disease this has primarily included thallium-201 and technetium-99m. The utilization of these cameras have been assumed to be able to detect changes in isotope availability by “counting” the amount of radioactivity as described and translating this information into a black and white or color format image for human viewing and interpretation of disease. However, to the best our knowledge, no such experimentation has been carried out to determine if today’s gamma cameras can in fact accurately count radioactive decay required for image comparison. This quantification is necessary to compare redistribution of isotopes and to avoid errors in interpretation. This requires more than simply the ability to produce pictures of different brightness; it requires actual ability to measure differences in isotope decay (scintillation), as did Blumgarts Geiger counter. This is the basis of devices used to determine human radiation exposure and is a requirement in diagnostic imaging. To investigate this, we conducted a series of experiments with known quantities of Tc99m and utilized two different matrixes commonly employed in clinical cardiology to determine if the cameras can accurately measure radioactive decay. The acquisition of technetium-99m isotopes for diagnostic purposes results from the radioactive decay of the parent compound (Molybdenum) to the daughter compound (technetium-99m) is shown in Figure 2.
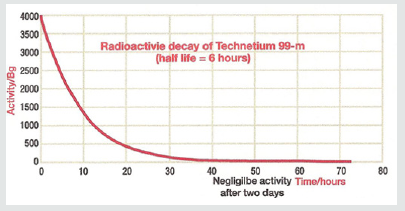
The production of technetium by bombardment of a molybdenum atom with deuterons was first documented by Carol Perrier and Emilio Segre in 1937. Technetium- 99m (meta stable) decays to Technetium 99 through the release of a gamma (photons) rays of 140.5 keV (98.6%) and 142.6 keV (1.4%) as shown. The result is Technetium-99 (Tc-99) with a half-life of 210,000 years. The halflife for technetium-99m is 6.01 hours as shown in Figure 3.
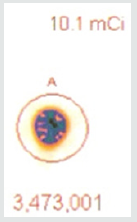
The radioactive decay of technetium-99m is shown. The physical half-life for Tc-99m is 6.01 hours. Given this information, one can calculate that over the course of 55 minutes there is a 10% decay of the isotope. In clinical studies looking at sestamibi redistribution to determine ischemia [4,5] the initial stress imaging is made at 5 minutes with the second imaging at 60 minutes. Each sample of technetium-99m contained 10.1 mCi (37.37 mBq) of radioactive compound. Each sample was sealed in a syringe preventing any leakage of material. If the cameras are able to accurately measure isotope decay, the camera should reveal a 10% reduction in count activity from the first image and the second image taken 55 minutes later. Utilizing a Philips Forte Dual head single photon emission computed tomography (SPECT) camera with general all-purpose collimators, the camera was set to (1) a 64 x 64 matrix and (2) 128 x 128 matrix settings. As shown in Figures 4a- 4c.
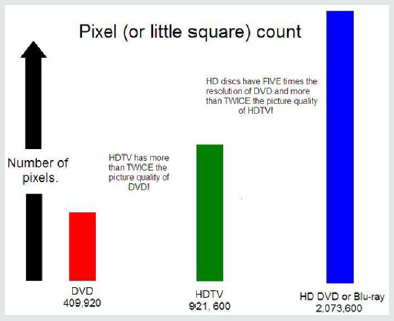
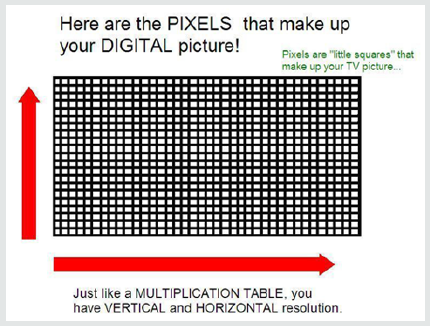
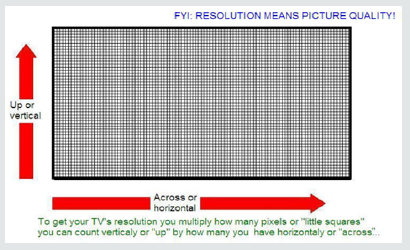
An effort to improve image “sharpness” is derived by increasing the number of pixels in a given field. Cameras set up with a 64 x 64 matrix (pixel) resolution, will result in a more blurred image, while a matrix of 128 x 128 (pixels) will increase image “sharpness.” As seen in Figures 4b & 4c, the cost of increasing “sharpness” occurs at the cost of more septa separating each pixel, which reduces the area available for information acquisition. Each septum itself is excluded from acquiring information on radioactive decay, exchanging information for sharpness, the greater the matrix (pixel) settings per image, the greater the localization of isotope emission within the field of view and the sharper the image. However, for each pixel, there are surrounding septa of lost information forming the border of the pixel. The question is whether the increase in image “sharpness” comes at the expense of “accuracy” of radioactive isotope count activity, which is the basis for image comparisons.
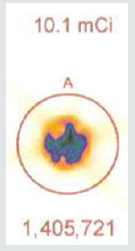
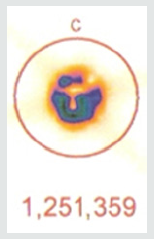
As shown in Figure 5a, the initial radioactive count obtained over 5 minutes from a syringe of 37.37 mBq of radioactive tc-99m using a 64 by 64-pixel matrix was 1,405,721. Using the same matrix and imaging 55 minutes later, Figure 5b shows the counts collected over 5 minutes were 1,251,359. The decay curve for tc-99m means that there should have been a 10% reduction in count activity. In this instance, there was a 10.98% reduction in measured isotope activity.
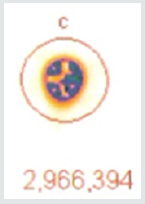
A 37.37 MBq syringe of technetium-99m-sestamibi is placed under the camera and counts acquired over 5 minutes. The same syringe is reimaged 55 minutes later for an equal amount of time. When the 64 x 64 matrix was used, the original count (5a) was 1,405,721, the second image (5b) count was 1,251,359, representing 89% of the original count activity. When the resolution was increased to 128 x 128 matrix, there was an additional 50% loss in data, with a 5-minute image (different syringe sample) count of (5c) 3,473,001. The second image count 55 minutes later (5d) was 2,966,394, representing a count decrease of 14.6%, 4.6 % more lost data than should have been shown. This reduction is due to increased pixels resulting in Fourier transform and modulation transfer factor data loss. Subsequently, total information is lost at the gain of localization information. Since we are looking for total cell uptake and release (redistribution) of the tracer, one must use the 64 x 64 matrix as a better index of isotope activity in exchange of resolution for accuracy [6,7].
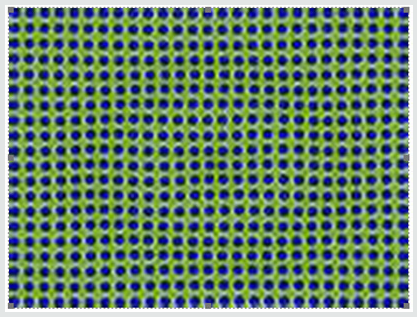
As efforts to improve image “sharpness” were made by changing the matrix to 128 x128, Figure 5c shows the initial count activity measured over 5 minutes was 3,473,001. When the syringe was reimaged 55 minutes later using the 128 x 128 matrix, the counts collected over a 5-minute period, as shown in Figure 5d, were 2,966,394. While there was an increase in actual radioactive count activity compared with the 64 x 64 matrix, this came at a cost of accuracy with a 14.59% reduction in radioactive count activity. This is 4.68 times the data lost as was seen with the 64 x 64 matrix. While the visual appearance desired by most clinicians to make diagnostic decisions is important, images can be manipulated to confirm what the diagnostician is looking for. These adjustments may lead to incorrect conclusions and visual interpretations alone may lead to incorrect conclusions. Visual illusions such as this shown here can result in incorrect diagnostic decision when depended upon by the clinician. This particular illusion demonstrates visual problems resulting from pixel information. When these illusions are the result of instrumentality, diagnosticians cannot reliably use them to make clinical decisions and the utilization of attenuation algorithms cannot reliably reduce these errors, making it even more important that we know what our nuclear cameras are truly capable of measuring and how to most accurately use them, When done to determine if someone has ischemic heart disease, such illusions can result in misdiagnosis. For that reason, multiple researchers have been trying to develop algorithms, which will reduce this human error. It is impossible to reduce this human error, if part of the error is the result of instrumentation. These findings have demonstrated that independent of the visual image seen by the clinician, this information is dependent upon the accuracy of the computer’s ability to detect the radioactive decay of isotope needed to make image comparisons. Like, Heisenberg’s uncertainty principle, this uncertainty principle comes at a cost. The ability to detect the location of the emission of the gamma ray is influenced by the matrix surrounding the acquired image of the heart. This precision of location comes at the cost of lost accuracy as to the number of gamma rays being emitted. Given this spatial limitation (sharpness) versus accuracy, like Heisenberg we are left with a dilemma. Do we sacrifice accuracy for “sharpness” or should we be more concerned with the necessary accuracy required to compare (Figures 4-6), thereby reducing errors made in evaluation of the extent of ischemic heart disease?.
Figure 6: The importance of recognizing visual illusions.
https://lupine-publishers-cancer-journal.blogspot.com/

No comments:
Post a Comment
Note: only a member of this blog may post a comment.