Showing posts with label Open Access Journal of Enviromental Sciences. Show all posts

Saturday, 6 May 2023

Lupine Publishers | Drivers for Future Energy Policy in The Developing World

 Lupine Publishers | Journal of Environmental & Soil Science


Abstract

The wheels of technology are turned by the conversion of energy from one form into another. Thus, energy is a key element of sustainable development. Current trends in energy supply and use are generally unsustainable, especially when the environment is affected by the emitted green–house gases. These are expected to double by 2050, and increased oil demand will heighten concerns over the security of supplies. Hence, research on green favorites should continue vigorously. It is unfortunate that these have their own limitations. In such a complex situation, consideration of energy priorities in research and development should be organized carefully, and drivers for future energy policy should be considered very critically. This should give very careful foresight for the viable technologies, energy efficiency, renewable energy, oil shale, nuclear energy, hydrogen energy, in addition to any future innovations. Energy is of vital importance for the processes of production and manufacturing. Thus, a key element of sustainable development.

Keywords: Energy Status; Energy Conservation; Oil Shale; Renewable Energy; Hydrogen; Fuel Cells; Energy Efficiency; Innovations

Abbreviations: CCS: Combined Cycle System; CO2 : Carbon dioxide; GHG: Green House Gas; H2 : Hydrogen; HC: Hydrocarbon; HV: Heating Value; HVAC: Heating Ventilation Air Conditioning; ICE: Internal Combustion Engine; JUST: Jordan University of Science and Technology; MED: Multiple Effect Distillation; NPPs: Nuclear Power Plants; PV: Photovoltaic; SHC: Solid Heat Carrier; STPP: Solar Thermal Power Plant; TE: Thermoelectric; TEG: Thermoelectric Generator; UF6: Uranium hexafluoride; UO2 : Uranium dioxide; US: United State

Introduction

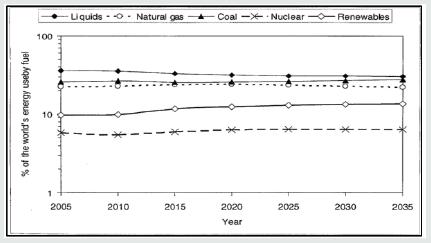
With the increase in energy demand and the expected shortage of the fossil fuel with time the need for sustainable resources increases. Hence, this is initially handled by using clean fuels [1], utilization of waste heat [2-6] and adopting different configurations [7,8], where resources and environment are conserved. Energy is of vital importance for the processes of production and manufacturing. Thus, a key element of sustainable development. Energy is the convertible currency of technology. The Wheels of technology are turned by the conversion of energy from one form into another. Currently trends in energy supply and use are generally unsustainable. Energy-related emissions of CO2 are predicted to more than double by 2050, and increased oil demand will heighten concerns over the security supplies. Figure 1 shows the percentage of the (primary) worldwide energy use provided by liquids, natural gas, coal, nuclear and renewables from 2005 through 2035. Renewables include solar and wind power, hydropower, geothermal power, tidal and wave power and biomass.

Figure 1: % of the World’s Energy Use by Fuel in 2005-2035 [10].
lupinepublishers-openaccess-journal-environmental-soil-sciences

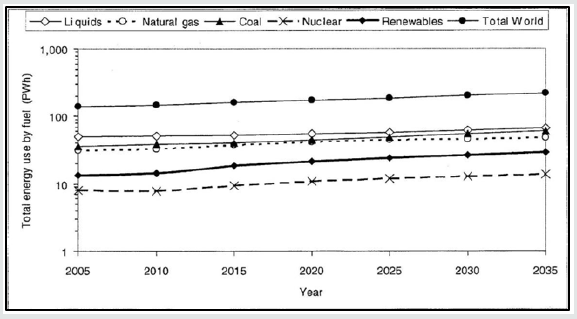
Liquids, natural gas and coal are collectively the “big three” fossil fuels that emit GHGs when converted to energy. They constitute about 81% of the worldwide primary energy. The actual amounts of energy used by source are shown in Figure 2 [9].

Figure 2: Total Annual Energy Use Worldwide by Fuel (1 PWh=1012 kWh) in 2005-2035 [10].
lupinepublishers-openaccess-journal-environmental-soil-sciences

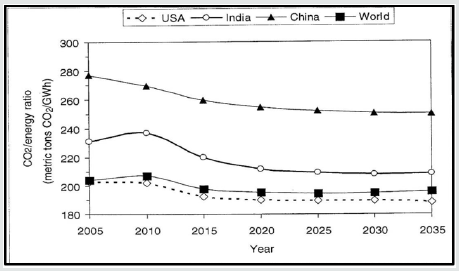
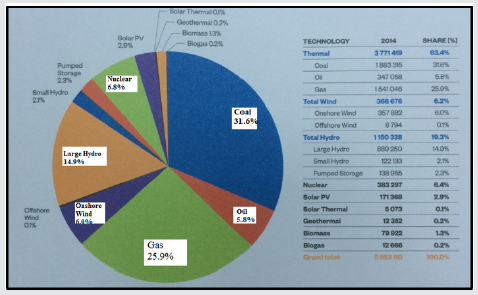
Figure 3 shows the importance in assessing the GHG nature of a regional economy, it’s given by CO2 / Energy Ratio (in metric tons of CO2 /GWh, GWh= 106 kWh) which Figure 4 shows the Global Market, Cumulative Installed capacity by Technology. There are certain “Green” favorites, such as solar, wind and biomass with limitations in capturing and storing, fluctuation, high cost, and being nonintensive. There are many exciting variants on nuclear power which face significant risks of cost overruns, limited investment, safety and health hazards. Petroleum and natural gas are currently the main sources of energy. But the combustion of these hydrocarbons contributes a large fraction of green-house gases and air pollutant emissions. The search for an alternative fuel that provides as much energy and is environmentally friendly has been a quest for quite sometimes [10].

Figure 3: Annual CO2 / Energy Ratio (in metric tons of CO2 /GWh, GWh= 106 kWh) in 2005-2035 for United States, India, China, and the World [10].
lupinepublishers-openaccess-journal-environmental-soil-sciences

Figure 4: The Global Market, Cumulative Installed capacity by Technology, MW.
lupinepublishers-openaccess-journal-environmental-soil-sciences

Energy Status

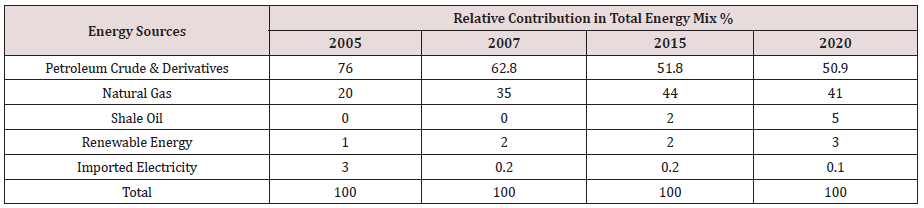
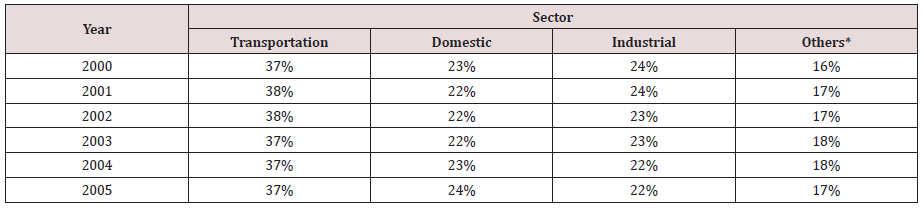
Unfortunately, some countries import almost all of its energy needs. In view of the increasing burden imposed by energy imports, it is critical for them to look for indigenous sources of energy. Switch to new, highly efficient and environmentally superior energy technologies, is highly desirable. Relative contribution of energy sources in the total energy mix over the period (2005-2020) is show in Table 1, for a typical developing country. The typical distribution of final energy (2000-2005) is shown in Table 2. Using energy has a direct impact on environment due to:

Table 1: Expected Contribution of Primary Energy Sources in Total Energy Mix (2005-2020).
lupinepublishers-openaccess-journal-environmental-soil-sciences

Table 2: Percentage Sector Distribution of Final Energy (2000-2005).
lupinepublishers-openaccess-journal-environmental-soil-sciences

a) Effluent gases [11].

b) Warming and climate change

Viable Technologies

Viable Technologies and Resources:

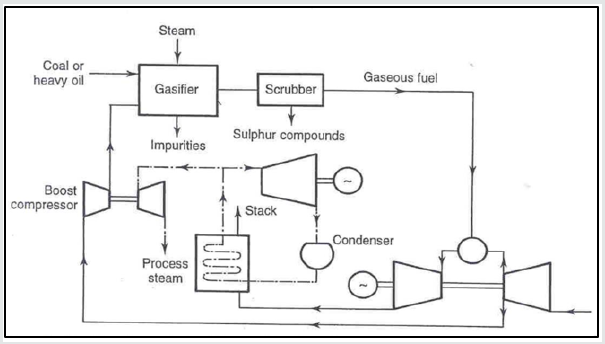
a) Combined cycles [12] and cogeneration (Figure 5) [13-21]

b) Energy conservation

c) Oil shale

d) Renewable energy

e) Nuclear power

f) Hydrogen and Fuel Cells

Figure 5: Gasification plant with combined cycle [24].
lupinepublishers-openaccess-journal-environmental-soil-sciences

Energy Conservation

Fossil fuels are at present, and will be for the following decades, the primary source of energy for satisfying the region’s energy demands. However, CCS already faces many challenges that are not only related to issues such as financing demonstration projects and integration of adequate infrastructure, but also to efficiency [22- 24]. For example, capturing and compressing CO2 would increase the fuel needs of a coal-fired powered plant by 25-40 percent. Therefore, efforts should be forwarded toward:

a) Utilizing higher power plant conversion efficiency (combined cycle).

b) Exploitation of low C/H content fuels, such as natural gas.

Oil Shale

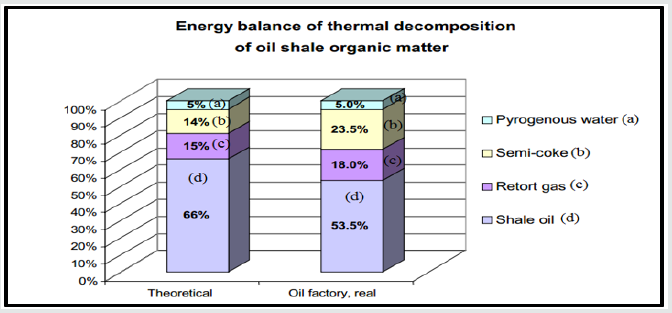
The rise of oil prices in the global market has increased the interest in production of oil from oil shale in Estonia and other countries as well. The greatest problem of shale oil production is the low thermal efficiency of the process [25]. Figure 6 shows the theoretical (retorting in standard Fischer Assay) energy balance of thermal decomposition of oil shale organic matter, as well as the real-life balance compiled based on the long-term experience of shale oil production with the solid heat carrier (SHC) method at the AS Narva Oil Plant Company [26]. Oil shale is a kerogen-rich fine-grained sedimentary rock and its abundant reserves are the second largest among all fossil fuels in the world if converted into heat [27-30].

Figure 6: Energy balance of thermal decomposition of oil shale organic matter. Theoretical means energy balance by retorting in standard Fischer Assay.
lupinepublishers-openaccess-journal-environmental-soil-sciences

Oil Shale needs more detailed studies that handle [31-33]:

a) Realistic quantification.

b) Appropriate Technology.

c) Economics of conversion.

Jordan contains 40 billion tons of oil Shale (30 years), Each ton oil shale contains 80-100 kg oil where Sulfur content about 4%. The heating value= ¼ HV of HC fuel, Hence one ton oil shale =0.025 ton of HC fuel but, it’s harmful to the environment(Open Pit Mining),results in barren land and it has a high consuming of water: one barrel oil needs one barrel water plus intensive energy consuming (In-situ retorting):3 barrels of oil need one barrel of fuel [34,35].

Renewable Energy

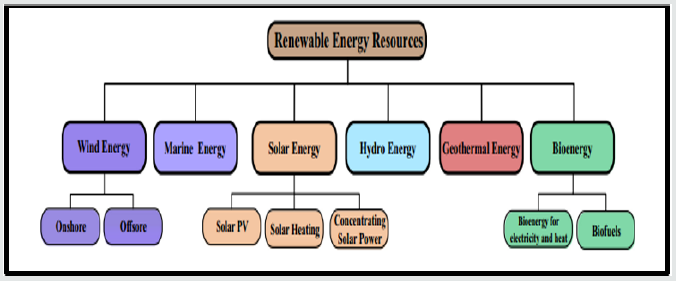
Figure 7: Overview of renewable energy resources.
lupinepublishers-openaccess-journal-environmental-soil-sciences

Renewable energies are sources of energy that are regenerated continually from nature and derived directly from the sun (such as thermal, photo-chemical, and photo-electric), indirectly from the sun (such as wind, hydropower, and photosynthetic energy stored in biomass), or from other natural movements and mechanisms of the environment (such as geothermal and tidal energy). Renewable energy does not include energy resources derived from fossil fuels, waste products from fossil sources, or waste products from inorganic sources [36]. Figure 7 shows an overview of renewable energy sources [37,38].

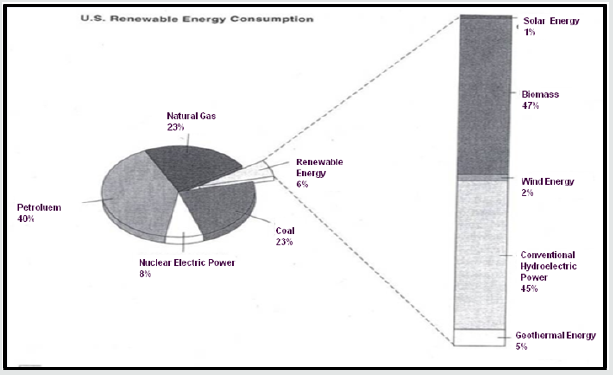
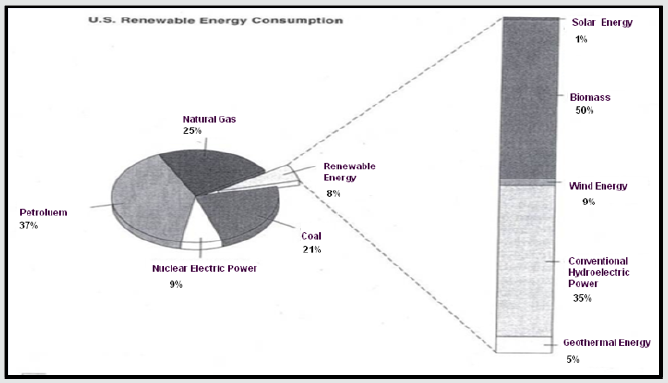
While it is true that renewable energy sources are environmentally friendly, or “green”, one has also to consider their feedstock. Solar, wind, hydro, biomass and geothermal energies are “free” at first glance, although they require huge land-use investments with environmental unfriendly footprints especially biomass. However, active research and development should continue until RE become competitive on all grounds, to increase their share in the total energy profile due to their own merits, not due to subsidies. Renewables account for 8% of the (world) and US national energy product as Figures 8 & 9. Most of this market is not due to symbolic renewables of wind and solar that dominates global discussion [39]. It is from biomass and hydroelectricity. It is also obvious that electricity from renewable energies has considerable problems in the way they are deployed today. First of all, and foremost, they are dependent on certain conditions (availability of wind, water and sunshine). Due to their intermittent nature, this deployment method is overstraining the grid, which is additionally rather inefficient in itself e.g. Germany. This not only requires improving the grid, but also making it “smart”.

Figure 8: U.S renewable energy consumption (by source) 2003. The generation of electricity accounts for about one-half of the renewable resources used.
lupinepublishers-openaccess-journal-environmental-soil-sciences

Figure 9: U.S renewable energy consumption (by source) 2003. The generation of electricity accounts for about one-half of the renewable resources used.
lupinepublishers-openaccess-journal-environmental-soil-sciences

Renewable Energy (RE) - Wind

At the end of 2008, the worldwide capacity of wind-powered generators added up to 121 GW, a mere of 1.5 percent of the world’s electricity usage. But the rapid growth continues, with China doubling its wind power capacity for the fifth consecutive year since 2004 [40]. The strongest growth will be biomass and wind towards (2035). The solar remains the perennial dark horse with tremendous but unproven potential. Intermittency of wind turns out to be a big problem for the grid-operating utilities, because electricity must be used as soon as it is produced. But how easily can be forecast when and where the wind will blow? You can’t simply start a wind mill up when you need it most. Thus, at least as the electricity grids are operated today, the intermittency of wind always requires backup systems (batteries) with an equal amount of dispatchable generation capacity. Unfortunately, at the moment these back-up systems are mostly conventional power plants that do not have short run-up times. In addition to the unpredictability of wind, wind farms usually need high investments to be built, and are also very expensive to properly maintain. At least 20 percent of the windmills are shut off for maintenance or repairs. What is even worse, they are often taken off the grid, because their electricity is not needed at that given moment [41,42]. There are no commercially viable ways to store wind energy at this time, other than pumping up water electrically in water reservoirs. But this only makes sense when wind farm and water reservoir are close to each other. Moreover, wind has noise emission, effect on animal species and birds. There are objections by the military: disturbing microwave lengths, radar and low-flying aircrafts [43-45].

Renewable Energy- Solar

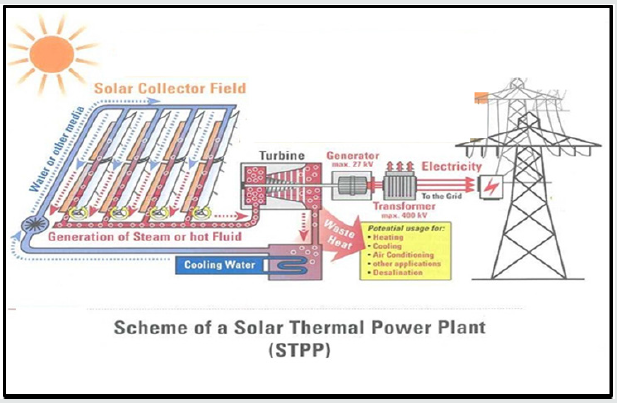
Figure 10: Scheme of Solar Thermal Power Plant (STPP)
lupinepublishers-openaccess-journal-environmental-soil-sciences

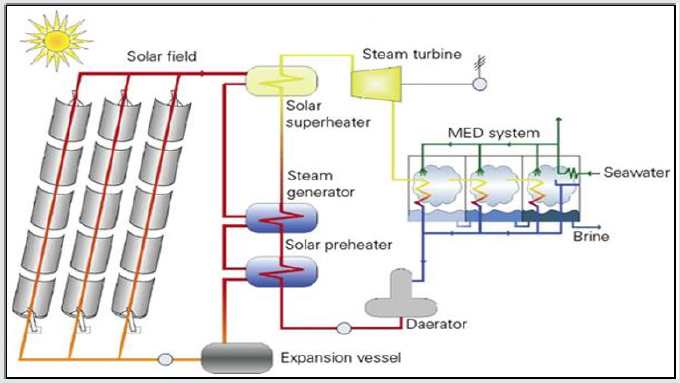
Figure 11: Solar parabolic trough power plant with oil steam generator and MED desalination.
lupinepublishers-openaccess-journal-environmental-soil-sciences

The amount of energy that comes from the sun is phenomenal: If we could somehow gather all the energy that reaches the earth on one day and store it, it would supply the energy needs of the whole world for almost 30 years. Moreover, solar radiation is actually the sole source for fossil or renewable energy that we use today. Electricity from sunlight can be generated directly using photovoltaic solar cells, or indirectly as with concentrating solar power [46-48]. Consider another interesting aspect: PV solar cells convert the sun’s radiation into DC power on which most of our appliances actually run [49]. But this power is converted into AC power by inverters and fed into the inefficient grid, only to be inverted again to DC [50]. At this point, the most cost-effective and efficient technology for converting solar power into electricity are huge solar-thermal power plants (Figures 10 & 11). Here, sunlight is gathered by a large solar-collecting field with parabolic mirrors, so called troughs. These collectors track the sun over the course of the day and concentrate the sunlight onto absorber pipes where the radiation is converted into heat. A heat transfer fluid which is circulating through the pipes is heated up to temperatures of almost 400⁰C [51,52]. The heat is used to generate vapor or steam with which electricity is then produced by conventional turbines. The process fluid or water is then cooled and returned to the cycle. The surplus heat could be used for heating, desalination, cooling, air conditioning, and other applications, but in most cases, it is currently rejected to the atmosphere. Solar-thermal power plants have been in commercial use for several decades since (1982). Thermal molten salt storage enables electricity production even during the night, or on cloudy days. The storage time, however, is estimated to be seven hours.

Water is mainly used for cooling the steam circuit, i.e. from the vaporization of water in the cooling towers (about 1 million tons water/y for 150 MW plant, 400 sq km). So, the plant operators not only have to capture the power of the sun, but also need immense amounts of water for cooling the heat transfer media. As most solar power plants today is located in deserts, this physical necessity may be an obstacle to development on the long run [53,54].

Nuclear Energy

There is now a plenty of uranium, that present reactors can supply energy for some hundreds of years, where fossil fuels are expected to run out in a few decades. So nuclear energy may be considered semi-sustainable.

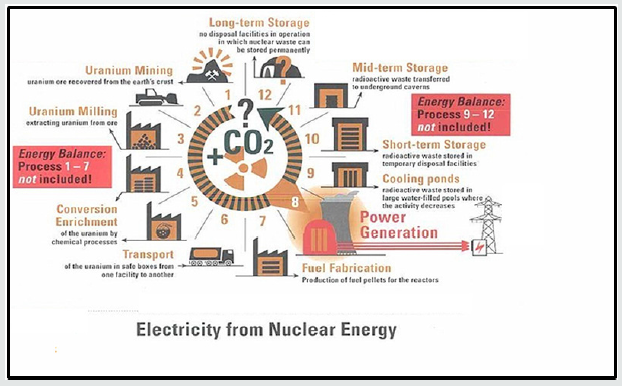
Using nuclear energy is assumed to limit the pollution with greenhouse gases in an efficient and cheap way. It is the only alternative to provide clean energy on a massive scale. However, nuclear energy has the problem of accidents and there is still no proper solution to store nuclear waste in a safe way [55]. Some consider nuclear power plants to be a “clean” electricity source, since the plants themselves do not directly emit CO2 and other GHGs. Nevertheless, the operation of nuclear power plants results in the immense environmental impacts which are displayed in Figure 12. After a cost intensive exploration process, uranium ore is recovered from the earth’s crust under quite difficult conditions. It must be extracted from the mined ore using strong acids and bases, and then be converted into either uranium dioxide (UO2 ) for heavy water reactors or gaseous uranium hexafluoride (UF6 ) for light water reactors [56].<.

Figure 12: Electricity from nuclear energy.
lupinepublishers-openaccess-journal-environmental-soil-sciences
Most reactors require uranium fuel to have a U-235 (an isotope of uranium) content of 3 to 5 percent. For this step, large amounts of electricity, mostly provided by fossil fuel plants, are needed to increase the actual concentration of 0.7 percent to 3 to 5 percent. Afterwards, the uranium is manufactured into fuel pellets by pressing powdered UO2 or UF6 into cylindrical shapes and baking them at high temperatures, usually between 1,600 and 1,700⁰C. Finally, energy is released in a reactor by controlled nuclear fission reactions just to boil water, produce steam and drive a turbine that generates electricity. This process alone has an efficiency of only 35 percent. For steam production and for cooling, approximately 2.5 times more water is needed for nuclear than is required for fossil fuel plants. This is the reason why nuclear power plants are located at rivers or lakes. In 2008, KIKK German committee reported a 60% increase in solid cancer incidence and a 120% increase in Leukemia incidence among children living within 5 km of all German nuclear power stations [57]. In essence, this suggests that doses to embryos/fetuses in pregnant women from environmental emissions from nuclear power plants (NPPs) may be larger than suspected. It is now officially accepted in Germany that children living near nuclear power plants develop cancer and leukemia more frequently than those living further away [58].

After the nuclear fuel is consumed in the reaction process, it is removed from the reactor and stored on site in large water-filled pools for about five years. Later, the radioactive waste is transferred to underground caverns for medium-term storage. At present, there are no safe disposal facilities in operation anywhere in the world which can accept radioactive waste for permanent storage [59]. In a radioactive waste disposal facility since the seventies, the storage has recently been found to be unstable. According to World Nuclear News, roughly 126,000 barrels filled with lowlevel radioactive waste including contaminated clothes, paper and equipment need to be brought to the surface for alternative storage [60,61]. A challenge involves approximately Euro 3.7 billion and a rather gracious heritage for future generation(s). We always need to keep in mind that already a minor failure in a nuclear power plant can create severe consequences for all forms of life on earth. Accordingly, decision makers should answer the question: How much “clean” a process like this that poses health risks exceeding that of any other process of electricity generation?

Hydrogen and Fuel Cells

The key criteria for an ideal alternative fuel are inexhaustibility, cleanliness, convenience, and independence from foreign control. H2 is considered as one of the most promising fuels for generalized use in the future. Mainly because it is versatile, energy-efficient, low-polluting, and a renewable fuel. Hydrogen is environmentally favorable replacement for gasoline, heating oil, natural gas, and other fuels in both transportation and industrial applications [62-65]. In nature, mostly the hydrogen is bound to either oxygen or carbon atoms. Hence, to obtain hydrogen from natural compounds, energy expenditure is needed [66-71]. Therefore, hydrogen is considered as an energy carrier a means to store and transmit energy derived from a primary energy source. Presently hydrogen is mainly used in production of gasoline, fertilizers and metals. However, hydrogen requires energy to produce, store and distribute. Hence, hydrogen technologies need to be developed to reach the stage of competing with fossil fuels and other alternatives to produce power [72-75]. These technologies should emphasize efficient systems to reduce energy losses, and emissions. Among high efficiency technologies, fuel cells appear to be the most promising with high efficiency and very low environmental impact. Fuel cells are able to convert the fuel chemical energy into electricity, heat and water by reverse electrolysis. This leads to much higher conversion efficiency [76].

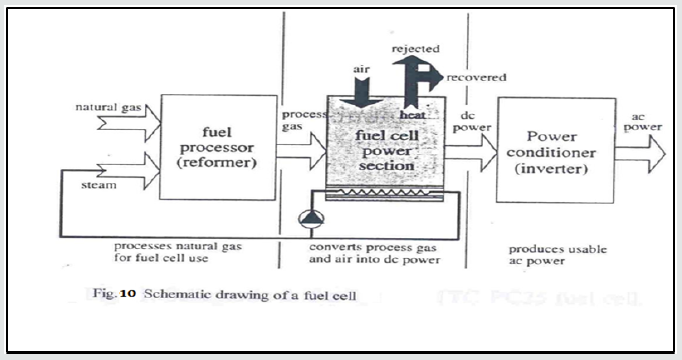
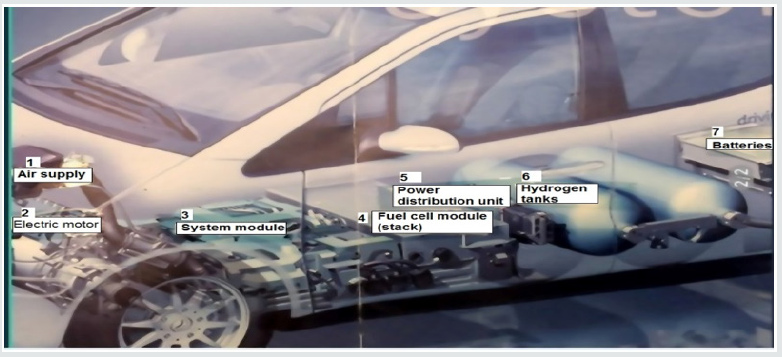
Fuel cells can convert the fuel chemical energy into electricity, heat and water by reverse electrolysis, Figure 13. This leads to much higher conversion efficiency. Both considerable primary energies saving and pollutant reduction, are achieved by upgrading conventional systems to fuel cell hybrid plants, Figure 13. Oil is essential in the transport sector while natural gas will become a more dominant fuel in power generation. Hydrogen economy is expected to offer considerable opportunities. Fuel cell development is an important step to the efficient use of hydrogen hence, research must continue in this area, Figure 14. The preferable solution is to produce H2 from sustainable sources such as, wind energy, solar energy, waterpower or biomass. However, these energies will not be able to provide a massive contribution to meeting the energy demand for many decades to come: Environmental reasons (large scale tolerance of wind energy), practical reasons (availability of surfaces), economic reasons (cost of photovoltaic energy) and technological reasons (storage of intermittent energies) [77]. Hence, the fuel cell is seen to be the most efficient energy converter in the near future, using H2 . However, it still has major problems, such as: Reducing the cost of fuel cells by a factor of 90%; enhancing the performance and durability of fuel cell systems by a factor of 2, and reducing the H2 production and distribution costs by a factor of 3 productions from water is not efficient [78].

Figure 13: Schematic drawing of a fuel cell.
lupinepublishers-openaccess-journal-environmental-soil-sciences

Figure 14: Vehicle with fuel cell and hydrogen gas.
lupinepublishers-openaccess-journal-environmental-soil-sciences

Energy Efficiency

Energy efficiency is a convenient technology to be adopted by the developing countries. Energy conservation implies reductions in the consumption of energy, such as (turning thermostats down) [79]. Consuming less energy results in protection of the environment and preventing climate change through forcing people to make sacrifices in comfort, pleasure and convenience. Efficiency implies obtaining more useful heat, or work from each unit of energy supplied, either by technological improvements or reducing waste. Consuming less energy results in protection of the environment and preventing climate change through forcing people to make sacrifices in comfort, pleasure and convenience [80]. Hence, Energy efficiency could be described in three ways: Less energy for the same benefit (conservation), the same energy for a greater benefit and more energy for an even greater benefit. Only the first description of energy efficiency is sustainable. The second does not lower gross energy use, and the third increases it [81]. If promoting energy efficiency, enhances the benefits of the end users, and does not reduce the impact of energy and environmental costs, this is not sustainable. Improved energy efficiency must lead to measurably less gross energy use (reduced use of fossil fuels) and polluting emissions. Improved “energy efficiency technology “involves much more efficient: motors, air conditioners, furnaces, direct and indirect water heaters and computers [82,83].

Variable speed drives and variable volume HVAC with direct digital control, energy management systems with optimal start, cogeneration and air-to-air heat pumps, reduce use of electricity and fuel in commercial buildings [84]. For transportation, to have lighter aluminum blocks, fuel injection, turbo charging, overhead cams, automatic speed controls, and using unleaded fuel with catalytic converters to reduce emissions. The bodies and frames of the cars need to become lighter, smaller and more unified. They are made lighter with plastics and fiberglass shaped into aerodynamic forms. Moreover, steel belted radial tires, front wheel drive, disk brakes with anti-lock features, light emitting diodes, all yields a better efficiency [85]. Interstate highway systems, speed limits legalized, carpooling, and most recently, the internet, email, and telecommuting reduced gasoline consumption and improved energy efficiency. In Power industry: combined cycles, cogeneration systems, trigeneration: of power, heating and cooling enhance energy efficiency. One-third of the oil used in most countries is used in transportation, by passenger cars and light trucks. The overall fuel efficiency of vehicles could be increased by improvements primarily in aerodynamics, materials, and electronic control [86].

The most fuel-efficient cars are compact with small engines, manual transmission, low frontal area, front wheel drive and reduced vehicle weight. Radial tires usually reduce the fuel consumption by 5 to 10 percent by reducing the rolling resistance.

i. Before driving:

a) Using fuel with the recommended minimum octane number; not overfilling the gas tank.

b) Parking in the garage.

c) Starting the car properly and avoid extended idling.

d) Not carrying unnecessary weight in the vehicle.

e) Keeping tires inflated and the wheels aligned.

ii. While driving:

Avoiding quick starts and sudden stops:

a) Driving at moderate speeds.

b) Maintaining a constant speed; avoiding sudden acceleration and sudden braking; avoiding resting feet on the clutch or brake pedal while driving.

Using highest gear (overdrive) during highway driving; turning the engine off rather than letting it idle; and using the air conditioner sparingly. Regular maintenance improves performance, increases gas mileage, lowers repair costs, extends engine life and reduces air polluting [87].

Innovations in Energy Systems

The automobile industry and the associate industries that serve as the base of the world’s economy and employ the greatest share of the working population. They have played a significant role in the growth of modern society by satisfying the need for mobility in everyday life [88]. Presently, all vehicles rely on the combustion of hydrocarbon (HC) fuels to derive the energy necessary for their propulsion. Recent European green car initiatives are concentrating on advanced internal combustion engine (ICE) research with emphasis on:

a) new combustion techniques such as stratification with direct injection in gasoline engines,

b) using alternative fuels (bio-methane, ethanol, hydrogen etc.),

c) intelligent control systems,

d) mild hybridization and

e) special tires for low rolling resistance [89].

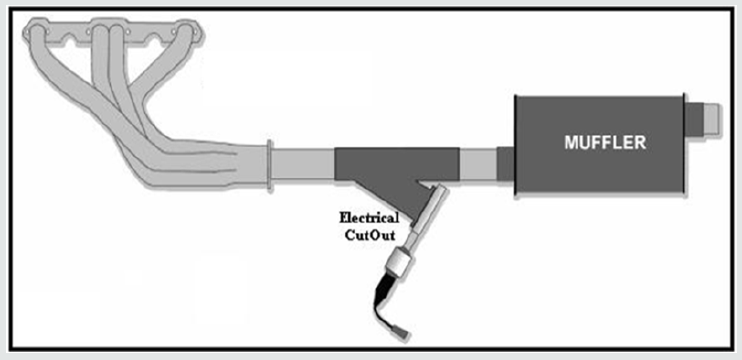
A smart Controller for improving fuel economy in vehicles was adapted with fuel saving ~ 11% ) (Figure 15). Considering recent fuel prices, a country of (6M people)can save: 60.0 M JD/y. The Environment is saved proportionally, from CO2 , Figure 3.

Figure 15: Smart device in vehicles for better control of efficiency.
lupinepublishers-openaccess-journal-environmental-soil-sciences

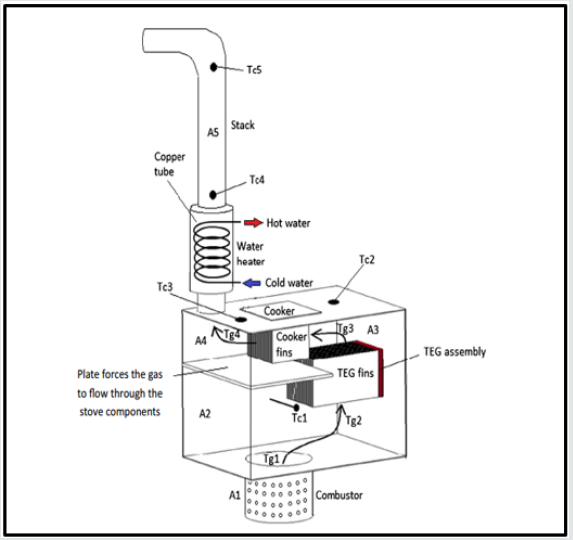
1.3 billion People – about 20% of the worldwide population – are still without access to electricity, almost all of whom live in developing countries [90]. Providing a minimum amount of electricity can actuate the basic needs such as light, radio and some medical electronic devices. Thus, making a lot of difference in their lives. TEG coupled to the stove can be a very interesting option to provide such amount of electricity. TEG is a device that harvests waste energy and converts some of it to useful power. It operates on a fundamental principle termed the See beck effect which states: when a temperature gradient is established between two different metals or semiconductors, a corresponding voltage gradient is induced. This causes a continuous current to flow through a complete circuit. The major advantage of a TE generator in this case is requiring almost no maintenance, since there are no moving parts. Only the battery needs to be charged when needed. The TE generator works day and night in clear or rainy weather unlike solar panels. Moreover, the battery does not need to be oversized. On the other hand, there are some challenges involved in using the thermoelectric generators. Mainly the low efficiency of the technology itself is below about 10% [91] and the high price of the TEG models. The low efficiency problem may be solved by new technologies evolved over time. The price will decrease with more adoption of such systems. Figure 16 shows a typical TE stoves which offers multitasks simultaneously such as: Space heating, cooking, heating water and generating electricity for basic needs. Moreover, generation of water is planned in the near future [92].

Figure 16: Cross sectional view of the JUST stove [92]. Where: Tg1: Gas temperature at position 1; Tc4: Thermocouple at position 4; Tg2: Gas temperature at position2; Tc5: Thermocouple at position 5; Tg3: Gas temperature at position 3; A1: Combustor zone; Tg4: Gas temperature at position 4; A2: After combustor zone; Tc1: Thermocouple at position 1; A3: After TEG fins zone; Tc2: Thermocouple at position 2. A4: After cooker zone; Tc3: Thermocouple at position 3; A5: The stack.
lupinepublishers-openaccess-journal-environmental-soil-sciences

Conclusion

Viable Technologies

Combined cycles, cogeneration, natural gas, fuel cells and energy efficiency: Contribute toward sustainability.

Power Generation:

Presently, concentration should be made on energy efficiency technologies. In the future, on fuel cells.

Oil Shale Needs

a) Realistic quantification

b) Appropriate technology

c) Economics of conversion: (requires huge amounts of fuel and water)

d) Genuine assessment of environmental impacts Renewable Energy

Green Favorites, although clean they have limitations in capturing and storing, fluctuation, high installation cost, and are non-intensive when converted. Active present and future research should proceed continuously, supported by all means possible, until RE become really competitive on all grounds, to share a progressively higher portion of the energy pie, with gradual replacement of fossil fuels.

Nuclear Energy

a) The nuclear energy has the problems of health hazards (during operation), storing waste, escalating initial cost, and accidents.

b) The risks of nuclear energy are too high for ourselves and the many generations to come.

c) Hence, the nuclear energy should not be an easy way for some policy makers to ensure enough energy in the future.

Hydrogen and Fuel Cells

More research and development should be concentrated on hydrogen. Mainly because it is versatile, energy-efficient, lowpolluting, and a renewable fuel.

a) A hydrogen car is safer than NG or gasoline car in collisions in open spaces.

b) But as safe as NG car and safer than gasoline or propane car in a tunnel collision.

c) However, H2 economy needs more efforts to reduce the cost of: FC, H2 production and distribution; plus, durability enhancement.

Energy Efficiency,

a) Energy efficiency is a convenient technology to be adopted by the developing countries.

b) Consuming less energy results in protection of the environment and preventing climate change.

c) Efficiency implies obtaining more useful heat, or work from each unit of energy supplied, either by technological improvements or reducing waste.

Innovations in Energy Systems

Innovations in energy systems should continue and more devices developed to enhance energy efficiency and sustainability

Acknowledgment

The author would like to thank Engineers Duaa MH Kharouf and Ahmad Abu-baker for the valuable help.

Read More About Lupine Publishers Journal of Environmental & Soil Science Please Click on Below Link:
https://lupine-environmental-soil-sciences.blogspot.com/

Friday, 17 March 2023

Lupine Publishers | Water Quality Assessment in Sindh, Pakistan: A Review

 Lupine Publishers | Journal of Environmental & Soil Sciences


Abstract

Increasing detrimental impacts of water pollution on environment and serious health issues, this review aims to investigate water quality status of Sindh, Pakistan.it also help us to determine current and future water demand of the province as well as adverse impact on human health in regards with water borne disease. To conclude, some recommendations are also outlined.

Keywords: Water borne disease; Quality assessment; Water supply; Water contamination; Sindh; Pakistan

Introduction

Although surplus amount of water is available on the planet of earth, but only small portion is available for human utilization. Overall population wholly depend upon the water sources mainly consist on groundwater and surface water. Currently, countries around the world are facing water pollution as well as water scarcity problems. Following the report of UN, the total populace increases exponentially while accessibility of water decline with time. WHO announced that by 2025, half of the total populace will live in water-stressed zones? Unfortunately, water pollution stresses the remaining small portion. During last decades, Urbanization and industrialization further added burden on water resources around the globe. Quality of water around the world has been deteriorated with chemicals discharged into water bodies directly and improper dumping of solid waste. According to Joint Monitoring Programme (JMP) report 2017 on “Progress on drinking water, sanitation and hygiene” 2.1 billion people lack access to safe drinking water at home. Globally, 448 million lack to have basic drinking water services from which 159 million individuals are those who rely upon surface water. According to speech of UNO secretory on world water day 2002, each year 5 million people died of water disease i.e.10 times more than people died in war. Furthermore, several studies have documented various contaminants such as organic (Pesticides), inorganic (heavy metals), minerals (arsenic and chromium) and microbial (pathogens) are responsible for water pollution. Recently, water contaminated with arsenic has been documented around the world, especially in Asian countries including Pakistan, Bangladesh, India, Cambodia, Vietnam, China, Taiwan, Hungary, Chile and Argentina [1-4].

Pakistan has been blessed by natural resources i.e. surface as well as groundwater resources. Sudden rise in population, industrialization and urbanization have brought huge stress on water resources of country. The country once has surplus amount of water is not including in water stressed zone. Most of the population belong to different cities of country rely upon groundwater for survival. While, current water supply is about 79% in Pakistan. Pakistan has experienced six noteworthy floods between 2000- 2015, which killed many people and posed negative impact on groundwater through salinization CRED [5]. Furthermore, Per capita availability of water has been decreased from 5,600 cubic meters in 1947 to 1,038 cubic meters in 2010. It is expected to decrease further to 575 cubic feet in 2050 [6,7]. In addition to this, quality of water resources has been declined due to intermixing of municipal sewage with water supply line and direct release of industrial wastewater into water bodies. Pollutants such as heavy metals, pathogens and other dangerous chemicals have been found in different regions of the country. Only 20% of the population have accessibility to safe drinking water while 80% is compelled to consume unsafe water for drinking. Each year 2.5 million deaths from endemic diarrheal disease has been reported [8-13]. Pakistan ranks 80th, out of 122 nations of the world, on the basis of water quality [14-16]. According to a Worldwide Fund for Nature (WWF) report titled, “Pakistan’s Waters at Risk”20-40% health centers are filled with the patients of water borne disease which include diarrhea, gastroenteritis, typhoid, cryptosporidium infections, giardiasis intestinal worms, and some strains of hepatitis [17].

Quality of drinking water in Sindh province is unfit like other provinces of Pakistan. Large portion of water available is contaminated with pathogens, chemicals and toxic materials. Several studies have documented that the four major contaminants are responsible for water quality deterioration in Sindh i.e.69% bacteria, 24% arsenic, 14% nitrate and 5% fluoride. According to the report of Inquiry commission appointed by Supreme Court of Pakistan “78.1 % of all water sample tested were found unsafe for drinking”. The aim of this review is to analyses the status of water quality in different divisions of Sindh, Pakistan. It also describes the impacts of water quality on human health as well as outline some recommendations.

Study Area

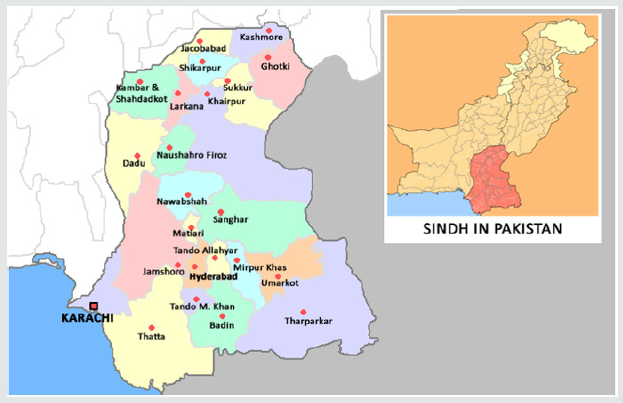
Sindh is second most populated province (Figure 1) with population of 30.44 million situated in south-eastern part of Pakistan. It is stretched from 66°8’ East Longitude to 71°, lies between 24°4›N to 28°7’N and covers about 46,569 miles2 . Province is bounded by the Thar Desert to east, the Kirthar Mountains to the west, and the Arabian Sea in the south. It is divided into six divisions namely Karachi, Hyderabad, Sukkur, Shaheed Benazirabad, Mirpurkhas and Larkana. Karachi i.e. the capital of Sindh province ranked at the top with 14.91 million and Hyderabad ranked the 8th most populated with 1.73 million population among the list of 10 most populated cities of Pakistan. Large number of populations of the province depend upon the fresh water for domestic and irrigation purpose. Indus basin is the major source of water provision in the area. In Sindh Province, only 10 % of land area had availability of fresh groundwater and occurs in shallow aquifers [18]. Following high average annual temperatures, semi-arid climate, sea water intrusion and high rate of evapotranspiration shallow aquifers are highly saline [19]. Irrigated land i.e. almost 78% of the province rely on saline groundwater which is not fit for irrigation. As the ground water is saline in most areas, rural population is also depending on supplies from the canal system. According to the survey conducted by Pakistan Council of Research in Water Resources (PCRWR) in 22 districts of Sindh province out of 1247 surveyed water supply schemes only 529 (42%) were functional with average duration supply of 5 hrs/day. From which only 25% water samples were fit for drinking while remaining are contaminated with microorganisms and arsenic.

Figure 1: Map of Study Area (Sindh Pakistan). Source: Modified from (Sindhidunya 2015).

lupinepublishers-openaccess-journal-environmental-soil-sciences

Current Demand and Future Requirement of Sindh

In next 20 years, Province will undergo demographic change. Current population of 33 million is expected to increase to 52.6 million and urbanization will increase from 50% to 64% in 2025. Currently, Karachi’s demand for water supply is about 1,220 MGD against which has an allocation of 34,000 l/s (1,200 cusecs) from the Indus water which is expected to increase 65,460 l/s (2,320 cusecs), with increased population to about 23 million in 2025. Likewise, water demand for other urban cities will also increase which will put burden on water resources. In addition to this, rural population of about 18.8 million will need an additional about 7,125 l/s (250 cusecs) for drinking purposes. Hence, total municipal water requirement of the province in 2025 will be of the order of 94,000 l/s (about 3.300 cusecs). Besides municipal water requirement, water requirements for agriculture would also increase by about 50%. Current water use is about 52.6 Bm3 (42.6 MAF) which means an additional 26.3 Bm3 (about 21.3 MAF) required to meet the future demand of agriculture products (FAO).

Water Quality

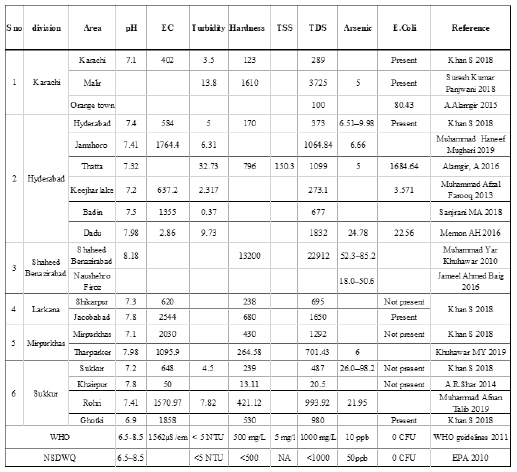
Alarming increase in population is the single important driving force affecting the water sector and cause water scarcity problem in the province. Water pollution is another major problem which is deteriorating the quality of remaining small portion of water. According to Director General of Sindh Environmental Agency Baqa Ullah Unar “every day almost 500 million gallons of industrial waste and human consumption falls into Arabian Sea”. 80% samples from 14 different districts of Sindh are not safe for drinking as well as 78% of water used in hospitals is above standard limits. 90% of water had bacterial contamination and not fit for drinking in Karachi only (PCRWR). Several studies have been conducted in different cities of Sindh, Pakistan (Table 1) [20-29].

Table 1: Water quality in different districts of Sindh, Pakistan [20-29].

lupinepublishers-openaccess-journal-environmental-soil-sciences

Abdul Hussain Shar [30] analysed the samples from Rohri for the presence of total coliform (TC), E. coli (Ec) and heterotrophic plate count (HPC) which result the contamination of all samples with TC (100%), Ec (41.6%) and with HPC (100%). In Hyderabad bacteriological tests on drinking water has been conducted by PCRWR found that 15 monitored sources as unfit for drinking mainly due to bacteriological contamination (93pc), excessive levels of iron (47pc) and turbidity (93pc). Mashiatullah [31] carried out a study on Malir and Lyari rivers, he analysed different Physiochemical and biological parameters. The coliform contamination i.e.156-542 per 100 ml in high tide and 132- 974 per 100 ml in low tide were observed which exceeded WHO guidelines. Aziz et al. [32] reported a study for drinking water quality in Pakistan including both urban and rural areas which results that total coliform and fecal coliform were 150–2400/100 ml and 15–460/100 ml respectively. The investigation reported the presence of anthropogenic activities which resulted.

Mahmood et al. [33] measured the physical, chemical and microbiological parameters for the different groundwater samples collected from Thatta in pre-monsoon and post-monsoon seasons, respectively. It was observed that concentration of heavy metals were; As (0.0045 to 0.0055 mg/l), Cd (0.15-0.22 mg/L), Zn (0.040 to 0.046 mg/l), Pb (1.40-1.49 mg/l) and Cu (0.001- 0.87 mg/L) in both the seasons and were in order of Pb > Cu > Cd > Zn > As in premonsoon and Pb> Cd > Cu > Zn > As in post- monsoon respectively. Other parameters Electrical conductivity (233-987 μs/cm), pH (6.9-8.9), TDS (161.1-690.9 ppm), Temperature (24-33°C), chloride (81.79-131.78 ppm), total hardness as CaCO3 (124.40-188.81 ppm), nitrate (2.10-5.20 ppm) were within prescribed standard limits. Some common diseases were found to be nausea, vomiting and kidney damage.

Suresh Kumar Panjwani [34] collected Thirty-five groundwater samples and analysed for 22 different parameters including physicochemical parameters and bacteriological contamination. Three drinking water samples (9%) contain Fluoride as 1.83 mg/l to 0.44 mg/l which exceeds WHO limits. Two water samples (5%) were contaminated with nitrate–nitrogen i.e. 23.61 mg/l to 0.97 mg/l. (45%) 16 water samples were contaminated with E. coli ranges from 01-too numerous to count CFU/ml exceeding the prescribed limit by WHO (0/100ml). None of the drinking water samples (0%) were found bacteriological safe for drinking purpose. In 2014, another study examined water quality in Thatta, Karachi and Hyderabad found presence of heavy metals that exceeded the WHO drinking water guidelines [35].

Outbreak of Water Borne Disease

Improper treatment and dumping of waste in water bodies accounted for rise in water borne disease. Deteriorated quality of water in Sindh province had badly affected the human health. More than 20,000 children die annually in Karachi only, from which majority of deaths caused by drinking contaminated water. Outbreak of water borne disease have been noticed in different parts of Sindh including typhoid, cholera and diarrhea. According to Zahid J [36] areas surrounded by poor households, children with mothers married in early ages, children having small size at birth and ages less than 24 months and children belonging to uneducated mothers are found most vulnerable where prevalence of diarrhea found non-ignorable. In Sindh, Tando Allahyar (46%), Matiati (50%), Hyderabad(44%), Badin (40%), Mirpur Khas (40%) Karachi East (40%) and Karachi South (52%) have highest rate of cases while lowest rate found in children from rich house holds’ of Larakana (6%) and Jacobabad (8%). In some areas including Gadap, Kathore and coastal areas 30-35% of people have been found infected with viral hepatitis. While 20-25% of the population is infected with the deadly viral disease said by Dr Shahid Ahmed, consultant gastroenterologist and patron of the PGLDS on World Digestive Health Day 2018 (WDHD 18).

Recently, a drug-resistant typhoid strain identified first in Hyderabad, spread from the city to various parts of the country. 5,274 cases of XDR typhoid have been reported by Provincial Disease Surveillance and Response Unit (PDSRU) from 1 November 2016 through 9 December 2018.69 % (3658) of cases were reported in Karachi only, following 27% (1405) in Hyderabad, and 4% (211) in other districts of the province. On 9th July 2017, outbreak of acute watery diarrhea and abdominal pain in village Mir Khan Otho, District Shaheed Benazirabad were reported to the DG Health Office Sindh in Hyderabad. A total of 30 cases were identified (22 through active case finding) and n=16 (53.7%) were females. Mean age was 25.3 years (range: 1-50 years). Overall attack rate was 23%. People aged 21-30 years were the most affected (n=10; AR 43.5%). Apart from diarrhea, abdominal cramps (n=28; 93%) was the most common symptom. On bivariate analysis, consumption of water from the hand-pump near the swamp was significantly associated with the disease (OR=8.4, 95% CI: 3.1-22.7) [37].

In 2016, 22,000children have been hospitalized and more than 190 have died in Tharparkar district due to drought-related waterborne and viral diseases. According to the Joint UN Needs Assessment, water scarcity has been severely affected several districts (62% in Jamshoro and 100% in Tharparkar) which resulted in reduced harvest by 34-53% and livestock by 48% UNICEF [38]. According to local media, the total under- 5 deaths were rising from 173 in 2011, 188 in 2012, 234 in 2013, 326 in 2014, and 398 in 2015. According to the provincial health secretary, 450 children lost their lives in 2017, 479 died in 2016 and 398 in 2015 while reasons for the deaths vary. Furthermore, According to authorities in Tharparkar district, Sindh province, 99 children and 67 adults (43 men and 24 women) have reportedly died in Tharparkar since the beginning of 2014 as well as an outbreak of sheep pox occurred which has killed thousands of small animals (Pakistan: Drought - 2014-2017) [39]. Furthermore, three months after floods began in Pakistan, 99 cases of cholera were reported from across the floodaffected areas of the country (WHO).

In 1994, first ever case of dengue has been reported in Pakistan, sudden rise in cases first occurred in Karachi in November 2005. Since 2010, Pakistan has been encountering dengue fever that has caused 16 580 affirmed cases and 257 deaths in Lahore only also about 5000 cases and 60 death confirmed from other parts of the country (WHO) [40]. The three provinces have faced the epidemic are Khyber Pakhtunkhwa, Punjab and Sindh. In Sindh province, 2088 dengue positive cases had been reported as well as two people had died of dengue in Karachi city in 2018. Currently, according to the weekly report issued by Prevention and Control Programmed for Dengue (PCPD) in Sindh, from January 1 to January 7, 2019 a total of 38 dengue positive cases were detected. From which 36 were reported in Karachi only while two were in other districts of Sindh (PPI).

Contamination Sources

Climate Change

For water resources, climate change is a long term and unmitigated risk. Water demands is expected to increase up by 5 percent to 15 percent by 2047 due to climatic change. In the upper Indus Basin, climate change will increase the risk of flood outbreak by accelerate glacial melting while in the lower Indus Basin, sea level rise and increases intensity of coastal storms also exacerbate seawater intrusion into the delta and into coastal groundwater. Furthermore, in coastal Sindh, groundwater quality will further be deteriorated and also impact the ecosystems, and irrigation productivity of the province. In addition to this, Sediment dynamics in the Indus sourcing, transport, and deposition have been significantly altered by water resources development. Past floods in Pakistan not only posed physical damage but also affected human lives in terms of flood-related death and illness as well as clean water and sanitation facilities. The flood destroyed 54.8% of homes and caused 86.8% households to move, with 46.9% living in an IDP camp. Lack of electricity increased from 18.8% to 32.9% (p = 0.000), lack of toilet facilities from 29.0% to 40.4% (p=0.000). Access to protected water remained unchanged (96.8%); however, the sources changed (p=0.000) [41].

Since 2013, Tharparkar has been influenced by a drought‐like circumstance affecting employments, nourishment and wellbeing conditions. In south-eastern Sindh, low rain fall throughout 2016 in districts including Tharparkar, Umerkot and Sanghar sharply reduced the cereal production also causes loss of small animals due to diseases and severe shortages of fodder and water. Moreover, it has aggravated food insecurity and caused acute malnutrition [42].

Poor Water Supply and Sanitation

USAID reported that in Pakistan about 60% of the total number of child mortality cases are caused by water and sanitation-related diseases. Pakistan Strategic Environmental Assessment of the World Bank, 2006 stated that about 2,000 mgd of wastewater is discharged to surface water bodies in Pakistan. 13,000 tons of municipal waste daily generated in Karachi only, following 3,581 in Hyderabad while 48 million tons a year around the country. Water and sanitation sector have the highest financial cost to Pakistan from environmental degradation at Rs112bn a year as reported by WB. This is based on health cost of only diarrhea and typhoid and accounts for 1.81 per cent of the GDP. While figures for Sindh are not available. According to the media (The news) “More than 50 per cent of the people were suffering from diseases related to water and sanitation due to the lack of proper sanitation in the Sindh province” speakers told on‘ World Toilet Day with the 2018 theme ‘Toilets and Nature, the Pathway to Neat and Clean Sindh’. In Karachi, 42 percent of the city’s total population have no access to a proper toilet and appropriate sanitation system and live in 539 slums. Furthermore, Karachi Metropolitan Corporation and Cantonment boards have public toilets at only 13 places.

Poor Water Management

According to Rubina Jaffri, the general manager of Health and Nutrition Development Society (Hands), only 440 MGD is being filtered out of 640 MGD of water supplied to Karachiat seven filtration plants. A recent survey accounted that 40% water samples collected from different parts of Karachi were not properly chlorinated. In Karachi, long transmission route also causes leakages and water thefts problems which account for the loss of almost 30% of the city’s water supply, said by Jawed Shamim, former chief engineer at KWSB (The Karachi Water and Sewerage Board).Moreover, Parallel water supply and sewage pipes currently lead to cross contamination and corrosion. Chief Minister Syed Murad Ali Shah, in Sindh there were 2,109 water filtration plants, including 1,620 RO plants, and 818 of them were non-functional. He also added that there were 5,091 water supply and drainage schemes and 2,494 of them were non-functional and 244 of them had been abandoned (PPI).

Agriculture sector consumes up to 90% of the available fresh water of the country. About 70% of the canal water is lost from river to the end user. The larger portion of canal water (35%) is wasted at field level which needs proper attention of the policy makers. furthermore, 30 MAF is equal to 10 trillion gallons which can feed a population of more than 500 million people has been dumped into Arabian sea instead of storage. Problem is the absence of efficient conservation, storage and usage of water [43-50].

Recommendations

a) Basic filtrations units and 24 hours water quality monitoring stations should be established

b) Proper usage, efficient storage and conservation strategies are utmost practices to deal with water scarcity problem

c) Rearranging of water supply line to deal mixing of municipal sewage into water supply

d) Latest and technical irrigation strategies to use water efficiently such as drip irrigation and sprinkling.

e) Proper waste management system and treatment of industrial effluent should strictly implement

f) Institutional capacity management in order to operate and maintain the water supply schemes

g) Proper design of water distribution network to deal with the water loss.

h) Education on the water conservation and utilization practice should be provided to people by arranging seminars and utilizing media

i) Water thief and corrupted people should be deal according to law and regulations

j) Construction of new water reservoirs and proper check in balance on old ones to enhance storage capability by resolving siltation problem

k) Encouragement of new polices and proper implementation as well as check in balance

l) Awareness campaign should be encouraged about water quality and water borne disease

m) Basic health care and relief facilities should be provided at doorsteps when needed to reduce death related to water borne disease

n) Involvement of community to reduce water pollution by providing basic knowledge and changing lifestyle.

o) Proper check in balance on water filtration plants to provide safe drinking water to communities.

p) Mitigation strategies to improve the response to climate change-induced effects on health and agriculture

Conclusion

Conclusively, water quality status of Sindh Pakistan has been reviewed. Most of the water in different areas of the province is contaminated with bacteria which causes outbreak of waterborne disease including, diarrhea, cholera, hepatitis and typhoid in many cities and caused millions of deaths simultaneously. Arsenic is the second hazardous chemical found in water of Sindh mostly in coastal areas. Fluoride and nitrite are other metal which pose threat to human lives in Sindh Pakistan. Thus, many policies have been established and many schemes were organized by provincial government to deal with the water crisis but still some gaps related to implementation exist that needs to be executed. Moreover, new reservoirs and flow distribution line should be constructed to deal with water scarcity and water loss problem of the province.

Read More About Lupine Publishers Journal of Environmental & Soil Sciences Please Click on Below Link:
https://lupine-environmental-soil-sciences.blogspot.com/
Friday, 14 October 2022

Lupine Publishers | Evaluating the Potential of Narrow-Band Indices to Predict Soybean (Glycine Max L. Merr) Grain Yield in The Free State and Mpumalanga of South Africa

 Lupine Publishers | Journal of Environmental & Soil Sciences


Abstract

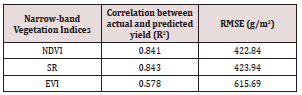
Yield predictions allow for decision making regarding management of agricultural yield before and after harvest by government and decision-makers. Traditional approaches to collect yield statistics such as manual field surveys and physical computation of yield are costly and take a long time for information to be available. Remote sensing platforms such as hyperspectral data provide real-time, fast, and reliable statistics that can be used to derive yield information. Vegetation indices are ratios used to combine multiple band observations of the hyperspectral data into one index and applied to derive soybean grain yield. The objective of this study was to evaluate the potential of vegetation indices derived from hyperspectral data to predict soybean grain yield. Soybean hyperspectral data was acquired using a handheld spectroradiometer with a spectral range of 350 to 2500 nm in March and April of the summer season of 2017. The random forest regression algorithm was used to predict the soybean grain yield. NDVI, SR and EVI were calculated from the hyperspectral data for all probable bands situated in the 400 nm and 2399 regions. The results showed that relevant wavelengths in predicting soybean were combinations situated in the red-edge (680-750 nm), NIR and the MIR (1300 to 2399 nm) of the electromagnetic spectrum. Furthermore, regression results showed that SR better predicted the soybean grain yield (R2 = 0.843) compared to NDVI (R2 = 0.841) and EVI (R2 = 0.537). In overall, the results of this study suggest that narrow-band indices have the potential to predict soybean grain yield.

Keywords: Soybean Yield; Hyperspectral Data; Vegetation Indices

Abbreviations: NDVI: Normalised Difference Vegetation Index; SR: Simple Ratio; EVI: Enhanced Vegetation Index; RF: Random Forest; RMSE: Root Mean Square Error; FS: Free State; MP: Mpumalanga

Introduction

South Africa is the third dominant consumer of soybean in the world [1]. Mpumalanga, KwaZulu Natal and Free State provinces are the largest soybean producers in the country [2]. Over the last decade, soybean production and consumption in South Africa has increased [1,3]. Currently, soybean production does not meet South African local demands [3]. As a result, South Africa imports large quantities of soybean products [3]. Attaining higher yields entails increasing the area planted and/or use of more fertilisers [4]. Production in both approaches requires constant crop monitoring using reliable techniques that can provide real-time statistics. Constant monitoring of crops can enhance chances of attaining higher yield through early detection of problems that can potentially affect yield. Soybean yield information in the hands of farmers and policy makers is important for decisions such as planning for harvesting, yield management and market related decisions [5]. Thus, there is a need for an efficient real-time monitoring system to provide the status, growth and development of soybean information consistently that can enable yield predictions.

Various methods have been used to predict grain crop yields and these include the use of agricultural censuses, field surveys [6] and physical computation of yields by visiting numerous sample areas [7]. In South Africa, current yield predictions are based upon field surveys conducted telephonically, via emails, and or by post FAO [8]. However prediction methods based on traditional crop yields surveys are frequently subjective, susceptible to large inaccuracies and take a long time for information to be available for the benefit of food security and early planning before and during harvests [5]. In addition, yield predictions obtained influence the pricing of agricultural commodities and the decisions to be taken regarding imports and exports [8]. This therefore validates the need for crop monitoring initiatives that involve the use of reliable techniques such as remote sensing to ensure fair pricing of agricultural commodities and objective decision-making. Remote sensing methods are suitable; they include the acquisition of crop canopy measurements [9], and can deliver immediate, reliable, measurable evaluations of the ability of plants to capture radiation and photosynthesize [10]. These canopy spectral measurements are beneficial for estimating crop yield [9]. Research shows that remote sensing spectral bands have strong relationships with vegetation biomass [11].

Many researchers have used broadband multispectral data to predict yield of various crops such as maize [12], rice [5], soybean [10] and wheat [13,14]. Broadband multispectral data have advantages as it is applicable to regional areas and also because of numerous revisits of the same area as well as capturing data at large spatial scales in real-time [15]. In addition, multispectral data is available at low or no cost, which can be beneficial to countries with limited resources [15]. Despite these advantages, broadband data has drawbacks for vegetation observation such as exhibiting excessive spectral differences and shadows due to the above-ground coverage and landscape [11]. The latter can be a hindrance in producing precise biomass prediction models with the ability to distinguish between soil background and vegetation [11]. Precise biomass predictions are essential for effective monitoring and management of vegetation [11]. Furthermore, broadband data does not have specific narrow-bands that precisely focus on biochemical and biophysical factors of crops [16,17]. This suggests that multispectral broadband data exhibit difficulties in monitoring

crops with high biomass such as soybean. Although multispectral broadband data have these disadvantages, research has shown that these disadvantages can be overcome by the use of vegetation indices [18]. Vegetation indices eliminate differences caused by soil background, above-ground geometry, sun view angles as well as the influence of atmospheric circumstances when assessing biophysical characteristics of vegetation at aboveground scale [18]. Widely used vegetation indices for vegetation monitoring and modelling are calculated using the red and the near infrared (NIR) bands [19]. The red and NIR bands respond to the biochemical and biophysical properties of crops [16,19]. These spectral bands are sensitive to the rate of photosynthetic activity in green vegetation [20]. The Normalised Difference Vegetation Index (NDVI) [21] and Simple Ratio (SR) [22] are commonly utilised indices that are calculated using the NIR and the red bands [20] with applications for crop monitoring. Soybean has been monitored using NDVI modelled from broadband data sets such as AVHRR/NOAA [23,24] and ADAR 5500 4 band digital camera with a broadband width of 450 nm to 90 nm [25]. [26] used SR, NDVI, Soil Adjusted Vegetation Index (SAVI) and Transformed SAVI (TSAVI) to evaluate soybean biophysical properties such as yield, photosynthetically active radiation (PAR), leaf area index (LAI) and biomass [26]. Also, the SR index is known to be able to decrease the effect of soil background on the spectral reflectance and is also sensitive to changes occurring at prime developmental phases of vegetation [27]. The Enhanced Vegetation Index (EVI) is another widely used vegetation index in agricultural forecasting computed using the red and NIR bands with an addition of the blue band [28]. However, the EVI is insensitive to saturation when faced with high biomass vegetation [29]. Despite the usefulness of these spectral bands, broadband data is unresponsive to the variation in plant features [15].

Due to disadvantages encountered by broadband data, researchers promote the use of hyperspectral data that covers the whole range of the electromagnetic spectrum instead of just two or three bands [18]. Hyperspectral data provide advantages of handiness, flexibility, controllability and high temporal resolution, which are greatly beneficial in precision agriculture applications as opposed to satellite based platforms [30]. Also, hyperspectral data contains other important spectral bands such as the red edge bands that are useful in the study of vegetation [18]. The red edge band is highly responsive to variations in biomass of green vegetation [18]. Narrow bands are important for supplying more information with substantial enhancements compared to broad bands in enumerating biophysical properties of agricultural crops [17,31]. Also, hyperspectral data is important for modelling yield features of agricultural crops [17] such as chlorophyll content, photosynthetic activities and leaf structure [32]. Numerous researchers have used hyperspectral data for vegetation monitoring such as [17,18,31] with positive results. Mutanga and Skidmore [18] calculated NDVI from hyperspectral data and obtained that regular NDVI including strong chlorophyll absorption bands in the red region and NIR region inadequately predicted biomass (R2 =0.26). Whereas, the modified NDVI (MNDVI) that included bands in the range (700- 750 nm) and narrow-bands in the red-edge region (750-780 nm) showed a high predictive ability for biomass (R2 =0.77). Mariotto et al. [18] identified that important bands when modelling biophysical

properties of maize, wheat, cotton, rice and alfafa, (about 74% of them) are situated in the 1051-2331 nm regions. The remaining 30% of these bands are in the 970 nm region (10%), red-edge region (6%) and the visible region (10%) (Blue region (400-500nm), green region (501-600 nm) and NIR region (760-900 nm). Thenkabail et al. [31] concluded that stronger correlations with crop biophysical characteristics were situated in the red region (650-700 nm), shorter wavelengths of the green region (500-550 nm), the NIR region (900-940nm) and in the moisture sensitive area centred at 982 nm. Similarly, many researchers have used hyperspectral data to predict yield of agricultural crops such as lint [33], wheat [34], maize [35] and soybean [21]. However, for soybean [21] utilised spectral data acquired using a multispectral hand-held radiometer with a fewer number of bands. They obtained positive correlation between NDVI and soybean grain yield (R2 = 0.80). Research has shown that hyperspectral data has enabled estimation of yield of various crops and biomass of several vegetation types. However, soybean grain yield has not been predicted comprehensively using hyperspectral data in the spectral range of 400-2399 nm.

Hyperspectral data has however some limitations, such as those related to high dimensionality and redundancy [36] and the problem of multicollinearity [37]. As a result, identifying suitable bands for modelling is a challenging process. To overcome this problem researchers encourage the use of advanced statistical methods such as random forest (RF) regression algorithm [11]. Random forest is a regression algorithm that applies bootstrapping aggregation to create a group of trees based on the randomness of samples taken from the training data [38]. The random forest algorithm is known to be able to handle the high dimensionality of hyperspectral data and reduce data redundancy [37]. Also, random forest has been noted to perform better than other machine learning algorithms such as support vector machine and neural network because of its robustness against overfitting [11, 38-41]. The aim of this study was to evaluate the performance of narrow-band vegetation indices NDVI, SR and EVI derived from hyperspectral data in predicting soybean grain yield. The vegetation indices selected for the study are those frequently used for biomass or agricultural crop and ecological vegetation studies [18] and have been applied successfully in predicting other crops. The main objective of this study is to assess the relationships of narrow-band NDVI, SR and EVI to soybean grain yield. The second objective was to identify suitable narrow-band indices to predict soybean grain yield. The third objective was to compare the performance of NDVI, SR and EVI random forest models developed from narrow bands (400 nm to 2399 nm) in predicting soybean grain yield.

Materials and Methods

Study Sites

The research was conducted on two experimental farms located in the Free State Province of South Africa in Phuthaditjhaba (28°25’26”S and 28°56’12”E) and in the Mpumalanga province in Ermelo (26° 45’18” S and 30° 13’55” E) (Figure 1). The Free State and Mpumalanga provinces experience warm summers with high rainfall and cold winters. Both these areas receive approximately 625 mm of precipitation annually with most precipitation occurring in summer (October - March). The soil in Phuthaditjhaba can be characterised as “rich loam” type of soil [42] while the soil in Ermelo can be characterised as “low clay” [43] and sandy soil.

Figure 1: Map showing the location of the study sites in Free State (FS) and Mpumalanga (MP) provinces.

lupinepublishers-openaccess-journal-environmental-soil-sciences

Experimental Setup

The experiment on both sites followed a split plot Randomized Complete Block Design (RCBD) method. In the two study sites, 72 experimental plots each with a size of 7 m length and 3 m width were used. The plots consisted of 7 rows with 60 cm row spacing. Three soybean cultivars from Pannar seeds (PANN 1500 R, PANN 1614 R and PANN 1664 R) were sown from the 13th to 15th December 2016 in the MP and from 19th to 21st of December 2016 in FS site. Fertilizer treatments of 0 kg, 30 kg and 60 kg of phosphorus (P) were applied to the plots to provide more nutrients and enhance the health of the soybean plants. The experiment consisted of three replicates and the soybean relied on rainwater for irrigation.

Field Spectral Measurements

The first set of field spectral measurements in Mpumalanga and Free State were taken in March 2017 and the second set of spectral measurements were taken in April 2017. During this period, the soybean had reached maximum canopy cover whereby the soil background could have little effect on the spectral measurements. Due to differences in planting date, the soybean in Mpumalanga was in the pod formation stage during the first visit while in the Free State site it was still flowering. Canopy spectral measurements were acquired during flowering, pod formation and seed filling stages randomly plot by plot across fertilizer treatments of 0 kg, 30 kg and 60 kg. An Analytical Spectral Device (ASD) Field Spec®3 optical sensor (Analytical Spectral Devices, Inc., Boulder, CO, USA) was used to take spectral measurements from 10:00 am to 14:00 pm local time (GMT+2). The spectroradiometer records wavelength ranging from 350 to 2500 nm, measuring radiation at 1.4 nm bandwidths for the spectral region of 350-1000 nm and registers 2 nm intervals for the spectral region of 1001-2500 nm [44]. The spectral measurements

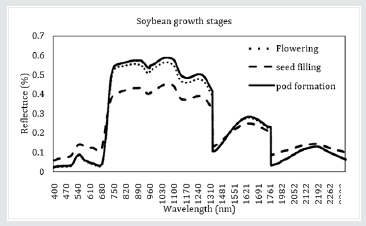
were taken under cloud free conditions. In each plot, 5 spectral measurements were taken with the optical cable connected to the spectroradiometer held at about 30 cm above the soybean canopy. Every 10 to 15 minutes a white reference spectralon calibration panel was used to balance any changes in the atmosphere and irradiance of the sun. The spectral measurements were added together to obtain the medial spectral measurements for each plot. Figure 2 shows average spectral reflectance of soybean at flowering, pod formation and seed filling stages. The spectral reflectance curve indicates the amount of radiation absorbed and reflected by the soybean at different regions of the spectrum. For soybean, the flowering and pod formation stages are critical stages in which the soybean utilises the absorbed radiation to photosynthesise and form grains [45]. A higher spectral signature is an indicator of a healthy crop in which higher yield can be expected whereas a low spectral signature indicates a lower yield [45].

Figure 2: Average spectral curves of soybean canopies at flowering, pod formation and seed filling stages.

lupinepublishers-openaccess-journal-environmental-soil-sciences

Soybean Yield Data

To obtain soybean grain yield data, the soybean pods were harvested from the middle 3 rows of each plot at the end of the growing season of May and June 2017. The soybean pods were then crushed to obtain the soybean grains. The soybean grains obtained from each plot were weighed using the LBK1 weighing scale from ADAM Equipment [46]. The grains measurements of specific plots for each site were added to obtain the total yield of the soybean of each site.

Data analysiss

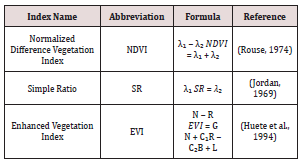
448 Bands allocated from 350 to 399 nm, 1350 to 1450 nm, 1800 to 1950 nm and 2400 to 2500 nm were omitted from the analysis due to atmospheric water absorption and the effect of noise in the reflectance spectra following techniques outlined in [11,36]. The remaining 1702 narrow-bands situated between 400 nm and 2399 nm were used to compute the narrow-band indices.The NDVI, SR and EVI indices were calculated using the standard indices equations [22, 28,47] (Table 1). These indices were calculated from all probable two-bands combinations including 1702 narrow bands situated between 400 and 2399 nm [11,18,19]. The narrow bands are presented as λ₁ (400-2399 nm) and λ₂ (400-2399 nm) combinations following approaches outlined in [18]. The calculated vegetation indices were correlated to the soybean yield using the Spearman’s correlation coefficient [2]. The correlations between vegetation indices and soybean grain yield were calculated to assess their relationship.

Table 1: Vegetation indices computed from the λ1 (400-2399 nm) and λ2 (400-2399 nm) combinations.

lupinepublishers-openaccess-journal-environmental-soil-sciences

Assessing the Differences in Yields between Study Sites and Fertilizer Treatments

Exploratory data analysis was performed to understand the data before any statistical analysis was done. The statistical analysis was performed in STATISTICA 13 software testing for normalcy of the data using Lilliefors test [48]. Furthermore, an analysis of variance was performed to determine if there were differences in soybean grain yield means between the two study sites and between the three fertilizer treatments.

Statistical Analysis Using the Random forest (RF) Regression

The random forest regression technique was used to predict the soybean grain yield. RF is a machine learning algorithm developed by Breiman [49] that applies a bootstrap aggregation method in which an ensemble of trees (ntree) are developed on the basis of the randomness of samples extracted from the training data. For regression, the random forest permits trees to grow to the highest magnitude without trimming, depending on the bootstrap sample from the training data [49]. At every tree, the RF grows a randomized subgroup of predictors (mtry) to identify the optimum split at every node of the tree [41]. At the end, the RF averages the outcome of the overall sum of trees in order to obtain the overall estimation [50]. From the bootstrap samples of the training data (2/3), each tree grows randomly and selected independently. The residual original data (1/3) of the excluded samples (called outof-bag (OOB)) are then used to validate the model and predict variables of importance [51,52].

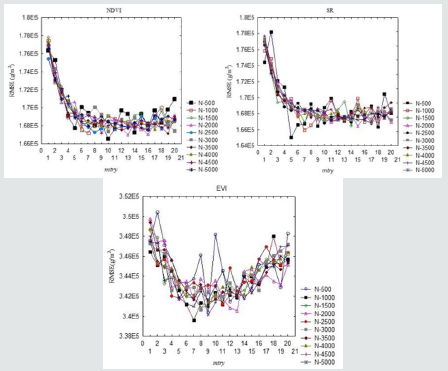
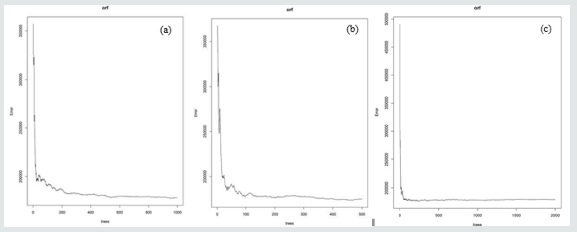
RF requires two parameters to be tuned that are (i) (ntree) the number of trees to grow and (ii) (mtry) the number of variables that are split at each node [41]. The ntree and the mtry parameters (vegetation indices) were then optimized for the random forest model using the top 20 NDVI, SR and EVI data sets to determine the best index that can be used to predict soybean grain yield. The mtry was calculated for all probable band combinations while the ntree was evaluated at 500, 1000, 1500, 2000, 2500, 3000, 3500, 4000, 4500, and 5000 trees. The random forest model was developed from 70% (2/3) of the training data to build a model that can predict soybean grain yield (g/m2 ) and 30% (1/3) of the test data was used to validate the model (OOB). Important indices at predicting soybean grain yield were selected by the RF using the permutation variable importance measures (mean decrease in accuracy). The RF algorithm was implemented using the R statistical software using the random Forest built in package to predict the soybean grain yield (Liaw and Wiener, 2002).

Variable Importance Selection

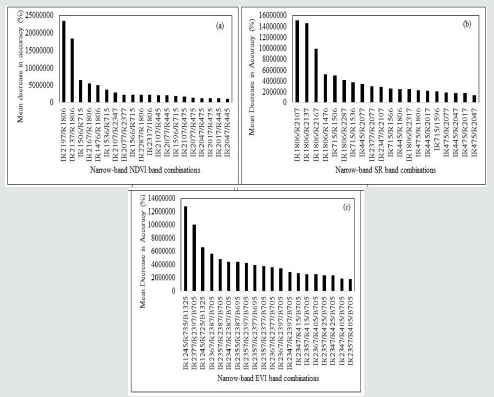
Random forest calculates variable importance using the Gini index and the permutation variable importance measures [53]. The permutation variable importance measure is defined as the variation between the OOB error from the data set acquired by random selection of the predictor variables and the OOB error from the original data set [53]. While the Gini index variable importance is a measure used in a classification when growing trees in the random forest [54]. The permutation variable importance measure is the most preferred measure of importance as it assesses importance of variables using the mean decrease in accuracy in the OOB predictions as forests are being assembled [53]. Permutation variable importance predicts the importance of a variable by determining how much prediction error rises when a variable is selected while others remain the same [55,56]. For this study, the permutation variable importance was used to determine the combination of indices that were powerful than the others in predicting soybean grain yield. From the ranking of the mean decrease in accuracy, the top 3 important combinations of indices were selected.

Accuracy Assessment

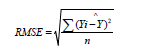
When using the random forest, research has shown that there is no need for a different test data for validation because the random forest uses an OOB error prediction built internally [37,38,50,57,58]. This is particularly remarkable in situations where data acquisition is highly dependent on oscillating weather conditions. The random forest computes the OOB error as a result of variance between the estimation made using the training data set and the OOB data set [41,59]. OOB error produces an unbiased evaluation of the prediction accuracy of the model [40]. The coefficient of determination (R2 ) and root mean square error (RMSE) were reported on the assessment of the accuracy of the random forest models. RMSE was calculated using the formula below:

lupinepublishers-openaccess-journal-environmental-soil-sciences

where Ŷ and Y are measured and predicted soybean grain yield respectively.

Results

Assessing the Differences in Soybean Yields between Study Sites and Fertilizer Treatments

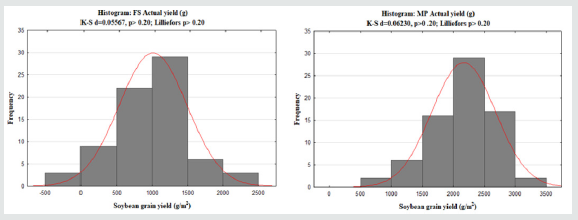
Exploratory statistics showed that soybean grain yield data does not significantly deviate away from a normal distribution for both sites (Figure 3) and thus meets the assumptions of ANOVA. Analysis of variance results showed that there were significant differences between the soybean grain yield in Free State and

Figure 3: Descriptive statistics of soybean grain yields for FS (a) and MP (b) sites.

lupinepublishers-openaccess-journal-environmental-soil-sciences

Mpumalanga provinces (p≤0.05). However, the results showed no significant differences in soybean grain yield between fertilizer treatments on the study sites (p≥0.05). The total soybean grain yield obtained in FS was 72816 g/m2 with an average of 1011.3 g/m2 per field while the total soybean grain yield in MP was 156060 g/m2 with an average of 2167.5 g/m2 per field. In total, the soybean grain yield of both sites was 228876 g/m2 with an average of 1589.4 g/m2.

Narrow-Band NDVI and SR Relationship to Soybean Grain Yield

Table 2: Top 20 narrow band NDVI indices (λ=30 nm) that produced the highest correlation coefficients with soybean grain yield.

lupinepublishers-openaccess-journal-environmental-soil-sciences

Narrow-band NDVI and SR were computed for all probable two-band combinations in the spectral range 400 nm to 2399 nm. Spearman’s correlation coefficients were applied to assess the relationships of the narrow-band NDVI and SR to soybean yields. The NDVI and SR obtained identical results of the correlations to the soybean grain yield (Tables 2 & 3). The correlation coefficients (R) results obtained between NDVI/SR and soybean grain yield ranged from 0.00 to 0.68 shown in Tables 2 & 3.

Table 3: Top 20 narrow band SR indices (λ=30 nm) that produced the highest correlation coefficients with soybean grain yield.

lupinepublishers-openaccess-journal-environmental-soil-sciences

Figures 4 & 5 depict a graphical presentation of the R-values for the relationship between soybean grain yield and NDVI and SR. These results show a moderate to strong relationship between NDVI/SR and the soybean grain yield (R-values from 0.588 to 0.688). In addition, the p-vales obtained for these results indicate that the relationships between soybean grain yield and the derived vegetation indices are significant as they are less that 0.05. Correlation coefficients of NDVI and SR were arranged in the order of the highest to the lowest and the top 20 R-values. The top 20 best NDVI/SR indices are situated in the blue (445 nm - 475 nm), rededge (715 nm) and in the MIR regions (1506 nm – 2377 nm) of the electromagnetic spectrum (Figures 4 & 5).

Figure 4: Heat map showing the correlation coefficients (R) between soybean grain yield and narrow band NDV acquired from all probable band combinations from the spectral range of 400 nm to 2399 nm.

lupinepublishers-openaccess-journal-environmental-soil-sciences

Figure 5: Heat map showing the correlation coefficients (R) between soybean grain yield and narrow band SR acquired from all probable band combinations from the spectral range of 400 nm to 2399 nm.

lupinepublishers-openaccess-journal-environmental-soil-sciences

Narrow-Band EVI Relationship to Soybean Grain Yield

Narrow-band EVI was computed from all probable band combinations in the spectral range of 400 to 2399 nm of the electromagnetic spectrum. Spearman’s correlation coefficients were calculated to assess the relationship between the EVI indices and the soybean grain yields. The correlation coefficient results of EVI indices ranged from 0.00 and 0.761. The relationship between soybean grain yield and the derived narrow- band EVI are significant as shown by the p-values less than 0.05 in Table 4. Correlation coefficients of the narrow-band EVI were ranked from the highest to the lowest and the top 20 best indices were selected and shown in Table 4. The best 20 EVIs are situated in the blue region (405 nm – 425 nm), red region (695 nm), red-edge ((705 nm- 735 nm) NIR (1245 nm) and the MIR (2357 nm– 2397 nm) regions of the electromagnetic spectrum.

Table 4: Top 20 narrow-band EVI indices (λ= 10 nm) that produced the highest correlation coefficients with soybean grain yield.

lupinepublishers-openaccess-journal-environmental-soil-sciences

Optimization of the Random Forest Regression Models

For the three indices (NDVI, SR and EVI), the ntree and mtry values were optimized using the training dataset to identify values that best predicted soybean grain yield. For each index, ntree values from 500 to 5000 were tested and mtry was tested from 1 to 20 (Figure 6). The mtry and ntree values that produced the best RMSE were selected. According to the results (Figure 2), the best mtry for the NDVI and SR models were 10 and 5 and their ntree was 500 respectively. For EVI, the best mtry was 7 and the ntree was 1000.

Figure 6: Optimization of random forest parameters (ntree (N) and mtry) using RMSE.

lupinepublishers-openaccess-journal-environmental-soil-sciences

Variable Importance of Narrow-Band Indices in Predicting Soybean Grain Yield Using the RF

From the best 20 selected indices that were highly correlated with the soybean grain yield, it was essential to categorize narrowband indices of NDVI, SR and EVI that would highly perform when predicting soybean grain yield (g/m2 ). The RF calculated variable importance using the mean decrease in accuracy to measure the importance of NDVI, SR and EVI at predicting soybean grain yield (g/m2 ). The RF algorithm was capable of ranking the NDVI (Figure 7a), SR (Figure 7b) and EVI (Figure 7c) indices according to their importance in predicting soybean grain yield.

Using the mean decrease in accuracy arrangement, top 3 wavelength combinations that had significant importance in predicting the soybean grain yield were selected. For NDVI, top 3 band combinations included:

(i) 2197 nm and 1806 nm,

(ii) 2137 nm and 1806 nm and

(iii) 1506 nm and 715 nm. similarly,

SR top 3 important wavelength combinations include

(i) 1806 nm and 2107 nm,

(ii) 1806 nm and 2137 nm and

(iii) 1806 nm and 2167 nm. In addition,

EVI top three significant wavelengths included

(i) 1245 nm, 735 nm and 1325 nm,

(ii) 2377 nm, 2397 nm and 705 nm and

(iii) 1245 nm, 725 nm and 1325 nm.

Figure 7: Mean Decrease in Accuracy (%) of NDVI (a), SR (b) and EVI (c) concluded by the random forest algorithm. Important variables ranked are those with the highest mean decrease accuracy.

lupinepublishers-openaccess-journal-environmental-soil-sciences

Accuracy Assessment

Figure 8: Random Forest models (NDVI (a), SR (b) and EVI (c)) showing sensitivity of ntree to the OOB error.

lupinepublishers-openaccess-journal-environmental-soil-sciences

Figure 8 shows the best ntree results of the RF models for NDVI (a), SR (b) and EVI (c). This indicates that for NDVI and SR, the models obtained accuracy at 500 trees and at 1000 trees for EVI. The coefficient of determination (R2 ) and Root Mean Square Error (RMSE) were statistical measures that were used to evaluate the predictive performance and accuracy of the random forest regression models (NDVI, SR and EVI). Table 5, shows the performance results of the random forest prediction models. The results show that SR obtained the highest R2 of 0.843 with a RMSE of SR= 423.94 and RMSE of NDVI=422.84 (26.11% of the average soybean grain yield) compared to NDVI that obtained R2 =0.841 with an RMSE of 423.94 (26.04% of the average soybean grain yield) and EVI (R2 = 0.578) (37.04% of the average soybean grain yield) and RMSE of 615.94. These results suggest that SR can better predict soybean, however NDVI obtained better accuracy in the prediction in comparison to SR and EVI.

Table 5: Predictive performance of the NDVI, SR and EVI random forest prediction models using top 20 best indices.

lupinepublishers-openaccess-journal-environmental-soil-sciences

Discussion

The aim of the study was to evaluate the potential of narrowband indices (NDVI, SR and EVI) in predicting soybean grain yield (g/m2 ). Broadly, the results of this study demonstrated that narrowband situated in the blue, red, red edge and MIR regions have a potential to predict soybean grain yield. The objectives were to assess the relationships of the narrow-band indices to the soybean grain yield, identify suitable narrow- band indices to predict soybean and to compare the accuracy of the prediction models. The study further showed that important bands in predicting soybean grain yield are not only bands in the NIR and red regions but also bands situated in the MIR region.

Assessment of the Relationships of Narrow-Band Indices to Soybean Grain Yield

The R-values obtained for NDVI (0.00-0.688), SR (0.00-0.688) and EVI (0.00-0.761) showed that different combinations of bands respond differently to variations in soybean grain yield. As shown in Tables 2-4, strong correlations to the soybean grain yield did not only consist of combinations of bands in the red and NIR regions. Strongly correlated indices of NDVI, SR and EVI to soybean consisted of combinations of bands in the blue region (405 nm - 475 nm), red region (695 nm), red edge (705-735 nm), NIR (1245 nm) and the MIR regions (1325 nm -2397 nm). These results correspond with those reported by Mutanga and Skidmore [18], which suggested that information on vegetation biomass is not only limited in the red and NIR bands. As a result, NDVI, SR and EVI highest correlations mainly consisted of combinations of bands in the MIR (1300-2399 nm) and combinations of the blue (400- 500 nm) bands and red-edge (700-729 nm) bands. The MIR region is known to be sensitive to water content of leaves and has low reflectance [32]. However, for this study, most MIR bands showed strong sensitivity to biochemical factors found in soybean such as nitrogen, protein as well as oil [32]. Similarly, wavelengths in the blue region are highly sensitive to chlorophyll a and b since plants absorb the violet-blue light for photosynthesis [32]. Based on these results it is understandable that combinations of these bands would obtain the highest correlation to the soybean grain yield. These results also concur with those reported by Darvishzadeh et al. [60,17]. Darvishzadeh et al. [60], showed that bands in the MIR had the strongest relationship to leaf area index (LAI) compared to the red and NIR bands. Mariotto et al. [17], reported that about 74% of bands sensitive to biophysical properties were situated in the MIR (1051 to 2331 nm). Additionally, the red-edge band is characterised by high reflectance and is linked to differences in the chlorophyll content that is associated with biomass of vegetation [18,32]. It is reasonable that combinations of wavelengths including the red- edge would obtain a strong relationship to soybean grain yield. Generally, these results provided more understanding of the relationship of the soybean grain yield and its significant wavelength regions. Furthermore, the results showed that important information on soybean yield is mostly contained in the MIR (1300 to 2399 nm) and indicate that narrow-bands have the potential to predict soybean grain yield.

Variable Importance and Assessment of the Predictive Performance of the NDVI, SR and EVI Random Forest Models

In the top 20 selected indices that had a strong relationship to soybean grain yield, it was necessary to identify which of those were significant in the prediction of soybean grain yield. The random forest used the mean decrease in accuracy measures to identify combinations of bands that are most significant in the prediction of soybean grain yield. The results of the optimization of the random forest showed that 10, 5, and 7 indices (NDVI, SR and EVI) out of 20 indices (predictors) at 500 and 1000 ntrees were significant at predicting soybean grain yield. These results further demonstrated that accuracy of the prediction was obtained with a smaller number of trees (ntree=500) compared to a larger number of trees (ntree = 1000). These results were validated by the differences in RMSE of 423.94 at 500 ntree compared to the RMSE = 615.69 at 1000 ntree. The obtained results concur with those of Abdel-Rahman et al. [41] who suggested that fewer number of trees (ntree) results in lower RMSE, which indicates better accuracy. The R2 results of the NDVI, SR and EVI random forest models showed that SR obtained the highest R2 in predicting soybean grain yield. These results indicate that, compared to the NDVI and EVI, SR is a better index at predicting soybean grain yield. These findings are similar to those obtained by Mutanga and Skidmore [18] who in their study concluded that SR (R2 =0.80) was a better index at predicting biomass in dense canopies than NDVI and Transformed Vegetation Index (TVI). Higher performance of SR could be because of its high sensitivity to high biomass as compared to NDVI which saturates when faced with high biomass [61,62]. Although the SR obtained the highest R2 , the NDVI obtained the lowest RMSE of 422.84 compared to SR (RMSE=423.94) and EVI (RMSE=615.69). These findings indicate that NDVI has better accuracy at predicting soybean yield since a lower RMSE indicates better accuracy. In conclusion, these results suggest that both the SR and NDVI can accurately predict soybean grain yield.

Conclusion

This study shows the success of narrow-band indices in predicting soybean grain yield. The results have shown that important narrow-bands in predicting soybean grain yield are not only combinations of bands situated in the red (695 nm) and the NIR (1245 nm) regions but are also combinations of bands found in the blue region (405 nm - 475 nm), red edge (705 nm -735 nm) and the MIR regions (1325 nm -2397) nm. Furthermore, the SR index (R2 = 0.843) proved to be a better index in predicting soybean grain yield compared to the NDVI (R2 = 0.841) and EVI (R2 = 0.578).

Acknowledgement

We acknowledge the Agricultural Research Council (ARC), the National Research Foundation (NRF) and the University of the Free State for the financial support for this study. We thank the Soil Science division in ARC that allowed us to collect soybean reflectance data from their experimental farms. Thank you to Dr Solomon Newete and Eric Economon for their assistance in acquiring spectral reflectance data.

Read More About Lupine Publishers Journal of Environmental & Soil Sciences Please Click on Below Link:
https://lupine-environmental-soil-sciences.blogspot.com/