Lupine Publishers| Current Trends on Biostatistics & Biometrics (CTBB)
Abstract
On the example of the table of contents of eight essential amino acids in 22 products, the methodology of factor analysis and determination of the coefficient of correlation variation, calculated as the ratio of the sum of the correlation coefficients of stable laws and laws of binary relations between amino acids to the product of the number of amino acids as influencing variables and as dependent indicators. It is shown that this evaluation criterion depends on the composition of the products and the set of amino acids considered. Therefore, it is proposed to make a more complete table considering the set of objects, which considers the content of all 20 amino acids. The law of binary relations between amino acids is the sum of the exponential law and the biotechnical law of stress excitation in the product. By correlation coefficients of individual binary relations, the ratings of amino acids as influencing variables and as dependent indicators are performed. The correlation matrix of super strong bonds of essential amino acids with correlation coefficients of more than 0.99 is considered, in part of which the graphs are given. By the nature of behavior, it is proposed to classify the binary relationships between amino acids into positive, neutral and negative. Separately, the method of rating products. The equations and graphs of rank distributions of the content of essential amino acids in products are given. The rating of essential amino acids by dispersion of residues from the equations of binary relations and rank distributions is given.
Keywords: Amino Acids; Products; Factor Analysis; Regularities; Correlation Coefficients; Coefficient of A Correlative Variation
Introduction
Under the expression correlative variation Charles Darwin understands that the whole organization is internally connected during growth and development, and when weak variations occur in one part and are cumulated by natural selection, the other parts are modified. Modifications in the structure recognized by taxonomists for a very important, can depend solely on the laws of variation and correlation [1]. For example, Phyto enosis [2] has at least three fundamental properties: first, the correlative variation in the values of parameters in time and space; second, the correlation depends on the genotypic properties of the plant species; third, the variation is due to phenotypic properties, as well as the cycles of solar activity [3], the rotation of the moon around the Earth and our planet around itself [4].
In accordance with the correlative variation of Charles Darwin, during the growth and development of the body, significant changes in the initial age will lead to changes in the structure and in the adult creature. Therefore, people, taking, and thereby enhancing some feature of, almost, probably, unintentionally modifying other parts of the body based on the mysterious laws of correlation [1]. Any non-investigative variation is insignificant for us. But the number and variety of hereditary deviations in the structure, both minor and very important in physiological terms, is infinite. All things are things, properties and relations [5], and in the bios relations control things and change their structures. The purpose of the article is to show the laws and regularities of the correlative variation of the content of eight essential amino acids in a set of 22 products.
The Concept of Correlative Variation
Variability [1] is usually associated with the living conditions that the species has been subjected to for several successive generations. In General, according to Darwin, there are two factors: the nature of the body (most important factor) and the properties of existing conditions [1]. Thus, we adopted the basic hypothesis that typing, and the classification has no effect on biotech based on mastery of life laws. Therefore, the variation (the set of deviations from the Darwin correlation) depends on the human factor, i.e. on the quality of measurements of soil properties and plants [4,6]. Soil according to V.V. Dokuchaev [7] is a living organism. Therefore, the principle of Darwin’s correlative variation should provide high adequacy of the revealed regularities [6]. Similarly, a priori we will consider experiments with essential amino acids [8] to measure their concentration in different types of products for humans and animals highly correlative.
From the concept of correlative variation of Charles Darwin, which was not understood by mathematicians and was not developed by biologists, it clearly follows that in other conditions of the habitat other combinations of values of factors may be stronger (Darwin calls factors hereditary deviations). Therefore, weak factor connections may be stronger for other combinations of the studied objects. As a result, there is a mathematical tool [9- 12] (identification method) for comparison of different natural and artificial (technical) objects [13]. The coefficient of correlative variation is considered for many factors of the physical object of study, that is, biological, chemical, technological, socio-economic, etc. It is equal to the ratio of the total sum of the correlation coefficients to the square of the number of factors for the complete table model (or to the product of the number of factors and). The type of the system under study does not affect this criterion, and the correlation variation depends entirely on the internal properties of the system under study. The coefficient of correlative variation is calculated by the formula

where
K – the coefficient of correlative variation of the set of factors or parameters characterizing the system under study,
ΣΣr – the total sum of the correlation coefficients for the rows and columns of the correlation matrix of the relationships between the factors,
N – number of factors to consider in the symmetric table,
Nx, Ny – the number of factors on the axes x and y .
Functional connectivity is a universal property of matter. For example, internal correlation variation is observed in the results of agrochemical analysis of soil samples [6], as all agrochemical parameters are measured on the same sample. Sampling sites do not affect the internal connectivity of biochemical and other reactions, that is, the same interactions between chemical elements and their compounds are observed on Earth. Such a community is called an ecosystem [2] or a biosphere superposition. The strongest correlative variation over 0.999 is observed in the set of genes [13- 15]. Slightly less, but more than 0.99, as will be shown in this article, such a variation exists in the group of essential amino acids.
Essential Amino Acids
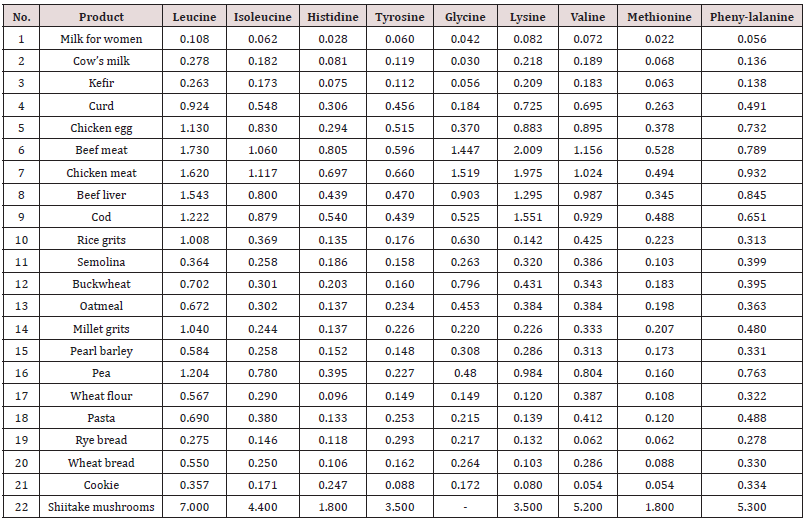
These are essential amino acids for animals that cannot be synthesized in the body, in particular, human. Therefore, their intake from food is necessary (Table 1).
Table 1: The content of essential amino acids in products [1] (grams per 100 grams of product), We have included in the list of products №22 «Shiitake mushrooms».

Rating of Influencing and Dependent Factors
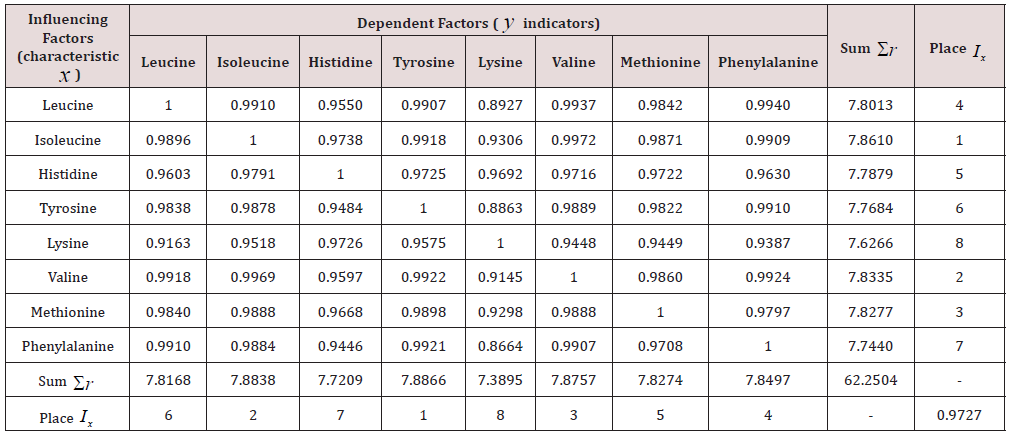
To determine the coefficient of correlative variation of nine amino acids among 22 types of products it is necessary to conduct a factor analysis [9]. Due to the absence of a measured value of glycine content in one cell of Table 1 in the row Shiitaki mushrooms, factor analysis was first carried out [9, pp. 82-83, table. 3.30] nine factors and 21 products. The coefficient of correlative variation was equal to 0.9985. All binary 92– 9 = 72 relations are characterized by the exponential law. Table 2 shows the correlation matrix of binary relationships and the rating of eight factors excluding glycine for 22 products according to Table 1.
Table 2: Correlation matrix of factor analysis without glycine and rating of factors in identification by the exponential law.

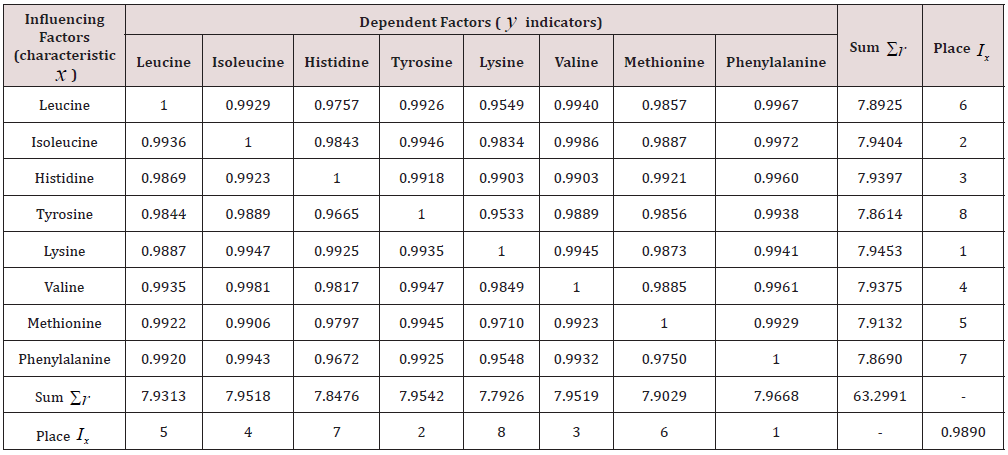
Table 3: Correlation matrix of factor analysis without glycine and rating of factors in identification by exponential and biotechnical law.

The coefficient of correlative variation is 0.9727, which is significantly less than 0.9985. In the future, it turned out that in addition to the indicative law, the biotechnical law [4,6,9-15] of the stress excitation of amino acids depending on each other is additionally considered (Table 3). With the coefficient of correlative variation 0.9890 in the first place among the influencing variables was lysine, and among the indicators -phenylalanine. Thus, the correlative variation is very sensitive to the composition of amino acids and products. This fact in the future will reveal the rational compositions, structures and functions of amino acids in different systems under study.
The Law of the Relationship Between Amino Acids
It is expressed by an equation of the form

where y- amino acid content in the product as an indicator (g per 100 g of product),
x- amino acid content of the product as an influencing variable (g per 100 g of product),
a1..... a6 - the parameters of the model (2) taking the numerical values in the course of structural-parametric identification in the software environment CurveExpert-1.40. Formula (2) shows three types of stress-induced amino acids under the influence of each other: positive, neutral and negative. Neutral type appears only without shiitake mushrooms, that is, when the amino acid content changes from 0 to 2 (maximum 2.009 for beef). The maximum concentrations of nine amino acids without shiitaki mushrooms are in two products-beef and chicken meat. In the amino acid content range from 2 to 7 in Table 1 there are no types of products (except mushrooms). Therefore, it is necessary to add new products to the list and Table 1.
In the concentration range from 0 to 7, two types of behavior appear:
- positive behavior, with a positive sign in front of the second component of the formula (2), when with increasing content of the influencing amino acid, the content of the dependent amino acid increases according to the biotechnical law of stress excitation;
- negative behavior, with a negative sign, when the content of the dependent amino acid is inhibited from the action of the wagging amino acid. These two types provide optima for the interaction of essential amino acids.
Conclusion
We have extended the principle of correlative variation not only to Charles Darwin organisms, but also to populations (in the article population of eight amino acids) and even to any biological, biotechnical and technical systems [13]. This principle allows to compare heterogeneous systems on one or some set of factors by functional connectivity. The coefficient of correlative variation, as a generalized criterion for comparing different sets of homogeneous biological objects, gets a very high value. For example, populations of genes [14,15] obtained the correlative coefficient of variation not less than 0.9999. In the example of this article, the level of adequacy for the set of eight essential amino acids is not less than 0.99. This makes it possible in the future to create the most complete table of contents and other indicators for a system of 20 amino acids and hundreds of objects, including products. Functional connectivity between essential amino acids was super strong and it is subject to a simple formula of two-term trend containing exponential and biotechnical laws. The absence of the second term determines the neutral type of behavior, and signs in the presence of the second member characterize the positive (+) or negative (-) type of behavior of amino acids in the studied system of products. To identify the effect of oscillatory adaptation of essential amino acids to each other in some sets of products need more accurate (with measurement error, less than an order of magnitude) data.
Read More About Lupine Publishers Current Trends on Biostatistics & Biometrics (CTBB) Please Click on Below Link: https://lupine-publishers-biostatistics.blogspot.com/


No comments:
Post a Comment
Note: only a member of this blog may post a comment.