Increases in oil and gas drilling have resulted in large quantities
of oil base "mud" (OBM) to be disposed of. Land application of OBM to
agricultural land is a common disposal technique that presents agronomic
and environmental challenges since the material is rich in total
petroleum hydrocarbons (TPH). Leaching of lower molecular weight
hydrocarbons, mainly benzene, toluene, ethylbenzene, and xylene (BTEX),
is a concern due to their relatively low octanol: water partition
coefficients. The objective of this study was to determine the effect of
rainfall regime and TPH loading rate on TPH degradation and BTEX
leaching after OBM application. An OBM was characterized for TPH, BTEX,
and trace metals. A soil column study was conducted where OBM was
applied at five loading rates (0, 22,000, 45,000, 67,000, and 90,000 kg
TPH ha-1) and was subjected to four moisture regimes. OBM
samples were taken at day 0, 7, 30, 60, and 91 to monitor TPH
degradation. Leachate samples were taken at day 0, 14, 28, 35, 49, 56,
63, 77, and 84 to monitor electrical conductivity (EC), pH, metal
concentrations, and BTEX concentrations. After 60 days, a maximum TPH
degradation of 35% was measured. Leachate BTEX concentrations increased
as TPH application rate increased and was mostly undetectable by day 28.
Leachate EC increased over time and with increasing TPH rates. TPH rate
had no effect on leachate pH. OBM loading rates had the greatest effect
on TPH degradation and BTEX leaching. Under our experimental
conditions, little risk of BTEX leaching from land applied OBM was
observed.
Abbrevations: OBM: Oil-Base Mud; TPH: Total
Petroleum-Based Hydrocarbons; BTEX: Benzene, Toluene, Ethylbenzene, and
Xylene; OCC: Oklahoma Corporation Commission (OCC); EC: Electrical
Conductivity
Introduction
Currently, the United States is experiencing a boom in oil and gas
drilling. In 2013, there were approximately 910,000 and 4,900 onshore
and offshore oil and natural gas wells, respectively, that produced
nearly 16 million m3 of oil and 665 billion m3 of
natural gas [1]. When drilling activity increases, an increase in the
production of drilling wastes result, specifically drilling fluids and
drill cuttings (i.e. "mud"). A study conducted by the American Petroleum
Institute in 1995 estimated that around 150 million barrels of drilling
wastes were generated on-shore in the United States alone [2]. In the
oil and gas industry, drilling mud is utilized to help cool the drill
bit, maintain borehole pressure, and aid in bringing drill cuttings to
the surface where the fluids and cuttings can then be separated [3].
Drilling muds are composed of a base liquid (water or diesel fuel) with
other potential additives such as bentonite, barium sulfate, cotton seed
hulls, and calcium hydroxide, which may be used for specific drilling
conditions [4]. When diesel fuel is the base solution for drilling mud,
the mud is called "oil base mud" (OBM). OBM is typically utilized when
drilling depths exceed 1500 m or during horizontal drilling. OBM is
re-used by drillers for as long as possible due to the high cost of
production.
Once the OBM is spent and can no longer be used in drilling, it must be properly disposed of. On average, 340 m3
of OBM are produced from a typical southeastern Oklahoma natural gas
well at depths ranging from4200-5200 m deep [5]. Some of the products
added to the mud may be harmful, and therefore need to be properly
handled [6]. Hence, there are two options for mud disposal: land
application and burial. Burial of the waste can occur onsite in "reserve
pits" or at commercial facilities. In general, onsite reserve pits are
only allowed for water-base mud, not OBM. Land application is the most
common method of OBM disposal in Oklahoma. The purpose of land applying
OBM is to allow soil microorganisms to degrade petroleum hydrocarbons
(i.e. "total petroleum hydrocarbons"; TPH). In Oklahoma, regulations for
the land application of OBM are controlled by the Oklahoma Corporation
Commission (OCC). OBM land application rates are limited based on
loading of TPH, chlorides, and solids (Oklahoma administrative code and
register, Title 165:10-7-26). Furthermore, the OCC requires that OBM be
mixed with a bulking material such as lime or gypsum, at a ratio of 3:1
OBM: bulking material. Although TPH is taken into account when applying
OBM, there is still a potential for the over-application of low
molecular weight hydrocarbons: benzene, toluene, ethylbenzene, and
xylene (BTEX). Benzene is a known human carcinogen and all BTEX
components are known to cause neurological effects [7]. BTEX chemicals
are prone to leaching due to their relatively low octanol: water
partition coefficients [8] and therefore pose a threat to drinking
water. In addition to loading limits, there are also several site
suitability requirements such as soil texture, depth to groundwater and
limiting layers, slope, soil sodium concentrations, and proximity to
surface waters. Although thousands of hectares are currently receiving
OBM, there has been relatively little research conducted on the
degradation of TPH and the leaching of BTEX after land application of
OBM.
Uncontrolled application rates could lead to soil TPH concentrations
that would be detrimental to soil and water quality leading to
environmental issues. Penet et al. [9] conducted a study that examined
biodegradation of hydrocarbons in the soil and found that microbes
degraded the straight chained hydrocarbons faster than the branched
chained hydrocarbons. Dou et al. [10] conducted a study focused on
anaerobic BTEX degradation under nitrate reducing conditions and
determined that BTEX could be biodegraded to undetectable concentrations
in 70 days if initial concentrations of BTEX were ≤ 100 mg kg'1
soil. Very few studies have dealt with TPH degradation and BTEX
leaching in soils after land application of OBM. Due to the hazardous
risks of TPH, specifically BTEX toxicity to humans and to the
environment, there is a need to examine TPH degradation and BTEX
leaching in soils after land application of OBM under different
scenarios such as multiple loading rates and moisture regimes. Thus, the
objective of this study was to determine the impact of rainfall regime
and TPH loading rates from OBM application on TPH degradation and BTEX
leaching.
Materials and Methods
A soil column study was conducted in Stillwater, Oklahoma in a
temperature controlled greenhouse. Soils were contained in 240 aluminum
soil columns that were 30.5 cm tall and 7.6 cm in diameter. Columns were
filled 15.2 cm with a sandy loam soil from Perkins, Oklahoma. The soil
series used in this experiment was Dougherty loamy fine sand (Loamy,
mixed, active, thermic Arenic Haplustalfs). Glass wool and aluminum
screen with a 7.6 cm hose clamp was placed on the bottom of all columns
in order to prevent soil from leaching out. The experimental design was a
randomized complete block with factorial structure. There were three
replications of each treatment. The OBM sample was characterized for pH,
electrical conductivity (EC), total soluble salts (TSS), and total
solids content, total and water extractable metals and total chloride.
OBM pH and EC were measured using pH and EC probes with a solid:
solution ratio of 1:5 and an equilibration time of 45 min. The OBM was
analyzed for total P, K, Mg, Ca, Na, Mn, Cu, Fe, Zn, S, Al, Ni, B, As,
Cd, Cr, Ba, Pb, and Mo using the EPA 3050 acid digestion method followed
by solution analysis with inductively coupled argon plasma analyzer
[ICP-AES; Spectro Ciros, Mahwah, NJ]. Water extractable metals and total
chloride were extracted with de-ionized (DI) water using a 1:10 solid:
solution ratio for 1 hour followed by ICP-AES analysis on the metals and
colorimetric flow-injection analysis (Lachat Quick Chem 8000, Loveland,
CO) for chloride.
Prior to the application of OBM, BTEX and TPH concentrations were
analyzed. Total petroleum hydrocarbons were extracted with hexane at
1:10 solids: solvent ratio, plus addition of 0.5 g Na2SO4
for 5 minutes on a reciprocating shaker followed by centrifugation for
10 minutes. Five mL of the resulting supernatant was equilibrated for 2
minutes with 1 g of silica gel in a glass tube for removal of polar
organic compounds. The solution was then analyzed for TPH using infrared
spectroscopy (ASTM method D 7066) with the Infra Cal TOG/TPH analyzer
(model HATR-T2, Wilks Enterprise Inc., East Norwalk, CT). Random samples
were duplicated and check samples were utilized in order to assure
precise and accurate results. Initial benzene, toluene, ethylbenzene,
o-xylene, m, p-xylene and TPH concentrations were 2.65, 23, 35, 64, 94,
and 161,558 mg kg- 1. Treatments included five TPH (i.e. OBM) loading rates and four rainfall regimes.
Soil columns were harvested for OBM analysis of TPH at four different
times. Oil-base mud was applied onto an aluminum screen which rested on
top of the soil that allowed soil to contact the OBM, yet prevented
mixing and dilution of the applied OBM TPH with the soil. This allowed
for removal of the OBM throughout the incubation in order to test for
TPH degradation. Oil-base mud loading rates were applied to achieve a
TPH application of 90,000, 67,000, 45,000, 22,000, and 0 (control) kg
TPH ha-1. Each column was treated with one leaching event per month
which consisted of application of 1.5 pore volumes of tap water. In this
study, the term "moisture regime" indicates the number of non-leaching
wetting events that occurred per month. Moisture regime levels 4, 3, 2,
and 1 had 3, 2, 1, and 0 non-leaching wetting events per month, which
consisted of 0.5 pore volumes of tap water. These non-leaching wetting
events are important because they can move soluble constituents within
the column, but not out of the column, as well as provide moisture for
microorganisms that may degrade TPH. Collected leachate was analyzed for
benzene, toluene, ethylbenzene, and xylene using the EPA 8021B method
followed by solution analysis with gas chromatography with a photo
ionization detector (GC-PID). In addition, leachate was also analyzed
for Na, Ca, Mg, K, SO4, B, P, Fe, Zn, Cu, Mn, Al, Mo, As, Cd, Co, Cr,
Pb, and Ba via ICP-AES. OBM was harvested on top of the aluminum screens
at 7, 30, 60, and 90 days after application and analyzed for TPH
concentrations (mg TPH kg mud-1) with the Wilks TOG/TPH IR Analyzer. The BTEX concentrations in harvested OBM samples were measured 7 days after application.
Statistics
Analyses of Variance (ANOVA) methods were utilized in PROC GLM [11]
to analyze the effects of OBM loading rates and moisture regimes on TPH
degradation and BTEX leaching. When the main effects or interactions of
OBM loading rates and moisture regimes were significant, treatment means
were separated using pair wise comparisons via Duncan's multiple range
test. Statistical decisions were made at a=0.05.The data analysis for
this paper was computed using SAS software.
Results and Discussion
Background Soil Properties
Table 1: Background chemical analysis of the soils used in the BTEX leaching column study.
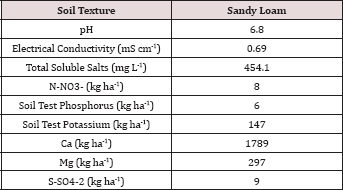
The soil utilized in the BTEX leachate study was a sandy loam texture
(Table 1) which has great potential for the leaching of soluble
constituents. The OCC states in the Oklahoma administrative code and
register, Title 165:10-7-26 that OBM must be incorporated into the soil
after application; incorporation of the OBM leads to increased mixing
(dilution) of the OBM into the soil and faster hydrocarbon degradation.
Due to the large hydraulic conductivity of the sandy loam soil and the
fact that the OBM was not incorporated made this study a worst-case
scenario for land application of OBM with respect to BTEX leaching and
hydrocarbon degradation. The background soil had N-NO3-, P, and K
concentrations of 8, 6, and 147 kg ha-1, respectively. Soil
pH was 6.8 and was in the optimal range for microbial degradation and
limiting metal migration in the soil [12].
Background Oil-Base Mud Properties
Table 2: Characterization of the raw (solids plus
liquid) and the water extractable portion of the oil-base mud (OBM) used
in the BTEX leaching column study. All water extraction results were
obtained by using a 1:10 solids to DI water ratio unless otherwise
noted.
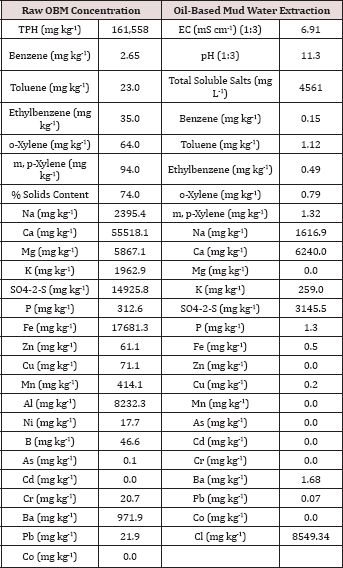
The initial chemical analysis of the raw OBM and water extractable
portion are listed in Table 2. The raw OBM had an initial TPH
concentration of 161,558 mg TPH kg'1 and consisted of 74% solids. The raw OBM had a benzene concentration of 2.65 mg kg-1 which was higher than the inhalation limit of 0.8 mg kg-1 established by the U.S. EPA [13] and for risk to groundwater by leaching (0.03 mg kg-1; [14]). The water-soluble benzene concentration (0.015 mg L-1) was higher than the groundwater limit of 0.005 mg L-1
set by the Oklahoma Guardian [15]. Calcium was the dominant cation in
both the raw solid and water extractable portion of the OBM. Chloride
and sulfate were the two most abundant anions in the water extractable
portion of the OBM. All heavy metal concentrations (Zn, Cu, Ni, As, Cd,
Cr, and Pb) measured in the raw OBM were below EPA 503 thresholds for
"exceptional quality" bio solids, indicating that there is only slight
risk of metals contamination from land application of this OBM sample
[16]. In fact, heavy metal concentrations in the OBM were in the normal
range typically found in soils [17].
Degradation of total petroleum-based hydrocarbons with oil-base mud application
The main effects of TPH rate, moisture regime, sampling day (i.e.
time), and the two-way interaction of rate*day were significant at α =
0.05 for TPH concentration (mg kg-1 OBM). An ANOVA table with the complete list of main effects and interactions for TPH concentration (mg kg-1 OBM) are listed in Table 3.The main effect of TPH application rate (kg TPH ha-1) on overall TPH concentration (mg TPH kg’1
OBM) was significant (P ≤ 0.05) and is shown in more detail in Table 4
(averaged across all sampling times and moisture regimes). TPH
application rate 1 (22,000 kg TPH ha-1) had a significantly
lower TPH concentration than all other rates and was closely followed by
application rate 2 (45,000 kg TPH ha-1) which was also significantly different than all other application rates. Application rate 3 (67,000 kg TPH ha-1) and rate 4 (90,000 kg TPH ha-1)
had the highest TPH concentrations but were not significantly different
than each other. The decreased TPH degradation displayed by application
rates 3 and 4 were likely due to reduced contact between OBM and the
soil surface (i.e. lower OBM: soil contact area), resulted in less TPH
degradation [18,19].
Table 3: Mean total petroleum hydrocarbon (TPH) concentrations (mg kg-1
OBM) in the surface applied OBM averaged across moisture regime and
sampling day for each TPH application rate. OBM loading rates were
applied at 90,000, 67,000, 45,000, 22,000, and 0 (control) kg TPH ha-1.
The treatments were subjected to four different moisture regimes. OBM
was sampled at 0, 7, 30, 60, and 90 days after application. Uppercase
letters represent mean separation of TPH concentration (mg TPH kg-1 mud) between TPH rates. Statistical decisions were mad at P = 0.05.
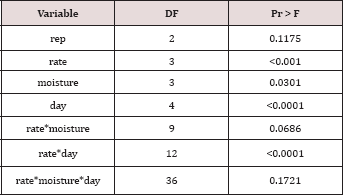
Table 4: Mean total petroleum hydrocarbon (TPH) concentration (mg TPH kg-1
OBM) at each sample day averaged over moisture regime and TPH
application rate. OBM loading rates were applied at 90,000, 67,000,
45,000, 22,000, and 0 (control) kg TPH ha-1. The treatments
were subjected to four different moisture regimes. OBM was sampled at 0,
7, 30, 60, and 91 days after application. Uppercase letters represent
mean separation of TPH degradation (mg TPH kg-1 OBM) between all sample days. Statistical decisions were made at P = 0.05.

Table 5: Mean total petroleum hydrocarbon (TPH) concentration (mg TPH kg-1
OBM) averaged across moisture regime and compared between sample day
and TPH application rate. OBM loading rates were applied at 90,000,
67,000, 45,000, 22,000, and 0 (control) kg TPH ha-1. The
treatments were subjected to four different moisture regimes. OBM was
sampled at 0, 7, 30, 60, and 91 days after application. Uppercase
letters represent mean separation of TPH concentration between sampling
days at each TPH application rate. Lowercase letters represent mean
separation of TPH concentration between TPH application rates at each
sampling day. Statistical decisions were made at P = 0.05.
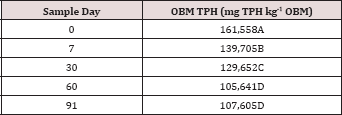
The main effect of sampling day (time) on overall TPH concentration
was significant (P ≤ 0.05) and is shown in further detail in Table 5
(averaged across all application rates and moisture regimes). As time
increases, a significant decrease in TPH concentration was observed
until day 60. Day 60 and 91 had a significantly lower TPH concentration
than all previous sampling days; however there was no significant
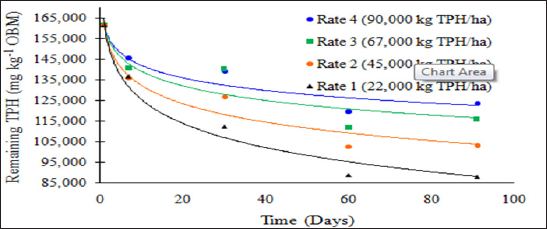
difference between day 60 and 91. Figure 1 and Table 6 illustrate the
insignificant degradation between day 60 and 91 for each application
rate. There was a large decrease in TPH concentration for all TPH rates
up until day 60. This plateau effect in degradation is likely due to the
consumption of microbial nutrients, probably nitrogen, which inhibited
further biodegradation of hydrocarbons. There were no significant
differences in TPH concentrations between TPH application rates at day 0
or 7. Significant difference between TPH rates occur at day 30 and
continue through day 91. TPH application rate 1 had the lowest TPH
concentration followed by rate 2 and rate 3, while rate 4 is not
significantly higher than rate 3. The TPH application rates 1 and 2
possess a higher proportion of OBM in contact with the soil surface,
which may have improved degradation. Not only do TPH
rates 3 and 4 have lower OBM to soil contact ratios, which limited
microbial degradation of hydrocarbons. TPH concentrations for all
biodegradation of TPH, but the excessive loading rates could have
application rates at day 90 were higher than the Oklahoma Guardian
impeded oxygen flow into the soil which may have further restricted
thresholds established for non-sensitive soils (46,000 mg kg-1; [5]).
Table 6: Mean total petroleum hydrocarbon (TPH) concentration (mg TPH kg-1
OBM) averaged across moisture regime and compared between sample day
and TPH application rate. OBM loading rates were applied at 90,000,
67,000, 45,000, 22,000, and 0 (control) kg TPH ha-1. The
treatments were subjected to four different moisture regimes. OBM was
sampled at 0, 7, 30, 60, and 91 days after application. Uppercase
letters represent mean separation of TPH concentration between sampling
days at each TPH application rate. Lowercase letters represent mean
separation of TPH concentration between TPH application rates at each
sampling day. Statistical decisions were made at P = 0.05.

Figure 1: Mean remaining total petroleum hydrocarbon (TPH)
concentrations in the OBM in mg kg-1 OBM. OBM loading rates were applied
at 90,000, 67,000, 45,000, 22,000, and 0 (control) kg TPH ha-1. The
treatments were subjected to four different moisture regimes. OBM was
sampled at 0, 7, 30, 60, and 91 days after application. TPH values are
for each sampling day and TPH application rate averaged over moisture
regime.
Changes in BTEX concentrations in the oil-base mud
The main effect of sampling day on OBM BTEX concentration was
significant at α = 0.05. The main effect of TPH rate and the two-way
interaction of rate*day was also significant at α = 0.05 and is shown in
Table 7, which provides a complete list of ANOVA results for the main
effects and interactions. Table 8 shows a significant decrease in BTEX
concentration (mg kg-1) for all BTEX constituents between day 0 and 7. These decreases in BTEX concentrations over
for inhalation and groundwater risks.
Table 7: ANOVA results for oil-base mud (OBM) benzene, ethylbenzene, toluene, o-xylene, and m, p-xylene (BTEX) concentrations in mg kg-1 OBM for the BTEX leaching column study. Results are significant when (Pr ≤ 0.05).

Table 8: Mean benzene, ethylbenzene, toluene, o-xylene, and m, p-xylene (BTEX) concentrations (mg kg-1
OBM) averaged across moisture regime and total petroleum hydrocarbon
(TPH) application rate and compared between each sampling day. OBM
loading rates were applied at 90,000, 67,000, 45,000, 22,000, and 0
(control) kg TPH ha-1. The treatments were subjected to four
different moisture regimes. OBM BTEX was sampled at 0, and 7 days after
application. Lowercase letters represent mean separation for BTEX
degradation (mg kg-1 OBM) between each sampling day. Statistical decisions were made at P = 0.05.

The main effect of TPH application rate (kg TPH ha-1) was significant (Pr ≤ 0.05) for OBM BTEX concentration (mg kg’1)
for every BTEX constituent except for benzene (Table 9), when averaging
over the two sampling days. TPH application rate 1 had significantly
lower concentrations of ethylbenzene, toluene, o-xylene, and m, p-xylene
than all other TPH application rates. The TPH application rate 2 had
the next lowest concentration values, rates. TPH application rates 3 and
4 had the highest concentrations of BTEX and were both significantly
higher than TPH rates 1 and 2, although not significantly different from
each other. Similar trends were noted regarding TPH concentrations
(Table 4). Higher BTEX concentrations (i.e. lower degradation) at the
highest application rates (3 and 4) likely occurred for the same reasons
as previously discussed for TPH degradation.
Table 9: Mean benzene, ethylbenzene, toluene, o-xylene, and m, p-xylene (BTEX) concentrations(mg kg-1
OBM) at each total petroleum hydrocarbon (TPH) application rate for the
BTEX leaching column study. OBM loading rates were applied at 90,000,
67,000, 45,000, 22,000, and 0 (control) kg TPH ha-1. The
treatments were subjected to four different moisture regimes. OBM BTEX
was sampled at 0, and 7 days after application. Lowercase letters
represent mean separation for BTEX concentration (mg kg-1 OBM) between each TPH rate. Statistical decisions were made at P = 0.05.

Concentrations and loads of BTEX leached from applied oil-base mud
The main effects of TPH rate, moisture regime, leaching event, and
the interactions between each are shown in Table 10.The main effect of
leaching event was significant (P ≤ 0.05) for BTEX leachate
concentrations (μg L-1) and is shown in added detail in Table
11, averaged over TPH application rate and moisture regime.
Significantly higher concentrations of BTEX were measured at leaching
event 1 when compared to leaching events 2 and 3. For every BTEX
constituent except for o-xylene, leaching event 1 was
the only leaching event in which detectable levels of BTEX were measured
in leachate. All BTEX concentrations at leaching event 1 were low (<
5 ng L-1) and below the threshold limits for drinking water
established by EPA 816F regulations. It is noteworthy to mention that
each leaching event is an average of three leachate sampling days; a
higher leaching event number (e.g. leaching event 1, 2, and 3) also
indicates a greater amount of time that has occurred since application
of OBM. No BTEX was detected in leachate from leaching events 2 and 3
because it was either mostly volatized, degraded, or sorbed to soil
surfaces.
Table 10: ANOVA results for benzene, ethylbenzene, toluene, o-xylene, and m, p-xylene (BTEX) leachate concentrations in (μg L-1) for the BTEX leaching column study. Results significant when (Pr≤ 0.05). LE = "leaching event".

Table 11: Mean benzene, ethylbenzene, toluene, o-xylene, and m, p-xylene (BTEX) leachate concentrations (μg L-1)
averaged over total petroleum hydrocarbon (TPH) application rate and
moisture regimes and compared between leaching events. For the BTEX
leaching column study. OBM loading rates were applied at 90,000, 67,000,
45,000, 22,000, and 0 (control) kg TPH ha-1. The treatments
were subjected to four different moisture regimes which had one leaching
event per month. Lowercase letters represent mean separation between
leaching events for each BTEX constituent concentration (μg L-1). Statistical decisions were made at P = 0.05. LE = "leaching event".

The main effect of moisture regime was significant (P ≤ 0.05) for BTEX leachate concentrations (μg L-1)
and is presented in further detail in Table 12. Moisture regime 1 (0
wetting events per month) showed significantly higher BTEX
concentrations than all other moisture regimes that received
non-leaching wetting events. The leachate concentrations of each BTEX
constituent at moisture regime 2, 3, and 4 were statistically the same.
However, the highest concentrations of BTEX observed in the leachate for
moisture was averaged over the first sampling day of each month (day 0,
35, and 63). Specifically, moisture regime 1 was sampled (i.e. leached)
on day 0, 35, and 63 and only had BTEX concentrations above 0 ng L-1
on day 0, which were the highest for the entire study. The highest BTEX
leachate concentrations from day 0 thus caused moisture regime 1 to be
significantly higher than the other moisture regimes. Again, this shows
the importance of time on BTEX degradation, volatilization, and sorption
to the soil.
Table 12: Mean ethylbenzene and toluene leachate concentrations (μg L-1)
averaged over total petroleum hydrocarbon (TPH) application rate and
leaching events and compared between moisture regimes. OBM loading rates
were applied at 90,000, 67,000, 45,000, 22,000, and 0 (control) kg TPH
ha-1. The treatments were subjected to four different
moisture regimes which had one leaching event per month. Uppercase
letters represent mean separation for ethylbenzene and toluene between
moisture regimes. Statistical decisions were made at P = 0.05.

Table 13: Mean benzene and toluene leachate concentrations (μg L-1)
at moisture regime one comparing total petroleum hydrocarbon (TPH)
application rates and leaching events for the BTEX leaching column
study. OBM loading rates were applied at 90,000, 67,000, 45,000, 22,000,
and 0 (control) kg TPH ha-1. The treatments were subjected
to four different moisture regimes which had one leaching event per
month. Uppercase letters represent mean separation of benzene and
toluene leachate concentrations between TPH application rates at each
leaching event within moisture regime one. Lowercase letters represent
mean separation of benzene and toluene leachate concentrations between
leaching events at each TPH application rate within moisture regime one.
Statistical decisions were made at P = 0.05.

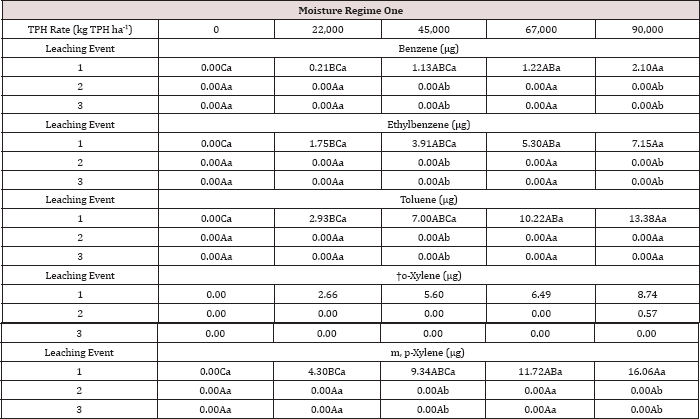
The three-way interaction of TPH rate by moisture regime by leaching
event was significant (P ≤ 0.05) for benzene and toluene leachate
concentrations (ng L-1; Table 13). Moisture regime 1 is the
only regime shown in Table 13 because this was the only moisture regime
that had significant amounts of BTEX in the leachate (Table 12). A
general trend of increasing concentrations of benzene and toluene in
leachate was observed as the rate of TPH application increased, for
leaching event 1. Leaching events 2 and 3 have no detectable
concentrations of benzene or toluene in the leachate. By the time
leaching events 2 and 3 occurred, all amounts of benzene and toluene
were lost via microbial degradation, volatilization, and sorption to the
soil, or through leachate. The main effects of TPH application rate,
moisture regime, and leaching event on BTEX leachate loads and the
interactions between variables are shown in Table 14. The three-way
interaction of TPH rate by moisture regime by leaching event was
significant (P ≤ 0.05) for all constituents of BTEX except for o-xylene
and is shown in further detail in Table 15. Moisture regime 1 is the
only moisture regime listed due to the fact that this was the only
moisture regime that contained detectable concentrations in leachate
(Table 12). For leaching event 1, a general trend of increasing BTEX
loads is evident with greater TPH application rates.
Table 14: ANOVA results for benzene, ethylbenzene, toluene,
o-xylene, and m, p-xylene (BTEX) leachate loads (μg) for the BTEX
leaching study. Results were significant when (Pr ≤ 0.05). LE =
"leaching event".

Table 15: Mean benzene, ethylbenzene, toluene, o-xylene, and
m, p-xylene (BTEX) leachate loads at moisture regime one, comparing TPH
application rates and leaching events. OBM loading rates were applied at
90,000, 67,000, 45,000, 22,000, and 0 (control) kg TPH ha-1.
The treatments were subjected to four different moisture regimes which
had one leaching event per month. "┼-"- o-xylene was not significant at P
= 0.05. Uppercase letters represent mean separation of BTEX loads (μg)
between TPH application rates at each leaching event, for moisture
regime one. Lowercase letters represent mean separation of BTEX loads
(^g) between leaching events at each TPH rate, for moisture regime one.
Statistical decisions were made at P = 0.05.
Leachate electrical conductivity and pH
The main effects of TPH application rate, moisture regime, and
leaching event on leachate EC, and interactions between variables are
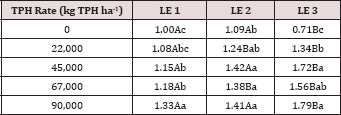
shown in Table 16. The two-way interaction of TPH rate by leaching event
was significant (P ≤ 0.05) for leachate EC (mS cm-1) and is
shown in greater detail in Table 17. A significant increase in leachate
EC is observed with increasing TPH application rates for each leaching
event. As TPH rate increased, the total amount of salts applied from the
OBM (Table 2) was greater, which led to higher leachate EC values as
the salts dissolved with the leaching water? A general trend of
increasing leachate EC with leaching event was observed for each TPH
application rate except for the control which received no amendment. The
leachate EC can serve as an indicator of the mobility of soluble
species in the solution and can be used to indicate the leaching front
for soluble species. Due to the fact that leachate EC continues to
increase at each leaching event while BTEX concentrations do not (Table
11), this confirms that the BTEX has either degraded or sorbed to the
soil or was lost via volatilization (Figure 2).
Figure 2: Mean remaining total petroleum hydrocarbon (TPH)
concentrations in oil-base mud (mg kg-1 OBM) for the BTEX leaching
study. OBM loading rates were applied at 90,000, 67,000, 45,000, 22,000,
and 0 (control) kg TPH ha-1. The treatments were subjected to four
different moisture regimes. OBM was sampled at 0, 7, 30, 60, and 91 days
after application. Remaining TPH concentrations are shown for each TPH
application rate, and sampling time, and are averaged over moisture
regime.
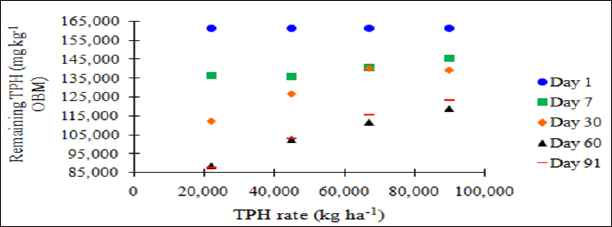
Table 16: ANOVA results for leachate electrical conductivity (EC; mS cm-1) and pH for the BTEX leaching column study. Results were significant when (Pr ≤ 0.05). LE = "leaching event".
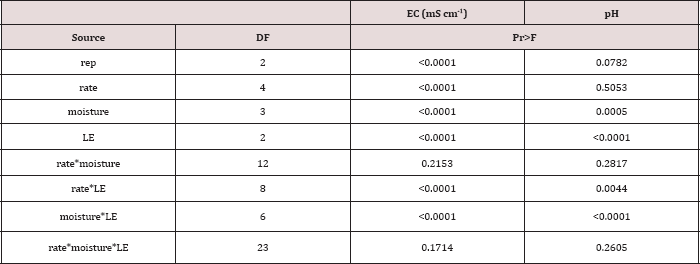
Table 17: Mean leachate electrical conductivity (EC; mS cm-1)
averaged across moisture regime comparing total petroleum hydrocarbon
(TPH) application rates and leaching events (LE). OBM loading rates were
applied at 90,000, 67,000, 45,000, 22,000, and 0 (control) kg TPH ha-1.
The treatments were subjected to four different moisture regimes which
had one leaching event per month. Uppercase letters represent mean
separation of leachate EC (mS cm-1) between leaching events
at each TPH application rate. Lowercase letters represent mean
separation between TPH application rates at each leaching event.
Statistical decisions were made at P = 0.05.
The main effects of moisture regime and leaching events, and the
interactions of TPH rate*leaching event and moisture regimes*leaching
events were significant at a = 0.05 for the pH of the leachate. Table 16
provides a complete list of ANOVA results for all main effects and
interactions for leachate pH. The main effect of leaching event was
significant (P ≤ 0.05) for leachate pH and is shown in more detail in
Figure 3. There were significant increases in leachate pH with each
additional leaching event. However, TPH application rate had no effect
on leachate pH because the pH of the control leachate also had
significant increases in pH with each additional leaching event (Figure
4). The increase in leachate pH across the leaching events was likely
due to the alkaline pH (8.23) of the water that was used to leach the
soil columns. As time progressed throughout leaching events, the
leachate pH approached the higher pH values of the water that was used
to leach the soil columns(Table 18).
Figure 3: Mean leachate pH comparing each leaching event for
the BTEX leaching column study. OBM loading rates were applied at
90,000, 67,000, 45,000, 22,000, and 0 (control) kg TPH ha-1. The
treatments were subjected to four different moisture regimes which had
one leaching event per month. Leachate pH values are averaged over total
petroleum hydrocarbon (TPH) rate and moisture regimes. Uppercase
letters represent mean separation of leachate pH between leaching
events. Statistical decisions were made at P = 0.05.
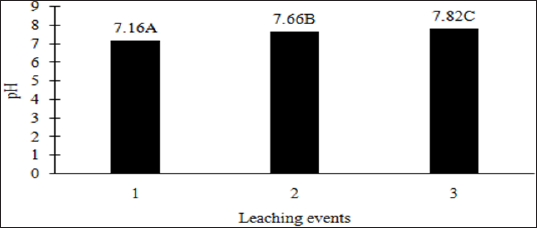
Figure 4: Mean leachate pH of the control (no OBM) comparing
each leaching event for the BTEX leachate column study. OBM loading
rates were applied at 90,000, 67,000, 45,000, 22,000, and 0 (control) kg
TPH ha-1. The treatments were subjected to four different moisture
regimes which had one leaching event per month. Leachate pH was averaged
over moisture regimes. Uppercase letters represent mean separation of
leachate pH between leaching events. Statistical decisions were made at P
= 0.05.
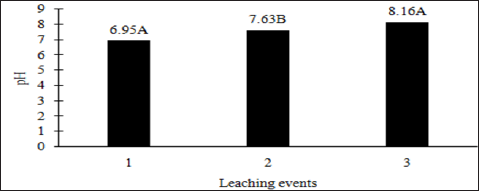
Table 18: Mean leachate pH values averaged over total
petroleum hydrocarbon (TPH) rate, comparing moisture regimes and
leaching events. OBM loading rates were applied at 90,000, 67,000,
45,000, 22,000, and 0 (control) kg TPH ha-1. The treatments
were subjected to four different moisture regimes which had one leaching
event per month. Uppercase letters represent mean separation of
leachate pH between moisture regimes at each leaching event. Lowercase
letters represent mean separation of leachate pH between leaching events
at each moisture regime. Statistical decisions were made at P = 0.05.

Summary and Implications
The OBM was applied in this study at rates much greater than what is
allowed by current OCC regulations, and were not incorporated in order
to examine the worst-case scenario regarding environmental impact. The
OBM used in this soil column leachate study did not possess heavy metal
concentrations beyond normal soil concentrations. Benzene concentrations
in the raw OBM (2.65 mg kg-1) were higher than the EPA threshold limits established for inhalation (0.8 mg kg-1) and leaching to groundwater (0.03 mg kg -1).
Regardless, by day 7, the BTEX concentration in the mud had decreased
by 88% and benzene only leached out during the first leaching event
which produced benzene concentrations that were acceptable according to
USEPA drinking water standards. This was surprising due to the high
benzene content in the OBM, which greatly exceeded USEPA risk levels for
groundwater leaching, the short column length, and high hydraulic
conductivity of the soil utilized. An explanation for this is found in
closer examination of the assumptions made in creation of the USEPA
concentration thresholds for leaching to groundwater i.e. the assumption
that there is no degradation of benzene and that the entire soil
profile contains benzene from the surface to the groundwater interface.
As expected, increased OBM application rates resulted in higher leachate
benzene concentrations.
All leachate BTEX concentrations were below drinking water
thresholds. No trace metals were detected in leachate. Part of the
reason for non-detectable BTEX concentrations in leachate after the
initial leaching event on day 0, was due to 88% degradation of BTEX in
the applied OBM by day 7. Based on the results of this study, there is
little risk of BTEX leaching to ground water through land application of
OBM. However, it is unknown if this lack of BTEX movement was due to
extreme soil sorption, degradation, or volatilization. The main effect
of TPH application rate had the greatest effect on TPH degradation, BTEX
concentrations in the OBM, leachate BTEX concentrations and loads, and
leachate EC. As the rate of TPH increased, a decrease in hydrocarbon
degradation was observed due to the higher OBM to soil ratio that
limited oxygen inflow and microbial degradation. A plateau effect on
biodegradation of TPH was seen at day 60 and continued throughout day
91. At that point, we hypothesize that the microorganisms had likely
consumed all of the nutrients and could no longer biodegrade the TPH.
Therefore, applying a source of fertilizer and increasing the surface
area to volume ratio of the OBM via disking or using a bulking agent is
important when considering microbial degradation of TPH. During the
study, the maximum TPH degradation that occurred was 35%, which occurred
from the lowest TPH application rate. Leachate EC increased as TPH rate
increased due to higher loads of soluble salts. Leachate EC also
increased at each leaching event as opposed to the decreasing BTEX
concentrations with additional leaching event, which confirmed that the
BTEX had volatilized, sorbed to the soil, or degraded. The main effect
of TPH rate had no effect on leachate pH. Further studies should be
conducted in order to quantify BTEX volatilization that may occur with
land application of OBM, and deter mine if there is any possible human
health risks associated with any potential volatilization.
Read More About Lupine Publishers Journal of Oceanography and Petrochemical Sciences Please Click on Below Link:
https://oceanography-lupine-publishers.blogspot.com/


