Showing posts with label Journal of Diabetes and Obesity. Show all posts

Tuesday, 17 October 2023

Lupine Publishers | Pathophysiology of Cardiovascular Complications in Obesity and Diabetes

 Lupine Publishers | Journal of Diabetes & Obesity


Introduction

According to the World Health Organization (WHO), the global incidence of obesity has nearly tripled since 1975; more than 1.9 billion adults were overweight and 650 million of those were obese in 2016. The WHO has defined obesity as an abnormal or excessive accumulation of fat that may impair health [1]. On the other hand, the number of people with diabetes rose from 108 million in 1980 to 422 million in 2014. Between 2000 and 2016, there was a 5% increase in premature mortality from diabetes and in 2019, an estimated 1.5 million deaths were directly caused by diabetes. Another 2.2 million deaths were attributable to high blood glucose in 2012 [2]. It is without any ambiguity that both these chronic metabolic diseases represent universal major health hazards and are on the rise in both developed and developing nations. It should be pointed out that type 1 diabetes involves the lack of production of insulin, whereas type 2 diabetes is due to an insulin resistance. Both types of diabetes as well as obesity lead to several health complications, including cardiovascular disease. Several books are available that provide a wealth of experimental and clinical lines of evidence indicating that both diabetes and obesity are major risk factors for the development of heart disease [3-8]. In this article we describe some of the common characteristics and features in the etiology of cardiovascular abnormalities associated with obesity and diabetes-induced cardiomyopathies [9,10].

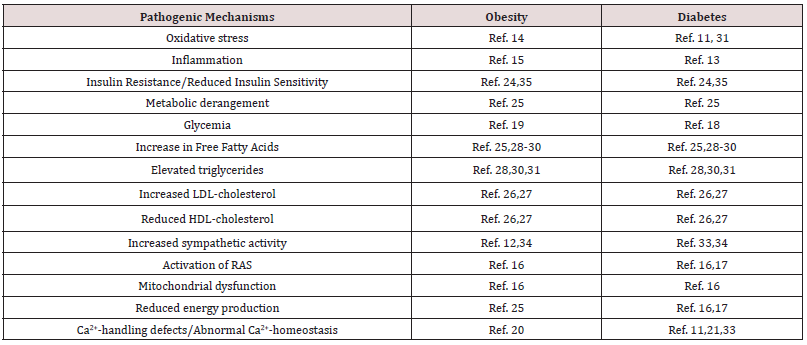
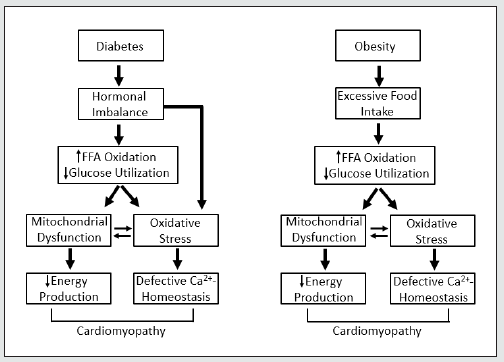
Obesity cardiomyopathy occurs in individuals with severe and long-standing obesity that can lead to progressive congestive heart failure and increased risk of sudden cardiac death [9]. In this regard, there is an increase in total blood volume and cardiac output because of the high metabolic activity of excessive fat in obesity [9]. In moderate to severe cases of obesity this can lead to an increase in left ventricle (LV) dilation, increase in LV wall stress, compensatory LV hypertrophy and LV diastolic dysfunction. If the LV wall stress remains high then LV systolic dysfunction occurs. Likewise, diabetic cardiomyopathy presents with reduced LV ejection fraction, augmented pre-ejection time and increased LV end-diastolic pressure due high LV wall stiffness and isovolumic relaxation as well as depressed cardiac contractility [10,11]. The similarities in the major biochemical mechanisms in both diabetes and obesity are shown in (Table 1). It is our contention that the main upstream factors that lead to heart dysfunction are hormonal imbalance in diabetes-induced heart disease and excessive food intake in obesity-induced heart disease. Figure 1 shows the key downstream sequence of events that ultimately lead to cardiomyopathy in diabetes and obesity in these two metabolic diseases. It is noteworthy that sympathetic outflow is increased in both diabetic and obese subjects [11,12]. Oxidative stress and inflammation are considered to play critical roles in inducing cardiomyopathy as well as insulin resistance in diabetes and obesity [11,13-15]. Oxidative stress, inflammation and mitochondrial dysfunction (including reactive oxygen species production and energy deficiency) may be due to the effects of the upregulation of the renin angiotensin system (RAS) in these metabolic diseases [16,17].

Hyperglycemia has also been identified as the key determinant in the development of oxidative stress and cardiomyopathy in both diabetes and obesity [18,19]. The development of oxidative stress may induce defects in cardiomyocyte Ca2+-handling that attenuate cardiac function because dysregulation of Ca2+-homeostasis is known to occur in both diabetic cardiomyopathy and obesity cardiomyopathy [11,20,21]. It is pointed out that although the molecular and cellular aspects of diabetic cardiomyopathy have been studied extensively, there is relatively a paucity of information regarding the mechanisms involved in the pathogenesis of obesity cardiomyopathy and thus needs to be further explored. Furthermore, nutritional approaches involving macronutrients, have been well documented for the management and treatment of both obesity and diabetes. However, the potential of micronutrients, particularly as many of them exhibit antioxidants/anti-inflammatory actions [11,13,22], as well as pharmacological agents that exert dual antioxidant and anti-inflammatory actions [23] should be explored in preclinical trials in these pathological conditions.

Table 1: Pathogenic mechanisms that lead to cardiomyopathy in chronic obesity and diabetes.

Lupinepublishers-openaccess-journal-diabetes-obesity

Ref. number for each mechanism in obesity or diabetes refer to those cited in the Reference Section.

Figure 1: Schematic representation of events involved in the pathogenesis of cardiomyopathy in chronic diabetes and obesity. Hormonal imbalance in diabetes refers to the changes in plasma levels of insulin deficiency or resistance in addition to the elevated levels of other hormones such as catecholamines and angiotensin II, which are known to promote oxidative stress. FFA, free fatty acids;  - increase; - decrease.

Lupinepublishers-openaccess-journal-diabetes-obesity

Body mass index is related to diabetes and insulin resistance, in fact, both type 2 diabetes and obesity are associated with insulin resistance [24]. Both diabetes and obesity induce a distinct cardiac metabolic phenotype that underlie the functional abnormalities of the heart [25]; dyslipidemias are alterations to the plasma lipid profile that are often associated with both metabolic diseases [26,27]. Most patients with obesity and diabetes have hypertriglyceridemia and increased plasma levels of fatty acids (FA), which are taken up and stored in lipid droplets in the heart. Intramyocardial lipids that exceed the capacity for storage and oxidation can be lipotoxic and induce non-ischemic and nonhypertensive cardiomyopathy [28]. Type 2 diabetes and obesity are associated with systemic inflammation, generalized enlargement of fat depots and uncontrolled release of FA into the circulation [29]. The heart balances uptake, metabolism and oxidation of FA to maintain ATP production, membrane biosynthesis and lipid signaling. Under conditions where FA uptake outpaces FA oxidation and FA sequestration as triacylglycerols in lipid droplets, toxic FA metabolites such as ceramides, diacylglycerols, long-chain acyl- CoAs, and acylcarnitines can accumulate in cardiomyocytes and cause cardiomyopathy [30,31].

Metabolic derangement results in an increase in FA uptake and β-oxidation in the heart. These changes in FA metabolism have a negative effect on cardiac contractile function in both diabetes and obesity; the relation and the mechanisms of myocardial FA metabolism have been highlighted in an excellent review article by Lopaschuk et al, [25]. In addition, these researchers have examined the potential of targeting of FA metabolism as a therapeutic intervention for heart disease, which could be an important approach for the treatment/prevention of heart disease in high risk diabetic and obese individuals. It is interesting to note that following the onset of heart failure, obesity per se is associated with preserved tissue ATP and mitochondrial oxyradical production, which has been suggested to be a favorable metabolic pattern for survival [32]. It is also pointed out that sympathetic overdrive contributes to the derangement of glucose metabolism in clinical conditions such as obesity and type 2 diabetes and the increased cardiac levels of catecholamines and production of catecholamine oxidation products have been shown to result in metabolic derangements and Ca2+ -handling abnormalities [33]. Thus, targeting of the sympathetic nervous system directly may prove to be highly beneficial; an approach that could be incorporated in routine clinical practice [34].

Interestingly, there occurs a close relationship between obesity and diabetes because the metabolic derangement in obesity can be seen to lead to the occurrence of diabetes, whereas similar metabolic derangement in diabetes may result in obesity. An excellent editorial by Robert Lustig [35] has addressed this very important question of the sequence of events for insulin resistance with respect to the time-course for diabetes and obesity. It has also been argued that resistance to insulin action starts in the liver and then the pancreas secretes more insulin to make the liver do its job; this raises insulin levels in the body, promotes adipogenesis, and increases peripheral insulin resistance all at the same time. However, when the hypothalamus becomes insulin resistant first, the leptin signal is antagonized resulting in increased appetite and weight gain and eventually peripheral insulin resistance. The role of the hypothalamus-leptin axis with respect to insulin resistance and the relationship with diabetes and obesity is an important area of research and needs to be further investigated [36].

Conclusion

In conclusion, we have attempted to show that there are several common concepts and mechanisms that result in cardiomyopathy in individuals with obesity and/or diabetes. While in chronic conditions of both these metabolic diseases, the occurrence of oxidative stress and inflammation are major factors that cause insult on cardiac function. Thus, targeting these factors may prove to be highly beneficial in the prevention of downstream defects that lead to functional abnormalities in the heart in diabetes and obesity. It should also be mentioned that sex differences and ethnic variations are known to exist in the incidence of both diabetes and obesity and thus any approach to understand the etiology and disease outcomes should take these important aspects into consideration. Nonetheless, the present discussion regarding the overlap in the pathogenic mechanisms of cardiomyopathy in obesity and diabetes is indicative of their co-existence and provide scope for the examination on the cause-effect relationship between these metabolic diseases.

Acknowledgement

Infrastructural support for this work was provided by the St. Boniface Hospital Albrechtsen Research Centre.

Read More About Lupine Publishers Journal of Diabetes & Obesity Please Click on the Below Link:

https://diabetes-obesity-lupine-publishers.blogspot.com/


Tuesday, 22 August 2023

Lupine Publishers | Semaglutide versus liraglutide for treatment of obesity

 Lupine Publishers | Journal of Diabetes & Obesity


Abstract

Background: Once weekly (OW) semaglutide is a glucagon-like peptide-1 receptor agonist (GLP-1 RA) currently under evaluation for treatment of obesity at a dose of 2.4 mg OW.

Objective: To compare weight-loss efficacy and safety of once daily (OD) liraglutide 3.0 mg versus OW semaglutide 2.4 mg. Methods: Pubmed research up to March 31, 2021. Randomized trials, pertinent animal studies, and reviews are included. Search terms were glucagon-like peptide-1 receptor agonists, weight loss, obesity, liraglutide, semaglutide, efficacy, safety.

Results: No head to head trials are available to provide direct comparison of efficacy of OD liraglutide 3.0 mg versus OW semaglutide 2.4 mg. However, marked resemblance between trials in terms of study protocols and subjects’ characteristics may allow indirect comparison. In clinical trials of OW semaglutide, this drug was consistently associated with greater weight loss than in trials of OD liraglutide. Thus, placebo-corrected percentage weight reduction was -10.3 to -12.4% and -5.4% with OW semaglutide and OD liraglutide, respectively. In patients with type 2 diabetes, corresponding weight reduction was less pronounced with both drugs being -6.2% and -4.3% with OW semaglutide and OD liraglutide, respectively. In addition, head to head trials comparing liraglutide and semaglutide used in different doses and formulations consistently showed more weight loss in favor of semaglutide. In general, the anti-hyperglycemic efficacy and safety profile are similar in both drugs.

Conclusions: Available indirect evidence suggests that OW semaglutide 2.4 mg may be superior to OD liraglutide 3.0 mg for weight loss. Head-to-head comparison between these 2 agents is essential to confirm this conclusion.

Keywords: Obesity; Liraglutide; Semaglutide; Glucagon-like Peptide-1; Efficacy; Safety; Weight Loss; Type 2 Diabetes; Hemoglobin A1c

Introduction

GLP-1 RAs are approved for treatment of type 2 diabetes. The drug profile of these drugs is characterized by mild dose-related weight loss of approximately 2-6 kg [1]. Currently, liraglutide is the only GLP-1 RA approved for treatment of obesity in a dose higher than that approved for type 2 diabetes (3.0 mg daily for treatment of obesity as opposed to a maximum dose of 1.8 mg/d in type 2 diabetes) [2]. Semaglutide is another GLP-1 RA approved for treatment of type 2 diabetes in a dose of 0.5-1.0 mg given subcutaneously OW and as an oral formulation in a dose up to 14 mg once daily [3,4]. Currently, semaglutide is under evaluation for future approval for treatment of obesity. The Semaglutide Treatment Effect in People with obesity (STEP) development program including 5 phase 3 clinical trials (STEP 1 to 5) was launched to evaluate efficacy and safety of OW semaglutide at this high dose of 2.4 mg for treatment of obesity in patients with and without diabetes [5].

Mechanisms of Weight Loss by Liraglutide and Semaglutide

In general, the mechanisms of weight loss by liraglutide and semaglutide are similar. Both agents were shown to reduce appetite and hunger while increasing sense of fullness and satiety [6,7]. In addition, OW semaglutide 2.4 mg, but not liraglutide, may decrease food craving [7]. Animal studies have shown that the anorexigenic effect of semaglutide is mediated by GLP-1 receptors in the hypothalamus and hind brain [8,9]. Delay in gastric emptying, a class effect of all GLP-1 RAs, may contribute to the sensation of early fullness [10]. Meanwhile, one study with relatively longfollow- up (52 weeks) has shown that improvements in hunger and fullness with OD liraglutide 3.0 mg peak after 4 weeks, then decline gradually and return to baseline after 40 weeks [6]. Similar followup studies are not available for semaglutide.

STEP Program of Semaglutide

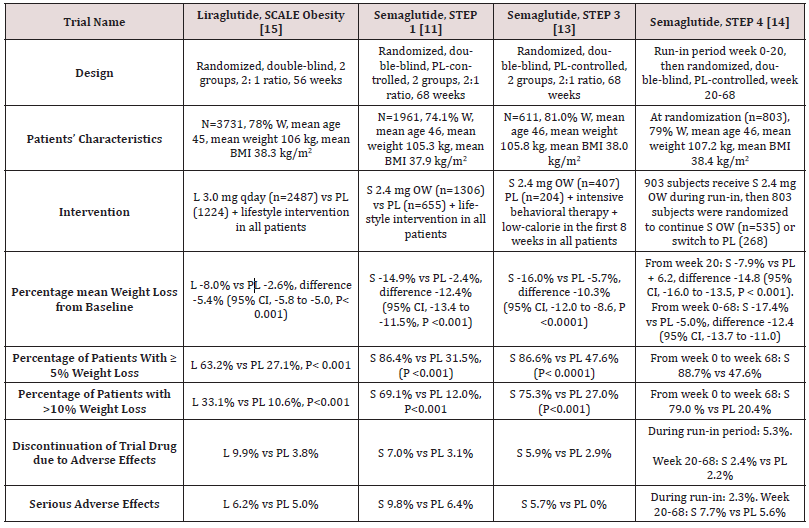
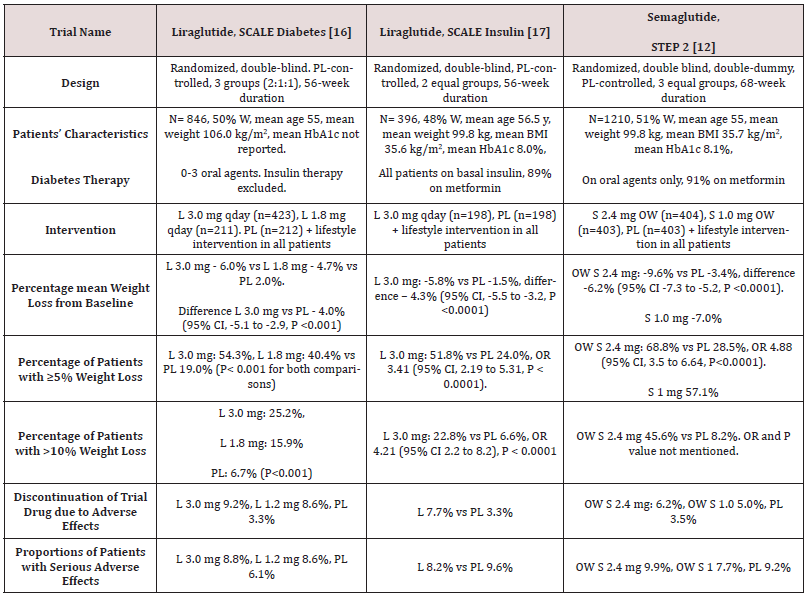
STEP 1 to 4 trials are well-designed studies comparing OW 2.4 mg semaglutide with placebo in obese individuals (defined as BMI of ≥ 30 kg/m2, over ≥ 27 kg/m2 with ≥ 1 weight-related coexisting condition e.g. hypertension, dyslipidemia, cardiovascular disease, or obstructive sleep apnea) for 68 week-duration [11-14]. STEP 1, 3 and 4 excluded patients with diabetes, whereas STEP 2 included exclusively patients with type 2 diabetes [11,13-14]. In addition, STEP 2 included a third group of individuals randomized to the smaller anti-diabetic dose of OW semaglutide 1.0 mg [12]. In STEP 1, 2 and 4, all participants receive lifestyle intervention defined as a 500 kcal deficit relative to the estimated energy expenditure plus encouragement of increase physical activity, such as walking 150 minutes per week. In STEP 3 trial, all subjects received a low-calorie diet (1000-1200 kcal/d) provided as meal replacement for the first 8 weeks. Subsequently, they were transitioned to a low-calorie diet (1200-1800 kcal/d) of conventional food. Moreover, they were prescribed 200 min of physical activity/week [13]. The coprimary endpoints of STEP 1 to 3 trials were the percentage change in body weight and weight reduction of at least 5% at week 68 compared with placebo [11-13]. STEP 4 trial was a withdrawal trial that includes an initial run-in period of 20 week during which all subjects received OW semaglutide 2.4 mg followed by randomization to a group that continued the drug and another group that switched to placebo for further 48 weeks [14]. Overview of STEP 1 to 4 trials are summarized in (Tables 1 and 2).

Table 1: Weight-loss efficacy of liraglutide and semaglutide in patients without diabetes.

Lupinepublishers-openaccess-journal-diabetes-obesity

Abbreviations: W: Women; BMI: Body Mass Index; L: Liraglutide; S: Semaglutide; OW: Once Weekly; PL: Placebo; HbA1c: Hemoglobin A1c; CI: Confidence Intervals

Table 2: Weight-loss efficacy of liraglutide and semaglutide in patients with type 2 diabetes

Lupinepublishers-openaccess-journal-diabetes-obesity

Abbreviations: PL: Placebo; W: Women; HbA1c: Hemoglobin A1c; L : Liraglutide; OWS: Once-Weekly Semaglutide

Weight loss in Semaglutide and Liraglutide Trials

While no head to head trials are available to compare weight loss efficacy of OW semaglutide 2.4 mg with OD liraglutide 3.0 mg, indirect comparison may be inferred from results of their respective trials. In fact, as shown in tables 1 and 2, subjects’ characteristics at baseline in these trials were similar to a great extent (Table 1). In addition, the study protocols and designs have several common features (e.g. similar primary end point). In STEP trials 1, 3 and 4 that excluded patients with diabetes, the difference in weight loss between OW semaglutide and placebo ranged between -10.3% and -12.4% at 68 weeks (Table 1). Meanwhile, in the SCALE Obesity and prediabetes trial of OD liraglutide 3.0 mg, the corresponding difference was -5.4% (95% CI, -5.8 to -5.0%) at 56 weeks (Table 1) [15]. In trials that exclusively recruited patients with type 2 diabetes, the weight loss efficacy of both drugs was diminished, but was still relatively greater in OW semaglutide 2.4 mg than with OD liraglutide 3.0 mg. Thus, in 2 liraglutide diabetes trials, the mean difference in weight loss between the drug and placebo was -4.0 and -4.3%, whereas the corresponding difference was -6.2% with OW semaglutide 2.4 mg (Table 2) [12,16-17]. The explanation of this finding is unclear but might be related to the coexistence of type 2 diabetes, relatively older patient population (mean age approximately 55 year-old in diabetes trials versus 45 year-old in trials excluding diabetes), or the lower baseline body weight (approximately 99.8 kg in diabetes trials versus approximately 105.5 kg in non-diabetes trials) (Tables 1-2) [12,16-17]. Other parameters that suggest superiority of OW semaglutide 2.4 mg over OD liraglutide 3.0 mg are the proportions of individuals losing ≥ 5% and > 10% of body weight. These proportions were always higher in trials of semaglutide than in those of liraglutide (Tables 1 and 2).

Head to Head Trials of Semaglutide Versus Liraglutide

Another indirect line of evidence suggesting greater efficacy of semaglutide compared to liraglutide may be derived from 3 randomized head to head trials comparing the 2 agents in different doses and formulations. A randomized, placebo-controlled, doubleblind trial [18] compared semaglutide in 5 daily subcutaneous doses (0.05, 0.1, 0.2, 0.3, and 0.4 mg) versus liraglutide 3.0 mg once daily on top of lifestyle changes in obese subjects without diabetes. After 52 weeks, mean weight reduction from baseline was significantly greater in patients randomized to semaglutide doses ≥ 0.2 mg daily being - 11.2 to -13.8% versus -7.8% in subjects randomized to liraglutide 3.0 mg daily [18]. The second trial including patients with type 2 diabetes [19] compared oral semaglutide (14 mg qday) with OD liraglutide 1.8 mg in doubleblind double-dummy fashion. After 26 weeks, oral semaglutide resulted in superior weight loss (-4.4 kg) compared with liraglutide (-3.1 kg), estimated difference -1.2 kg (95% CI, -1.9 to -0.6, P= 0.001) [19]. The third trial [20] compared OW semaglutide 1.0 mg with liraglutide 1.2 mg in patients with type 2 diabetes in an open-label design. After 30 weeks, mean weight loss was -5.8 kg and -1.9 kg, in the semaglutide and liraglutide groups, respectively; estimated treatment difference -3.8 kg (95% CI, -4.47 to -3.09, P<0.0001) [20]. Taken together, the results of the preceding 3 trials suggest higher efficacy of semaglutide than liraglutide irrespective of doses or drug formulation (i.e. subcutaneous or oral semaglutide).

Anti-Hyperglycemic Efficacy of Liraglutide Versus Semaglutide

The difference between semaglutide and liraglutide with respect to their anti-hyperglycemic efficacy is not as consistent as in their weight-loss effects. Thus, in the studies conducted by O’Neil et al, [18] and Pratley et al [19], semaglutide was similar to liraglutide in HbA1c reduction. Meanwhile, in the trial conducted by Capehorn et al, [20], OW semaglutide 1.0 mg was superior to liraglutide 1.2 mg qday; estimated treatment difference in HbA1c reduction was - 0.69% in favor of semaglutide. However, the latter trial is limited by its open-label design and using liraglutide in submaximal antidiabetic dose (1.2 mg instead of 1.8 mg) [20]. Therefore, while semaglutide may be more effective than liraglutide in causing weight loss, both GLP-1 RAs may be equally effective in terms of glycemic control.

Effects of Semaglutide and Liraglutide on Cardiovascular Variables

Significant reduction in systolic blood pressure (SBP) was recorded in subjects randomized to semaglutide in STEP 1-3 trials, approximately 4-5 mmHg lower than in individuals randomized to placebo [11-13]. Likewise, a significant reduction in DBP of approximately 2 mmHg was observed in STEP 1 and 3 trials [11,13]. Changes in lipid panel were generally mild. Thus, reduction in plasma triglycerides of 14-17% compared to placebo was the most consistent change in lipid panel. Minor reductions in concentrations of low-density lipoprotein-cholesterol (LDL-C) (by ≤7% vs placebo) and increase in high-density lipoprotein-cholesterol (HDL-C) levels (by <5% vs placebo) were also observed. In addition, there was significant reduction in the inflammatory marker C-reactive protein (CRP) levels in semaglutide-treated subjects vs placebo [11-13]. Similar beneficial changes in the above cardiovascular (CV) markers were described in liraglutide trials albeit they were lesser in magnitude [15,21]. The above favorable changes in blood pressure, lipids and CRP are likely attributed to weight loss per se and are unlikely to be direct effects of semaglutide or liraglutide.

Safety of Liraglutide and Semaglutide as Anti-Obesity Agents

Gastrointestinal Adverse Effects

Gastrointestinal (GI) adverse effects represent the most common adverse events that characterize all GLP-1 RAs. In liraglutide obesity trials, GI adverse events occurred in 65% and 39% of subjects randomized to OD liraglutide 3.0 mg and placebo, respectively [16]. In STEP 1-3 trials of semaglutide, GI adverse effects were reported by approximately 63-83% and 34-63% in subjects randomized to OW semaglutide and placebo, respectively [11-13]. Among the GI adverse effects, nausea was the most common, followed by diarrhea, vomiting and constipation [11-13,16]. The frequency of GI symptoms increased early in the first few weeks during drug titration. They were generally described as mild to moderate and transient. However, in a minority of patients, they can be severe. In fact, GI adverse effects were the most frequent cause of premature drug withdrawal. Thus, in the largest obesity trial of liraglutide, drug discontinuation due to GI adverse effects occurred in 6.4% and 0.7% in the liraglutide and placebo group, respectively [15]. In STEP trials, withdrawal due GI adverse events occurred in 3.4-4.5% and 0-1.0% in patients randomized to OW semaglutide and placebo, respectively [11-13]. Previous trials including patients with type 2 diabetes using OW 1.0 mg semaglutide have shown that GI adverse effects tend to be more common with semaglutide compared with other GLP-1 RAs [1]. Meanwhile, post-hoc analysis by Lingway et al [1] suggest that GI adverse effects contribute minimally (less than 0.1 kg) to the superior weight loss effects of semaglutide vs other GLP-1RAs. Incidence of cholelithiasis and cholecystitis was slightly higher with liraglutide than placebo, 1.5% and 0.4%, respectively [15] as well as with semaglutide than with placebo, 2.5-2.6% versus 0-1.2% [11-13]. These events may be attributed in part to weight loss, but other mechanisms could be involved such as inhibition of gallbladder contraction and biliary motility [22]. Frequency of acute pancreatitis is marginally elevated with OD liraglutide 3.0 mg (1.3% vs 1.0 in placebo) [21], and similar to placebo in trials of OW semaglutide 2,4 mg in STEP 1 to 4 trials [11-14].

Hypoglycemia

Consistent with the glucose-dependent action of GLP-1 RAs, frequency of hypoglycemia was similar to placebo in patients without diabetes. However, in obesity trials including patients with type 2 diabetes, frequency and severity of hypoglycemia were increased with use of OD liraglutide 3.0 mg (87 versus 31 events per patients-year with placebo) [16]. These hypoglycemia events occurred mainly in patients using sulfonylureas [16]. In STEP 2 trial, severe or blood-glucose confirmed symptomatic hypoglycemia occurred in 5.7% and 3.0% of patients receiving OW semaglutide 2.4 mg and placebo, respectively [12].

Safety Concerns about Liraglutide and Semaglutide

There was numerical increase in breast neoplasms in association with OD liraglutide 3.0 mg. Thus, 10 premalignant and malignant neoplasms were reported in 9 women in the liraglutide arm versus none in the placebo arm [21]. In STEP 4 trial of OW semaglutide 2.4 mg, 3 breast cancers were diagnosed in women randomized to semaglutide versus none in the placebo group [13]. Worsening diabetic retinopathy seems to be an adverse effect specific to semaglutide which was initially observed in association with use of OW semaglutide 0.5-1.0 mg [23]. In STEP 2, there was a trend towards increase in incidence of retinal disorder events in the 2 semaglutide arms compared with the placebo arm [12]. Thus, these events occurred in 6.9%, 6.2%, and 4.2% in patients randomized to OW semaglutide 2.4 mg, OW semaglutiude 1.0 mg, and placebo, respectively [12].

Appraisal of Liraglutide and Semaglutide

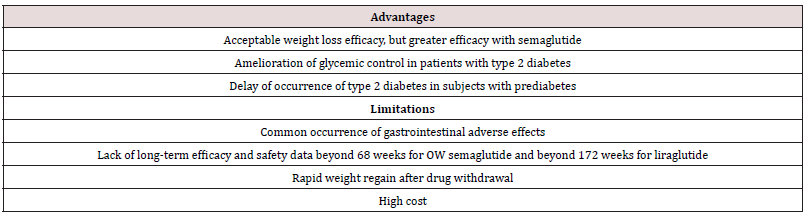
Although available data suggest that OW semaglutide 2.4 mg may be more effective than daily liraglutide 1.8 mg in weight reduction, both drugs offer several advantages for management of obesity. First, their short-term efficacy and safety are supported by well-designed randomized trials [11-15]. Second, being also wellstudied as anti-diabetic drugs, they may be particularly useful in obesity-related type 2 diabetes by causing reduction of both body weight and hyperglycemia [12]. Furthermore, in individuals with pre-diabetes, they delay the onset of type 2 diabetes and increase reversion to normoglycemia [15,21]. The OW administration of semaglutide might virtually enhance compliance with prolonged use. However, both agents have several limitations. First, the common occurrence of GI adverse effects which not uncommonly lead to drug discontinuation. Second, safety beyond 58 weeks is not available for OW semaglutide 2.4 mg [11-14]. The ongoing STEP 5 may in part clarify this problem as it extends over a 2-year period [5]. In case of OD liraglutide 3.0 mg, safety data from placebocontrolled trials are overall reassuring and extend up to 172 weeks [21]. Third, the durability of the weight loss effect is still unclear. In fact, maximum weight loss with use of either drug was achieved after approximately 52 weeks followed by a gradual rebound [11- 15, 21]. Moreover, after drug cessation, weight regain takes place at a more rapid pace along with rise of systolic blood pressure and glycemic parameters to their baselines [14,16]. Hence, these drugs will be taken for years, or even decades as long as weight loss is desired. It is crucial therefore to establish their long-term safety. Fourth, drug cost is another limitation. Advantages and limitations of both agents are summarized in Table 3.

Table 3: Advantages and limitations of liraglutide and semaglutide for treatment of obesity.

Lupinepublishers-openaccess-journal-diabetes-obesity

Conclusions and Current Directions

Available clinical trials suggest that OW semaglutide 2.4 mg as an adjunct to healthy life-style changes may be more effective than OD liraglutide 3.0 mg in terms of weight reduction, but not glycemic control. While no head to head comparison is available yet, data derived from respective trials of liraglutide and semaglutide showed superior weight loss with use of OW semaglutide 2.4 mg. Furthermore, head to head comparison of the 2 drugs used in different doses or formulations, consistently showed greater weight loss associated with the use of semaglutide than with liraglutide. However, the superiority of OW semaglutide 2.4 mg will only be confirmed by direct head to head comparison with OD liraglutide 3.0 mg in the setting of randomized, double-blind and double-dummy trials. The possible increase in incidence of breast cancer in association with these 2 agents must be clarified in long-term studies and post-marketing investigations. Similarly, risk of worsening of diabetic retinopathy in relation to the use of semaglutide should be carefully examined. Whereas both drugs in their anti-diabetic doses may reduce CV events in patients with type 2 diabetes, it is equally important to assess their impact on CV outcomes when used in their higher doses for treatment of obesity. In this regard, the SELECT study is an ongoing, double-blind placebo-controlled trial specifically designed to examine the effect of OW semaglutide 2.4 mg on CV outcomes in overweight and obese persons with established CV disease who do not have diabetes [17]. SELECT study started in November 2018 and is expected to recruit 17,500 participants, and last for approximately a total of 59 months

Conflict of Interest

The author does not have any conflict of interest to declare.


Read More About Lupine Publishers Journal of Diabetes & Obesity Please Click on the Below Link: 

https://diabetes-obesity-lupine-publishers.blogspot.com/


Wednesday, 28 June 2023

Lupine Publishers | Effectiveness, Safety and Therapeutic Adherence of Weekly Subcutaneous Semaglutide for Weight Management in Real Practice: An Observational Study

 Lupine Publishers | Archives of Diabetes & Obesity


Abstract

Aims: To evaluate in a real practice setting effectiveness, safety and adherence to weekly subcutaneous semaglutide for weight reduction, along with diet and lifestyle modifications in obese/overweighted patients attending an Obesity Unit.
Materials and Methods: In a retrospective study, 367 patients (mean age 50.25 years, 78.36% female, mean baseline body mass index 32.39 kg/m2) were followed for 10.7 months (median) after initiation of semaglutide. Up to 24.25% of patients were previously on GLP-1 analogue therapy (mostly liraglutide) and 36.26% used background oral medication for weight loss.
Results: At final office visit patients averaged a weight loss of 7.97±3.42 kg (9.13±3.86% baseline body weight) and 88.07% and 30.27% of patients had achieved a≥5% and ≥10% weight loss, respectively, as compared to baseline body weight. Up to 61.19% and 33.46% of patients maintained 0.5 and 1.0 mg dose, respectively and 86.18% of patients persisted on sc semaglutide by last office visit. Nausea and abdominal pain were reported by 12.53% of patients with no severe adverse events. Background antiobesity medication did not affect weight loss and patients on previous GLP-1 analogue therapy lost 1.43 kg less than naïve patients (p<0.001).
Conclusions: Out-of-label weekly administration of sc semaglutide 0.5 to 1.0 mg resulted in a significant, safe and affordable weight loss in a pragmatic setting without reimbursement of treatment cost. Magnitude of weight loss and safety profile was in line with preliminary data from a phase 2 trial, although this will need to be confirmed by an ongoing phase 3 development programme.

Keywords: Observational Study; Obesity Therapy; GLP-1 Analogue; Semaglutide; Appetite Control Antiobesity Drug

Introduction

Obesity has become a major public health issue worldwide, and its prevalence is growing so uncontrolled that over the past 20 years, the rate of obesity has risen three-fold and is affecting more than 30% of population in some European countries [1]. Major health institutions recognize now obesity as a complex, multifactorial condition [2,3], associated to a number of comorbidities, including metabolic, mechanical and mental health complications that significantly impact both quality of life [4,5] and life expectancy of affected population [6]. On the other side, treatment cost of complications derived from obesity represents a formidable burden for health public systems in many countries [7,8]. Conversely, a weight loss of 5-10% of body mass reduces obesity-related complications and improves quality of life [9,10], although this goal is difficult to achieve and maintain only with diet and lifestyle interventions [11,12]. Few safe and effective drugs are currently available for the treatment of obesity. Among them, glucagon-like peptide 1 (GLP-1) receptor agonists have proven a combined effect on glucose metabolism and reduction in body weight associated to favourable outcomes in patients with type 2 Diabetes and coexisting obesity, including reduction of cardiovascular events for some of them [13-15].
Liraglutide, a once daily administered GLP-1 analogue was initially approved for treatment of patients with type 2 Diabetes at a dose of 1.2 to 1.8 mg, and subsequently gained approval for weight reduction in many countries, at a maximum daily dose of 3.0 mg, in combination with diet and lifestyle modifications [16-17]. Subcutaneous (sc) semaglutide, a longer-acting GLP-1 analogue was approved in Spain in 2019 for treatment of type 2 Diabetes with a weekly administration of 0.5 or 1.0 mg, and conditions for reimbursement by Spanish public health system include coexistence of obesity. Both drugs have proven clinically significant weight reductions in obese patients without type 2 Diabetes and a clinical development program is currently undergoing aiming to gain indication for sc semaglutide in weight management [18-19]. In this observational retrospective study, performed under real practice conditions, we aimed to evaluate effectiveness, safety and adherence to weekly administration of sc semaglutide in a nonreimbursed setting in patients with obesity or overweight attending an Obesity Unit in a private institution in Mallorca (Spain), along with dietary and lifestyle recommendations.

Patients and Methods

In this retrospective study, patients attending our Obesity Unit who started on sc semaglutide since May 2019 were consecutively invited to take part in the study and after giving written informed consent, were included for analysis. Inclusion criteria were patients 18-year-old or older, with a body mass index (BMI) >25 kg/m2, and at least one follow-up office visit after initiation of sc semaglutide. A total of four follow-up visits after baseline visit were included in this study, to ensure for at least a 6-month follow-up period. Patients with a previous diagnosis of type 2 Diabetes Mellitus were excluded from participation in this study. The study protocol was approved by the reference Hospital Ethics Committee (University Hospital Son Espases).
A total of 372 patients were consecutively included in the study. All patients were prescribed sc semaglutide with an out-of-label indication for weight reduction, as part of a structured program for the management of overweight and/or obesity that included diet and exercise counselling. A number of patients had been previously or currently prescribed drugs with an approved indication for weight management (GLP-1 analogue liraglutide and lipase inhibitor orlistat) or a clinical indication for weight management yet out of label, as other GLP-1 analogues (dulaglutide, exenatide LAR), selective serotonin reuptake inhibitors (SSRI), and topiramate. Diet counselling included a structured quantitative dietary recommendation with an average 500 kcal/day reduction from calculated baseline metabolic rate. Standardized Harris-Benedict’s equations corrected for Lang’s daily activity coefficient were used to calculate baseline metabolic rate. In line with Spanish Health Authorities policy, sc semaglutide prescription for overweight or obesity management is not reimbursed, and all patients paid for this out-of-pocket prescription accordingly.
Height, weight, and BMI were recorded as baseline variables at initial visit. Also, concomitant use of drugs with a potential to reduce weight including topiramate, orlistat, SSRIs and current or previous use of other GLP-1 analogues in the last 6 months previous to index date was also registered. At initial visit, sc semaglutide was started at a dose of 0.25 mg once weekly according to label instructions, but subsequent dose titration was left to physician’s judgement based upon effectiveness and Gastrointestinal (GI) intolerance (namely, incidence of nausea, vomiting or abdominal pain). Patients in this unit are regularly followed-up with office visits every 4-12 weeks, and weight, current sc semaglutide dose, use of background medications for weight loss, incidence of adverse events and persistence on sc semaglutide were systematically recorded at each visit and included for analysis. Safety data included serious adverse events, incidence of GI intolerance and incidence of other adverse events.
Primary effectiveness outcome in this study was absolute and percentage weight loss from baseline after initiation of sc semaglutide until last follow-up visit. Secondary objectives included persistence on sc semaglutide and drug dose, evaluated at each follow-up visit, incidence of non-serious/serious adverse events and/or GI adverse events, proactively requested to patients, and change in background use of drugs for weight loss. Subgroup analysis evaluated influence of previous GLP-1 analogues therapy and background use of anti-obesity drugs in weight loss.

Statistical Analysis

Primary and secondary outcomes analysis was performed for patients attending the last office visit. Subgroup analysis for previous use of GLP-1 analogues and use of anti-obesity medication included all patients with at least one follow-up office visit (last observation carried forward). All data are expressed as mean ± Standard Deviation (SD) for continuous variables and as percentage for categorical variables. Normally distributed variables were compared using two-sided T-Student test and categorical variables were compared using Chi-square test. A p value <0.05 was assumed as statistically significant for all comparisons (Statplus statistical package 2016©, AnalystSoft, Walnut, CA).

Results

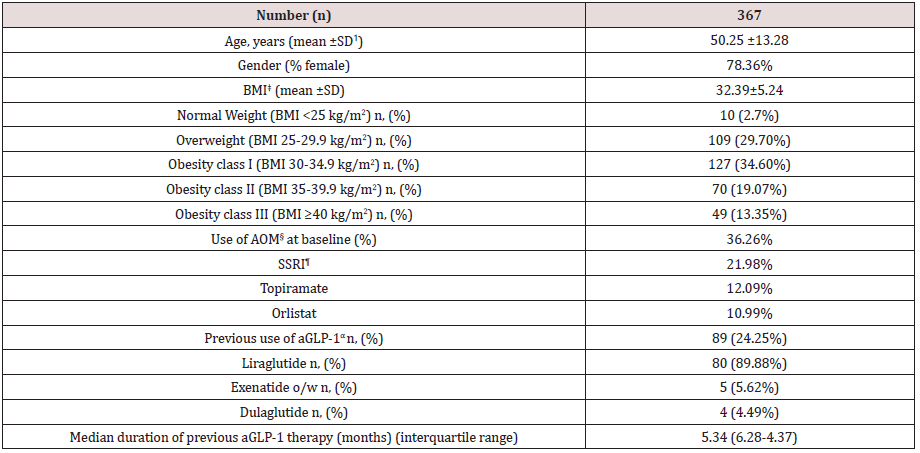
Table 1 shows baseline characteristics of patients included in this study. A total of 367 patients completed a first follow-up visit. On average, patients had a mean age of 50.25 years and a wide majority of them were females (78.36%). Mean BMI was 32.39±5.24 kg/ m2, with a balanced distribution among patients with overweight (29.7%), class I obesity (37.32%) class II and III obesity (together, 32.42%). Up to 36.26% patients were on previous pharmacological treatment for obesity, mostly SSRI agents, topiramate and orlistat, and up to 24.25% of this population initiated sc semaglutide switching from a previous GLP-1 analogue therapy, either currently in use or in the previous 6 months. In most cases (89.88%) previous GLP-1 analogue was liraglutide with an average daily dose of 1.48 mg. Median duration of previous aGLP-1 therapy was 5.34 months and mean (±SD) weight reduction achieved was 3.25 ±5.32 Kg (Table 2). Up to 32.01% of patients in this subgroup had achieved a ≥5% weight loss with previous aGLP-1 therapy.

Table 1: Baseline characteristics of patients.
lupinepublishers-openaccess-journal-diabetes-obesity

ꝉSD: Standard Deviation ‡BMI: Body Mass Index §AOM: Anti-obesity Medication ¶SSRI: Selective Serotonine Re-uptake Inhibitor αaGLP-1: Glucagon-like Peptide 1 against.

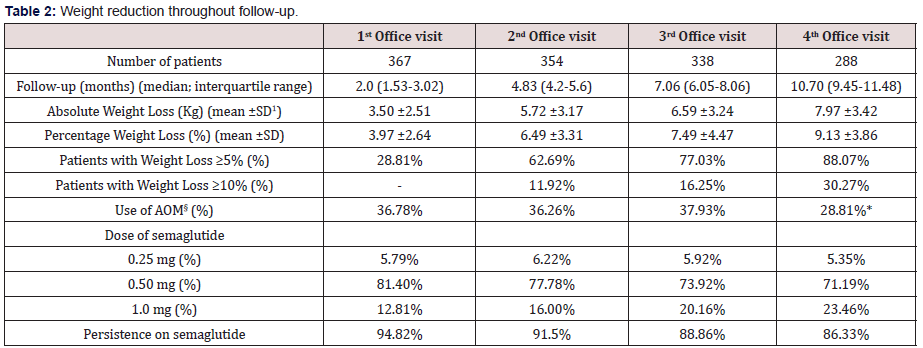
Table 2: Weight reduction throughout follow-up.
lupinepublishers-openaccess-journal-diabetes-obesity

ꝉSD: Standard Deviation §AOM: Anti-obesity Medication *p<0.05 vs. baseline (Chi-square test)

Weight Reduction

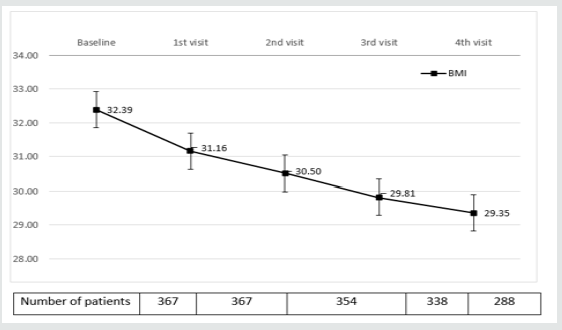
Table 3 and (Figures 1&2) show changes in BMI and body weight throughout consecutive office visits. After a median followup of 10.7 months up to 311 patients attending the last office visit, achieved a weight loss of 7.97±3.42 kg (9.13±3.86% of baseline body weight), and weight loss was achieved gradually in a timedependent fashion. By the end of study observation period, 88.07% and 30.27% of patients had achieved a ≥5% and ≥10% weight loss, respectively, as compared to baseline body weight.

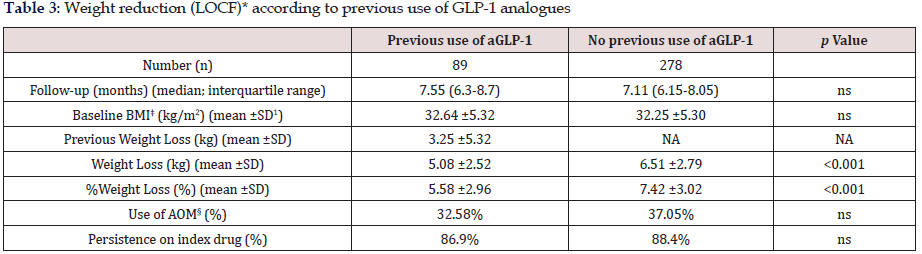
Table 3: Weight reduction (LOCF)* according to previous use of GLP-1 analogues
lupinepublishers-openaccess-journal-diabetes-obesity

*LOCF: Last observation carried forward ꝉSD: Standard Deviation ‡BMI: Body Mass Index §AOM: Anti-obesity Medication

Figure 1: Evolution of BMIα after initiation of sc Semaglutide*. αBMI: Body mass index expressed in Kg/m2 *Expressed as median values. Bars represent ± standard deviation.
lupinepublishers-openaccess-journal-diabetes-obesity

Figure 2: Absolute and Percentage weight loss after initiation of sc semaglutide*. *Expressed as median values. Bars represent ± standard deviation.
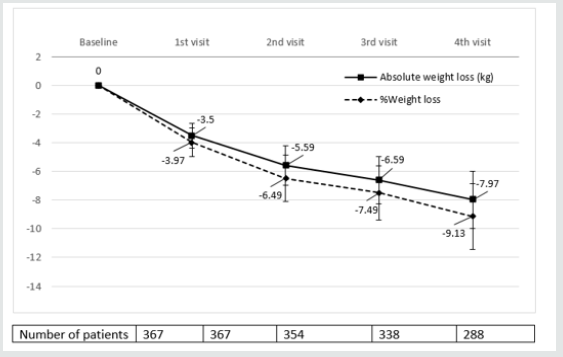
lupinepublishers-openaccess-journal-diabetes-obesity

Tables 3 and 4 show changes in body weight according to previous use of GLP-1 analogue therapy and concomitant use of anti-obesity drugs, respectively. As stated before, up to 24.25% patients had switched to sc semaglutide from treatment with a GLP-1 analogue in the previous six months, mostly liraglutide. This subgroup of patients had achieved a previous weight reduction of 3.25 ±5.32 Kg after a median follow-up of 5.34 months (interquartile range, 4.12-6.57 months). Patients without previous use of a GLP-1 analogue, reduced significantly more weight than patients switching from a previous GLP-1 analogue to sc semaglutide, after a similar follow-up period (last observation carried forward); 6.51±2.79 kg (7.42% of baseline body weight) vs. 5.08±2.52 kg (5.58%), respectively (p<0.001). No differences were found for concomitant use of other anti-obesity medications and persistence on sc semaglutide was quite similar between both groups (Table 3). Conversely, sub analysis of weight reduction according to concomitant use of any anti-obesity medication did not yield any significant differences between both subgroups, neither in baseline BMI, nor in the magnitude of weight loss (last observation carried forward), or in the persistence on sc semaglutide (Table 4).

Table 4: Weight reduction (LOCF)* according to previous use of anti-obesity medication

lupinepublishers-openaccess-journal-diabetes-obesity

*LOCF: Last observation carried forward ꝉSD: Standard Deviation ‡BMI: Body Mass Index

Table 5: Safety and tolerability of sc semaglutide

lupinepublishers-openaccess-journal-diabetes-obesity

*GI (Gastrointestinal) intolerance included nausea, vomiting, abdominal pain or diarrhoea. ꝉOne patient admitted to hospital for urinary sepsis, one patient diagnosed of gross bowel cancer and one patient with myocardial infarction.

Therapeutic Persistence, Drug Dose and Background Anti-Obesity Medication Use

A total of 311 patients did attend the fourth and last office visit included in this study (84.74%). Persistence on sc semaglutide was high throughout consecutive office visits, with up to 268 patients out of 311 (86.18%) attending the last office visit being persistent to the drug. Up to 61.19% of patients remained on an initially prescribed semaglutide dose of 0.5 mg (after initial up titration) throughout consecutive office visits and 33.46% of patients were on the 1.0 mg dose by the last office visit. Concomitant use of other anti-obesity drugs remained unchanged throughout follow-up visits, and only in the last office visit a statistically significant 7.45% reduction in use of other agents was detected, mostly affecting orlistat use.

Safety and Tolerability

Regarding safety, few severe adverse events were reported throughout the follow-up period. A 66 year-old female was admitted to hospital due to urinary sepsis, a morbid obese 54 year-old male patient was diagnosed of gross bowel cancer requiring surgery and a 61 year-old patient suffered a non-lethal myocardial infarction. Additionally, a patient accidentally administered 5 consecutive daily doses of 0.25 mg of sc semaglutide and reported on nausea and vomiting during two days, but her condition improved after stopping the medication, and after two weeks, the patient resumed correctly weekly administration of sc semaglutide. A total of 66 patients (17.98%) complained on GI symptoms at initial follow-up visit, and this percentage did reduce significantly in subsequent follow-up visits (Table 5). Most of these patients complained of nausea and abdominal pain, that in some cases deserved transient interruption of medication or use of omeprazole, and in 14 patients led to definitive interruption of medication. Other reasons for treatment abandonment included lack of effectiveness or inability to afford for treatment costs, as reported by up to 19 patients. A patient with a baseline BMI of 42.3 kg/m2 was derived to bariatric surgery after 3 months of sc semaglutide 1.0 mg, with a weight loss of 5.3 kg from baseline.

Discussion

In this observational study we evaluated weight reduction associated to out-of-label use of sc semaglutide in a patient population with overweight or obesity as part of a pragmatic strategy for weight management including diet and physical activity counselling, and in selected cases prescription of drugs with a potential for weight loss. Patients included in this study represent an average profile of patients typically attending an obesity clinic in a private setting; middle aged patients with a high proportion of women and an average baseline BMI >30 kg/m2. Conversely, we found a lower percentage of patients with morbid obesity, as compared to Spanish public health system obesity units, were most patients are morbid obese and referred to for consideration of bariatric surgery [20]. A substantial proportion of patients included in this study were previously on pharmacological therapy for weight loss. In Spain, according to the 2016 official position statement by the Spanish Society for the Study of Obesity (SEEDO) [21], only lipase inhibitor orlistat, combination of opioid receptor antagonist/antidepressant naltrexone/bupropion and GLP-1 agonist liraglutide are approved drugs for medium and longterm obesity management in patients with a BMI >30 kg/m2 or >27 kg/m2 with major comorbidities, when a structured program including diet and lifestyle changes fails to promote a weight loss >5% after 3 to 6 months of follow-up. Conversely, the 2016 clinical practice guidelines for medical care of patients with obesity issued by the American Association of Clinical Endocrinologists and the American College of Endocrinology (AACE/ACE) [22] include lorcaserin, phentermine/topiramate ER (extended release) combination and SSRI therapy for selected patients as medications for chronic weight management.

Taking in mind the strong correlation between obesity and depressive mood disorder [23,24], it is not surprising that up to 21.98% of our patients were on SSRI (mostly fluoxetine) and in some cases with a coexisting indication for binge eating disorder or night eating syndrome. Eighty-nine patients in this study were using or had used in the past six months a GLP-1 analogue for weight reduction. Liraglutide was by far the most frequently used drug with an average daily dose of 1.48 mg which is lower than the approved dose of 3.0 mg od for weight reduction. Lack of reimbursement by Spanish public health system for liraglutide in obese subjects plays probably an important role in this low average dose used by patients, as treatment cost is directly dose-dependent. This issue has been acknowledged as a mayor limitation for treatment accessibility in our country, as stated by SEEDO guidelines [21]. Nevertheless, despite this low dose, patients on liraglutide achieved an average weight loss of 3.25 kg, accounting for >3% of baseline weight, after a median period of 5.34 months. Interestingly, the clinical development program for liraglutide LEAD (Liraglutide Effect and Action in Diabetes) included 4,456 patients with type 2 Diabetes with an average baseline BMI of 31.83 kg/m2, and age 55.87 years old. Weight loss associated to liraglutide 1.2 and 1.8 mg ranged 2.3 to 2.8 kg, respectively, after 26 to 52 weeks [25-30]. A similar baseline BMI in an older population was associated to a lower weight loss as compared to patients in our study. A possible explanation for this could be differences in age, as Mezquita et al., demonstrated in their liraglutide survey Diabetes Monitor [31]. In this real-world web-based survey, patients with type 2 Diabetes under 50 years old lost significantly more weight as compared to patients over 60 years old. Nevertheless, potential differences in the response to GLP-1 analogues in a population without Diabetes cannot be excluded, as clear differences in GLP-1 biology in patients with type 2 Diabetes as compared to normal individuals have been detected [33], namely reduction of GLP-1 secretion in response to oral intake and reduction of insulinotropic potency of GLP-1 [34,35].

Patients in our study gradually achieved a clinically significant weight loss of 7.97 kg by the last office visit, accounting for 9.13% of initial body weight, after a median follow-up of 10.7 months. By the end of the study, 88.07% and 30.27% of patients attending the last office visit included in the observation period had achieved a ≥5% and ≥10% weight loss, respectively. According to SEEDO guidelines [21], a sustained weight loss of 3-5% of body weight is associated to clinically significant improvements in metabolic factors like blood glucose and plasma lipid concentrations, and reduces risk for development of Diabetes, with higher weight loss having the potential to reduce long-term cardiovascular complications. Conversely, AACE/ACE guidelines for obesity management recommend a weight-loss goal of 5-10% (≥15% in some circumstances) to induce improvements of comorbidities associated to overweight or obesity [22].

Interestingly, most patients included in the study remained in the 0.5 mg ow dose, and only 33.46% of patients increased to the 1.0 mg ow dose at any office visit. Again, rather than GI intolerance or perceived effectiveness, we believe that economic constraints play a major role in the capability of patients to afford for higher doses of sc semaglutide. Throughout follow-up, use of other medications with a potential to reduce weight did not experience a substantial change except for last office visit, in which a 7.45% reduction was observed, affecting mostly to orlistat use. A reduction in meal size and fat content to avoid nausea, which is a common advice given to patients on GLP-1 analogues [17,36] could explain this observed reduction in orlistat use.

Persistence on sc semaglutide was high throughout study observation period, with more than 86.33% of patients using the drug by the last office visit after a median of 10.70 months. This persistence is comparable to that observed in a recent publication by our group [37] in patients with type 2 Diabetes in a real-world setting using sc semaglutide under approved indication for glucose management, with a full reimbursement by public health system. As opposed to patients in our study, with an out-of-pocket indication for weight loss, this high persistence is reflecting in our opinion, a high degree of patient’s perceived effectiveness of sc semaglutide for weight reduction. Patients’ satisfaction was not specifically measured in this study but indeed a perception of successful weight management was frequently referred by patients to treating physicians. Additionally, a low percentage of patients complained of GI intolerance, mostly nausea and abdominal pain, and in most cases, these symptoms were mild to moderate in intensity and transient, thus allowing for treatment continuation. Up to 19 patients attending office visits declared inability to afford for treatment cost, despite good tolerance and significant weight loss. Few serious adverse events were seen in this study, none of them with a potential direct relationship to the use of sc semaglutide. Furthermore, overall persistence on sc semaglutide in this study was higher than that reported for other GLP-1 analogues in patients with type 2 diabetes in other real-world setting studies [38,39].

In 2010, Astrup and colleagues published the results of a trial evaluating for the first time, efficacy and tolerability of liraglutide in adult obese patients without diabetes [16]. Patients randomized to 1.2 to 3.0 mg of liraglutide lost 4.8 to 7.2 kg compared with 2.8 kg with placebo after a 20-week follow-up period, setting the evidence for use of liraglutide in obesity. These results represent a deeper weight reduction in obese patients without diabetes, as compared to patients with type 2 diabetes in the LEAD program, and are closer to those observed in the subgroup of patients with a previous treatment with liraglutide in our observational study, despite differences in study design and observation period.

In 2018, O’Neil et al. published the results of a phase 2 trial evaluating efficacy and safety of daily sc semaglutide compared to liraglutide and placebo in 957 obese individuals with a baseline BMI of 39.3 kg/m2 and age 47 years-old [18]. Patients randomized to 0.05 to 0.4 mg of sc semaglutide od lost -6·0% (0·05 mg), -8·6% (0·1 mg), -11·6% (0·2 mg), -11·2% (0·3 mg), and -13·8% (0·4 mg) as compared to -7.8% of initial body weight in patients randomized to liraglutide 3.0 mg od, throughout 52 weeks of treatment. In this study, proportion of patients with ≥5% and ≥10% weight loss vs baseline body weight ranged 54-90% and 19-72%, respectively, across different sc semaglutide doses. In our study, calculated average weekly sc semaglutide dose was 0.59 mg, which results in an estimated daily dose of 0.084 mg, close to the 0.1 mg od dose arm in the study by O’Neil et al., and with similar results in terms of weight loss (9.13% vs 8.6%) and proportion of patients with ≥5% and ≥10% weight loss (88% and 30% vs 67% and 37%, respectively). All sc semaglutide doses were generally well tolerated, with no new safety concerns. The most common adverse events were dose-related gastrointestinal symptoms, primarily nausea, as seen previously with GLP-1 agonists in patients with type 2 Diabetes and rarely led to discontinuation of treatment. No patient complained on symptoms suggesting hypoglycaemic episodes, reassuring the safe use of the drug in a population with normal glucose metabolism. A comprehensive clinical development program, the Semaglutide Treatment Effect in People with Obesity (STEP) program is now undergoing, aiming to investigate the effect of sc semaglutide on weight loss, safety, and tolerability in adults with obesity or overweight. The program comprises 5 randomized clinical trials for which results will be available through 2020- 2021[19]. For all trials, the primary end point is change from baseline to end of treatment in body weight. Participants have a mean age of 46.2 to 55.3 years, are mostly female (mean 74.1%- 81.0%), and have a mean BMI of 35.7 to 38.5 kg/m2.

Our study represents the first published evidence for effectiveness and safety of sc semaglutide with a weekly administration in the management of overweight and obesity in adults without diabetes in a real-world setting. An important point in this study, derived from its observational nature in real practice conditions, is that patients paid for sc semaglutide treatment and still a high percentage of them remained persistent to the therapy. Treatment adherence is one of the major drivers for the gap between efficacy observed in clinical trials and effectiveness found in real practice in chronic conditions like type 2 Diabetes [40], and obesity shares similarities with it, both in their chronic nature and in their pathophysiology. Weight reduction is a strong signal for patients’ perception of effectiveness that reinforces treatment adherence and this is probably one of the reasons for the high treatment adherence found in our study. Undoubtedly, treatment cost and treatment adherence will significantly impact effectiveness of antiobesity drugs in future real-world studies.

Our study has several limitations derived from its real-world descriptive nature. First, the lack of a control group does not allow to assign achieved weight loss to the solely effect of sc semaglutide, although previous evidence from randomized trials shows a similar degree of weight loss associated to the drug. Second, a number of patients were missed from follow-up for weight evolution, so again a selection bias overestimating treatment effect cannot be excluded, being this is a typical limitation of real-world studies. Third, a number of patients were included in this study with current use of other drugs with a potential for weight loss, both oral medications and GLP-1 analogues, so a potential confounding effect of these treatments cannot be completely excluded. Nevertheless, we performed a subgroup analysis where oral anti-obesity medications were not found to impact significantly on weight reduction and conversely, previous use of GLP-1 analogues was associated to a significantly lower weight loss, assuming that part of the potential for weight reduction associated to GLP-1 agonist therapy had already been achieved in those patients. Finally, it is not usual that an observational study reporting on effectiveness and safety of a drug in real practice conditions is published before gaining regulatory approval for the specific indication, as efficacy and mostly safety are important issues that must be first addressed by randomized clinical trials, and the authors deeply acknowledge this fact. Nevertheless, several important questions must be kept in mind in this regard; first, sc semaglutide has been approved by regulatory agencies in most developed countries for use in patients with type 2 diabetes and conditions for reimbursement in Spain include coexisting obesity, which virtually affects most patients with type 2 Diabetes. Second, liraglutide, a GLP-1 analogue with a similar molecular design and pharmacological properties has been approved for weight reduction in patients with obesity and third, given the shortage of effective treatments to treat obesity and the barriers that treatment cost may represent for patients’ accessibility to such therapies, the authors believe that evidence provided by this study is timely, and of scientific interest.

Conclusion

In conclusion, in this observational study in real practice conditions, we have demonstrated that sc semaglutide at a weekly dose of 0.5 to 1.0 mg administered to patients with overweight or obesity in the pragmatic context of a structured program along with diet and lifestyle recommendations resulted in a sustained, safe and affordable clinically significant weight reduction. Given the limitations of a retrospective observational study, we will need to confirm these results with the forthcoming results of the STEP program and contrast them with results from other groups in a real practice setting which for sure will be coming up in future. Until then, we consider that weekly sc semaglutide represents a useful tool for helping patients in their long-term struggle, along with diet and lifestyle changes, to increase their chances to arrive to and maintain a healthy body weight.

Acknowledgements

The authors wish to deeply thank to all patients for their participation in the study.


Read more about Lupine Publishers Journal of Diabetes & Obesity click on the below link:

https://diabetes-obesity-lupine-publishers.blogspot.com/


Tuesday, 8 November 2022

Lupine Publishers| Variability in Plasma FGF21 Levels in Rats Fed A Standard 15% Protein Diet is not Sensitive Enough to Reflect Differences in Protein Requirements

 Lupine Publishers| Journal of Diabetes and Obesity


Introduction

Fibroblast growth factor 21 (FGF21) is a hepatokine member of a subfamily of “fibroblast growth factors” that responds to multiple metabolic stresses as protein deficiency [1-4]. FGF21 is produced in various tissues but the FGF21 circulating form is primarily of hepatic origin [1,2]. FGF21 affects numerous metabolic and behavioural parameters, and in particular, increases appetite for protein in subjects fed a protein-deprived diets [5,6]. In a recent still unpublished study, we observed that plasma FGF21 levels were higher in adult male Wistar rats fed a standard diet, formulated according the AIN93 recommendations for rats’ feed, containing 15% protein by energy [7] than in rats fed a 30% protein diet. In addition, inter-individual variability of plasma FGF21 levels was larger in rats fed the standard 15% protein diet than in rats fed the 30% protein diet. We therefore considered the hypothesis that higher levels and inter-individual variability in plasma FGF21 levels in rats fed a standard 15% protein diet would reflect the variability in protein requirements between individuals and thus, that measurement of plasma FGF21 levels can be used as a simple, rapid, and minimally-invasive test to estimate the adequacy of protein intake.
Dietary self-selection is a method that has been largely used in farm animals and laboratory rodents to study the requirements for macronutrients (carbohydrates, lipids and proteins), vitamins and minerals [8,9]. Many studies using this method, in our lab and others, showed that rats self-selecting between a protein diet and a protein-free diet often ingest up to 30-50% of total energy intake as protein [10-15], so much higher than the level considered as sufficient for an optimal growth in adult rats (10-15% by energy), which comforted our hypothesis that 15% dietary protein was possibly not the optimal dietary content.
The objective of this study was to verify that variability in plasma FGF21 levels in rats fed a standard 15% protein diet was indicative of differences in protein requirements. To this end, we have analyzed the relationship between FGF21 levels, and the level of protein subsequently selected during self-selection between a protein diet and a protein-free diet.

Experimental Procedure

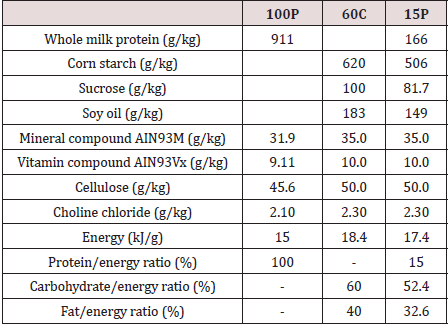
24 adult male rats (215-240g) of the Wistar RccHan strain (ENVIGO) were used and individually housed (22°C ± 1°C, 12/12 L/D, cycle lights on at 08:00). After 1 week of adaptation to the laboratory conditions, the rats were fed for 12 days (Basal period) a standard diet formulated according to the AIN93 requirements [7] that contained 15% protein (15P); then, for 28 days (Choice period), 6 rats (Control group) continued to be fed with the standard diet and 18 (Self-selecting group) were given a choice between a pure protein diet (100P) and a protein-free diet containing a mix of fat (soy oil) and carbohydrate (corn starch and sucrose) in which carbohydrate amounted 60% by energy. The diets were provided, as necessary.

The food pellets were prepared twice a week by mixing the macronutrients, vitamins, and mineral mix with the amount of water required to make a thick dough. Food intake (g/day) was measured twice a week and converted in kJ/day based on the energy content of the diets (Table 1).

Table 1: Composition and energy content of the 3 used diets.

lupinepublishers-openaccess-journal-diabetes-obesity

100P: diet containing only proteins; 60C: protein-free diet containing only lipids and carbohydrates and in which carbohydrates amounted 60% by energy; 15P: standard diet containing 15% of protein by energy.

Blood samples (0.5 mL) were collected from the tail vein in EDTA tubes: once during the basal period and once during the choice period. Blood collection was made in the morning (10:00- 12:00) in rats that were not previously fasted. Blood samples were centrifuged (5000g, 15min, 4°C) and the plasma stored at -20°C. Plasma FGF21 levels (pg/ml) were measured by ELISA tests using commercial kits from Bio Vendor (Mouse/Rat FGF-21 ELISA RD291108200R).

Statistical Analysis

Statistical tests were performed using RStudio software, 2015. Changes in protein intake and plasma FGF21 level were compared using mixed two-factor ANOVA tests (parameter ~ group*period), which were followed by the main effects analysis by Bonferroni adjusted pairwise comparisons. Values are presented as means ± standard error of the mean (SEM). Linear regression analysis was used to study the link between plasma FGF21 levels during the basal period and protein intake during the choice period and was performed using Excel software. Significance of correlations was assessed using the Pearson correlation coefficient. A threshold of P≤0.05 was chosen as significant.

Results and Discussion

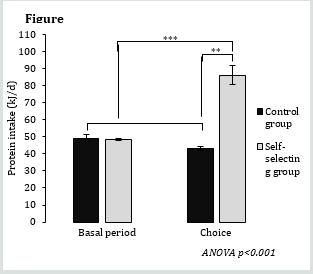
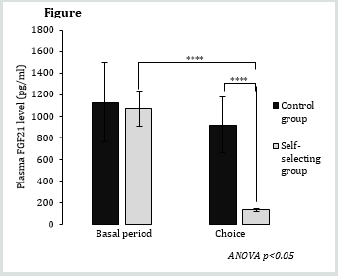
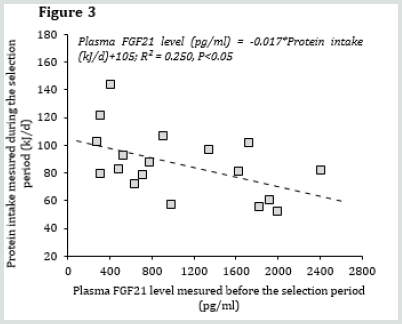
Protein intake was similar between the control and selfselecting group during the basal period but increased by 80% in the self-selecting group during the choice period (+37.8 kJ/d, p<0.0001) (Figure 1). This response significantly increased the contribution of protein to total energy intake from 15.0% to 23.5% (p<0.001). Mean plasma FGF21 levels averaged ~1,100 pg/mL in both groups during the basal period and decreased to 131 pg/mL in self-selecting group during the choice period (P<0.001) (Figure 2). Finally, contrary to our hypothesis, not only did we not observe a positive correlation between plasma FGF21 levels during the basal period and protein intake during the choice period, but instead we observed a weak and inverse correlation (Figure 3).

Figure 1: Protein intake (kJ/d) according to diet group and period.
(*:0.05; **:0.01; ***:0.001; ****:0.0001) Values are represented as means ±SEM, only the p-value of the interaction of ANOVA tests are indicated.

Lupinepublishers-openaccess-journal-diabetes-obesity

Figure 2: FGF21 level in plasma (pg/ml) according to diet group and period.
(*:0.05; **:0.01; ***:0.001; ****:0.0001) Values are represented as means ±SEM, only the p-value of the interaction of ANOVA tests are indicated.

Lupinepublishers-openaccess-journal-diabetes-obesity

Figure 3: Protein intake (kJ/d) during the choice period as a function of plasma FGF21 levels during the basal period in the self-selecting group.

Lupinepublishers-openaccess-journal-diabetes-obesity

Conclusion

In conclusion, inter-individual variability in plasma FGF21 levels in rats fed a standard 15% protein diet did not appear to be a parameter sensitive enough to reflect inter-individual differences in protein requirements. Therefore, plasma FGF21 level cannot be used as a test to determine inter-individual variability in protein requirements in individuals. Nevertheless we observed that plasma FGF21 levels in P15 fed rats were ~7 fold higher than in selfselecting rats ingesting 23.5% protein, which points on the fact that changes in plasma FGF21 levels are very sensitive to dietary protein intake, even when protein intake is well above essential protein requirements (~8-10 % in adult male rats).

Read More About our Lupine Publishers Journal of Diabetes and Obesity Please Click on Below Link: 
https://diabetes-obesity-lupine-publishers.blogspot.com

Tuesday, 8 March 2022

Lupine Publishers| Type 2 Diabetes and Hypertension among Saudi Patients with Obesity

 Lupine Publishers| Journal of Diabetes and Obesity


Abstract

Background and Objective: Obesity is a major risk factor for non communicable diseases.

Obesity, diabetes and hypertension are so tightly linked. This study aims to determine the frequency of type 2 diabetes and hypertension among obese Saudi population.

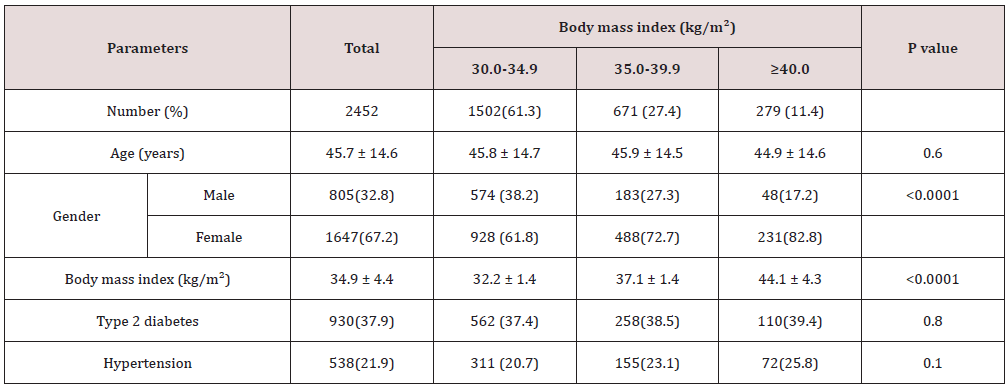
Main results: A total of 2452 participants were studied. The mean age of the study population was 45.7±14.6 years, 46.9±15.3 years for males and 45.1±14.2 years for females. Moreover, the prevalence of males was 805(32.8%) and the prevalence of females was 1647(67.2%) with males to females ratio was 1.00: 2.01. Mean BMI was 34.9±4.4. Type 2 diabetes and hypertension had been diagnosed in 930(37.9%) and 538(21.9%) respectively. In the study population, 1502(61.3%) were obese Grade I, 671 (27.4%) were obese Grade II while 279 (11.4%) were morbidly obese (obese Grade III). Moreover, increased body mass index were strongly linked to females, 61.8%, 72.7% and 82.8% respectively and this was found to be statistically significant (p<0.0001). Moreover, increased with body mass index categories were strongly linked to females and this was found to be statistically significant (p<0.0001). There were no significant differences between different with body mass index grades and mean age, frequency of type 2 diabetes and hypertension. The peaks for all mean and body mass index categories were at age 30–34 years and 50-54 years with higher mean and body mass index categories for females. There were nonsignificant associations between obesity and hypertension or diabetes. In regard to the relationship between body mass index categories and type 2 diabetes and hypertension in different age ranges, it was observed that type 2 diabetes, hypertension and type 2 diabetes associated with hypertension are increasing among 45-49 years and 50-54 years age ranges, with female predominance in those age groups.

Conclusion: This study found the frequency of type 2 diabetes and hypertension was not associated differently between different obesity subclasses. Indeed, weight gain associated with aging seems to further constitutes a threat to public health status in developing societies. Clearly, despite the small sample size, this study has posed important public health issues that require immediate attention from the health authority.

Keywords: Type 2 Diabetes, Hypertension and obesity

Introduction

Obesity is a major risk factor for illness and death [1]. It is defined by a 30 or higher body mass index (BMI) irrespective of whether objectively measured or based on self-report [2]. A BMI of 35 or more with serious comorbidity, or a BMI of 40 or more, is considered morbid obesity. Other definitions of morbid obesity include more than 45.2 kg over the ideal body weight as defined by the 1983 Metropolitan Life Insurance Height and Weight tables or a body weight exceeding 200% of the ideal body weight. There was a 12-fold excess mortality compared with the general population in the 25- to 34-year-old group and 6-fold excess mortality in the 35- to 44-year-old group. The hallmark study in 1980 clearly demonstrated during the course of the study, 25% of the group died [3]. At least 2.8 million adults die each year as a result of being overweight or obese. In addition, 44% of the diabetes burden, 23% of the ischaemic heart disease burden, and between 7% and 41% of certain cancer burdens are attributable to overweight and obesity [4]. Socially, obesity is now perceived as a health problem and a risk factor for many diseases [5]. The Global Burden of Disease 2010 study found that elevated BMI was the leading risk factor for disability-adjusted life years in Saudi Arabia [6].

In 2008, the WHO estimated that at least 500 million adults are obese, over 200 million men and nearly 300 million women were obese [7]. About 11% of adults aged 20 were obese [5]. The prevalence of obesity was highest in the Americas (26%) and lowest in South East Asia (3%) [8]. obesity is increasing in Saudi Arabia, especially in females. The research studies find prevalence of obesity range from 3.8% to 63.6% [9-24]. The current trends and future projections of adult obesity prevalence showed that the overall obesity will increase to 41% in men and 78% in women by 2022 in Saudi Arabia [20].

Severely obese individuals who are 45–90 kg or more or BMI ≥40.0 kg/m2 have on average far more complex health issues and encounter very different challenges in the health care system than the majority of moderately obese individuals (BMI 35.0–39.9). Over the last 3 decades, mean BMI has increased by 0.4 kg/m2 per decade worldwide [25]. According to recent studies, the United States has the highest mean BMI among high income countries, resulting in 1 in 3 adults having a BMI over 30 based on objective measurement or 1 in 4 adults based on self-reported height and weight [25- 27]. The prevalence of moderate obesity may be stabilizing or at least increases are occurring at much smaller rates than prior to 2005 in the US [26-28]. This plateauing may or may not apply to more severe/ morbid obesity. Clinically severe or morbid obesity is not a rare pathological condition afflicting a fixed proportion of the population, nor is it directly coupled to the prevalence of moderate obesity. Instead, severe obesity is part of a population BMI distribution that has become more heterogeneous (a larger proportion of individuals far away from the average) while shifting to the right simultaneously (an increase in mean BMI) [26,29].

Obesity and diabetes are so tightly linked that the American Diabetes Association recommends physicians test for type 2 Diabetes and assess risk of future diabetes in asymptomatic people ≥45 years old simply if they are obese, and regardless of age if they are severely obese [30]. Obesity raises risk of developing type 2 Diabetes by a factor of seven, compared to normal weight [31]. While not every obese individual has diabetes, 80% of those with diabetes are overweight/obese [32]. In Saudis studies, it was shown that the prevalence of obesity was significantly higher in diabetic and hypertensive Saudis compared to the non-diabetic and non-hypertensive controls [33-35]. This study aims to determine the frequency of T2DM and HTN among obese Saudi population.

Methods

For the present study, we analyzed participants who are older than 18 years old. A total of 2452 cases with BMI ≥30.0 kg/m2 were selected to be enrolled for the present study. All patients were from the population of the Primary health and Diabetic Centers at King Fahad Armed Forces Hospital. Participants were defined as having T2DM according to self-report, clinical reports, use of anti diabetic agents and HbA1c (≥6.5) [30]. All data were collected by personal interview and on the basis of a review of electronic medical data. Weight (kg) and height (cm) were measured by physician and nurse interviewers and recorded. Obesity was defined as BMI ≥ 30.0 kg/ m2 [36]. BMI values of ≥30.0 kg/m2 were sub classified into groups as obese Grade I (BMI=30 – 34.9 kg/m2), obese Grade II (BMI=35.0– 39.9kg/m2) and morbidly obese Grade III (BMI≥40 kg/m2). The total number of subjects were separated on basis of age values into 10 groups; <25 years, 25–29 years, 30–34 years, 35–39 years, 40– 44 years, 45–49 years, 50–54 years, 55–59 years , 60–64 years and ≥65 years. Blood Pressure readings were within a gap of 15 minutes using a mercury sphygmomanometer by palpation and auscultation method in right arm in sitting position. Two readings were taken 15 min apart and the average of both the readings was taken for analysis. Hypertension (HTN) was also diagnosed based on anti HTN medications or having a prescription of antihypertensive drugs and were classified as Hypertensive irrespective of their current blood pressure reading or if the blood pressure was greater than 140/90 mmHg i,e systolic BP more than 140 and diastolic BP more than 90 mm of Hg – Report of the American College of Cardiology/American Heart Association Task Force on Clinical Practice Guidelines [37].

Statistical Analysis

Univariate analysis of demographic and clinical laboratory was accomplished using one-way analysis of variance (ANOVA) with post hoc analysis between variables, to estimate the significance of different between groups where appropriate. Unpaired t-test was used to analyze univariate analysis when appropriate. Chi square (X2) test were used for categorical data comparison. The adjusted odds ratio (OR) with a 95% confidence interval (CI) was calculated. All statistical analyses were performed using SPSS Version 22.0. The difference between groups was considered significant when P<0.05.

Results

A total of 2452 participants were studied. The mean age of the study population was 45.7±14.6 years with 46.9±15.3 years for males and 45.1±14.2 years for females. Moreover, the prevalence of males was 805(32.8%) and the prevalence of females was 1647(67.2%) with males to females ratio was 1.00: 2.01, Table 1. Mean BMI was 34.9±4.4kg/m2. T2DM and HTN had been diagnosed in 930(37.9%) and 538(21.9%) respectively. In the study population, 1502(61.3%) were obese Grade I, 671 (27.4%) were obese Grade II while 279 (11.4%) were morbidly obese (obese Grade III). Moreover, increased BMI were strongly linked to females; 61.8%, 72.7% and 82.8% respectively and were found to be statistically significant (p<0.0001), as indicated in Table 1. Moreover, increased BMI categories were strongly linked to females and this was found to be statistically significant (p<0.0001), as indicated in Table 1. There were no significant difference between different BMI grades and mean age, frequency of T2DM and HTN.

Table 1: Characteristics of patients according to body mass index (kg/m²).

lupinepublishers-openaccess-journal-diabetes-obesity

Data are means ± SD or number (%)

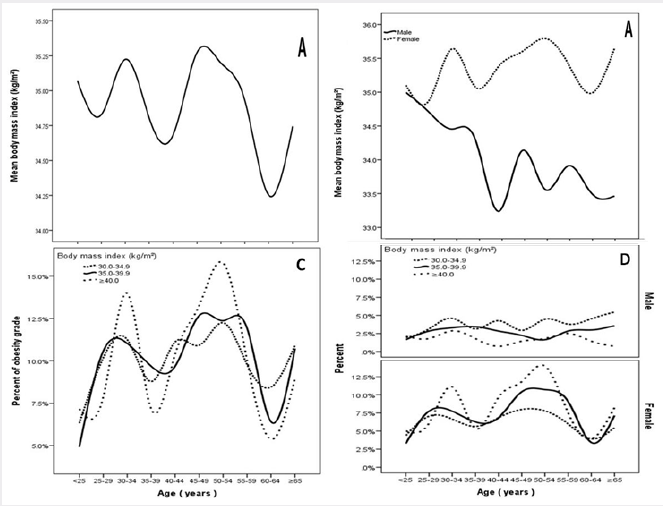
Figure 1: A-D, Description mean and body mass index category by different age ranges and according to gender.

lupinepublishers-openaccess-journal-diabetes-obesity

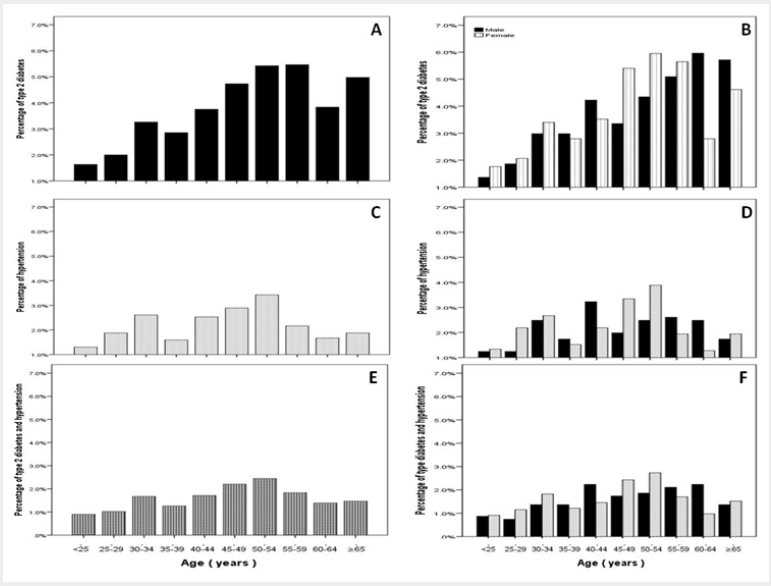
Figure 1 summarizes the relationship between obesity and different age groups. The peaks for all mean and BMI categories were at age 30–34 years and 50-54 years, as indicated in Figure 1, A and C with higher mean and BMI categories for females, Figure 1, B and D. There was no significant association between obesity and hypertension or diabetes. In regard to the relationship between BMI categories and T2DM or HTN in different age ranges, it was observed that T2DM, HTN and T2DM associated with HTN are increasing among 45-49 years and 50-54 years age ranges, with female predominance in those age groups, Figure 2, A-F.

Figure 2: A-F, Description type 2 diabetes, hypertension and diabetes associated with hypertension by different age ranges.

lupinepublishers-openaccess-journal-diabetes-obesity

Discussion

The Global Burden of Disease 2010 study found that elevated BMI was the leading risk factor for disability-adjusted life years in the Kingdom of Saudi Arabia [38]. Previous studies in Saudi Arabia indicate an increasing trend in the prevalence of obesity. Data from the late 1980s through mid-1990s show a prevalence of obesity averaging about 20% ranging from as low as 13.1% among men to as high as 26.6% among women. However, all prevalence estimates from 1995 and beyond are above 35% [10,13,24,33].

Our study showed the peaks for all mean and BMI categories were at age 30–34 years and 50-54 years, as indicated in Figure 1, A and C with significant higher mean BMI ( 34.0±3.7 vs. 35.4±4.6, p<0.0001 ) and BMI categories for females in concordance with other reports [38-41]. The Asia Pacific Cohort Studies Collaboration reports obesity prevalence rates ranging from less than1% to higher than 20% for countries in the Asia-Pacific region [42]. According to National Health and Nutrition Examination Survey of the United States, the prevalence of obesity in individuals aged 20–74 years was 34% in females and 31.7% in males [43]. The corresponding figures in Australia were 19% and 17%, respectively [44]. In the United Kingdom, the prevalence of obesity was estimated to be 24.2% in females and 23.7% in males [45]. The results from most of our neighbouring countries, including Oman, 23.8% in females and 16.7% in males [46]. Lebanon, 18.8%in females and 14.3% in males [47]. Turkey as well, the prevalence of obesity is higher in females 24.6% vs. 14.4% in males and Iran, the prevalence of obesity to be 22.3% among Iranian adults (30.6% in females and 14.2% in males [48,49]. In Saudi Arabia, the National Epidemiological Household survey among Saudi subjects over the age of 15 years in different regions of Saudi Arabia showed the prevalence of overweight among male subjects was significantly higher than for female subjects (29% vs. 27%), and the prevalence of obesity among female subjects was significantly higher than for male subjects (24% vs. 16%) [23].

In Saudi Arabia A community-based national epidemiological health survey, conducted by examining Saudi subjects in the age group of 30-70 years of selected households over a 5-year period between 1995 and 2000 showed that the rate of obesity among adults remained steady at 22.1% (males 17.8% and females 26.6%) in 1990 and 1993 and increased thereafter to 35.6% (females 44% and males 26.4) in 1995 and 2000. This trend can also be seen in overweight Saudis as the percentage of overweight adults in the Saudi Arabia increased from 31.2% (33.1% males and 29.4% for females) to 36.9% (42.4% of males and 31.8% of females) in the same time period [13]. The multiple logistic regression analysis showed that age and gender are statistically significant predictors of obesity. The observed prevalence and pattern of overweight and obesity with age and gender is similar to those observed in the Arab community and some Western nations.

In a cross-sectional study in the Gassim region of Saudi Arabia, 6,044 subjects (2,727 males and 3,317 females) had their BMI computed in the following age groups, namely, 0-5, 6-12, 13-49, 50-69 and 70+ years. In general, the trend for BMI was to increase with age in both genders, but the curve pattern showed some plateauing from about the age of 50, with a slight decline in later life. Females had significantly higher indices than males [50]. Recent study showed the prevalence of obesity was 40.3% where 62.0% of the total female population was obese compared to 49.7% of the total male population. The magnitude of the difference in prevalence of obesity in the males and females was significantly high (p<0.0001) [51]. With the increase in life expectancy, obesity is causing more years of disability [52]. Hence, the increased cost of obesity and its sequelae will put a strain on the resources of governments and individuals [53].

There is apparently gradual weight gain with age, which tends to decrease gradually after the age of 55 years. The decline in mean BMI in the oldest age group was consistent with other studies [54- 57]. The increase in obesity levels with age is of concern, as it has been shown that obese elderly are more likely to present with major chronic health conditions and poor general health [58].

The association we found between obesity and chronic non communicable diseases among Saudis is informative on the impact of obesity on chronic diseases in Saudi Arabia. Different studies have documented that more than 80% of T2DM are obese, and adult males are more likely to be obese than females [59-60]. In Arab societies, it has been found that the high prevalence of Noninsulin dependent diabetes mellitus (NIDDM) is associated with high prevalence of obesity [61]. In Bahrainis, the high rate of diabetes is associated with obesity, but not with overweight [62]. We report high frequency of T2DM, 32.8% of the male, and 67.2% of the female, p<0.0001. In a study from KSA to assess the effect of obesity on diabetes and hypertension, the prevalence of obesity among T2DM and HTN patients was 46% and 54% respectively which are lower than our report [63].

Read More About Lupine Publishers Journal of Diabetes and Obesity Please Click on Below Link: https://diabetes-obesity-lupine-publishers.blogspot.com/