Background and Objective: The prevalence and incidence of type
2 diabetes mellitus (T2DM) are increasing worldwide. Pre diabetes is a
high-risk state for the development of diabetes and its associated
complications. This study aims to determine the associated risk factors
among T2DM and pre diabetes patients among adult Saudi
population.
Methods: For the present study, we analyzed participants who
are older than 20 years old
and had undergone a blood test to assess HbA1c. A total of 1095 were
selected to be enrolled for the present study. All patients
were from the population of the Primary health and Diabetic Centres at
King Fahad Armed Forces Hospital. Participants were defined
as having T2DM according to self-report, clinical reports, use of anti
diabetic agents and HbA1c (≥6.5). Non T2DM participants
were divided into normoglycemic or pre diabetic group as follows: HbA1c
< 5.7, (normoglycemic) or HbA1c 5.7-6.4 (pre diabetes).
Laboratory assessments included HbA1c, lipids, creatinine and urinary
micro albumin.
Main results: Of the 1095 participants analyzed, 796 were
women (72.7%). Age was 45.1±11.1 and BMI was 30.7±5.7.
Hypertension had been diagnosed in 415 (38.2%) participants. Blood
measurements revealed the following values: creatinine
68.2±22.0umol/L , Urine micro albumin (g/min) 55.4±200.3, total
cholesterol levels 4.9±1.0mmol/L, high density lipoprotein
1.3±0.3mmol/L, triglyceride levels 1.5±0.7 and low density lipoprotein
3.0±0.9mmol/L. Of the overall 1095 analyzed participants,
pre diabetes was present in 362(33.1%), 368(33.6%) were classified as
T2DM and 365 (33.3%) as normoglycemic. When comparing
pre diabetic with normoglycemic and T2DM population, pre diabetic
subjects were more likely to have hypertension and higher
triglyceride than normoglycemic but less than T2DM subjects. In
addition, pre diabetic patients compared with T2DM ones had
higher levels of low density lipoprotein and high density lipoprotein.
Logistic regression analysis showed no significant association
of any of the co variables with normoglycemic subjects in front of the
pre diabetic reference group, whereas the odds of being in
the diabetic group gets multiplied by 7.56 for each unitary increase in
male gender (p< 0.0001, OR: 7.56, 95% CI 3.16-18.23). Also,
individuals with hypertension had higher odds of being in the DM group
than in the prediabetic (p<0 .0001, OR: 6.06, 95% CI 3.25-
11.28). Age of subjects had lower odds of being in the DM group than in
the pre diabetic (p<0 .0001, OR: 0.85, 95% CI (0.82-0.89).
Conclusion: This study found the major clinical differences
between pre diabetic and T2DM Patients were the higher
hypertension and hypertriglyceridenia in the T2DM patients. Clearly,
despite the small sample size, this study has posed important
public health issues that require immediate attention from the health
authority. Unless immediate steps are taken to contain the
increasing prevalence of obesity, diabetes, pre diabetes, the health
care costs for chronic diseases will pose an enormous financial
burden to the country
Keywords: Type 2 Diabetes; Pre diabetes; Risk factors
Abbreviations: T2DM: Type 2 Diabetes
Mellitus; IFG: Impaired Fasting Glucose; BMI: Body Mass Index; HTN:
Hypertension; AER:
Albumin Excretion Rate; DN: Diabetic Nephropathy; OR: Odds Ratio; CI:
Confidence Interval; I-IFG: Isolated Impaired Fasting Glucose
Introduction
Diabetes mellitus is a major cause of excess mortality and
morbidity. The prevalence and incidence of type 2 diabetes mellitus
(T2DM) are increasing worldwide [1]. T2DM patients have a higher
risk of developing microvascular and macrovascular disease than
the general population. The occurrence of these complications
depends largely on the degree of glycemic control as well as on
the adequate control of cardiovascular risk factors [2-5]. In Saudi
Arabia, primary epidemiological diabetes features are not different.
The diabetes mellitus prevalence among adult Saudi population
has reached 23.7%, a percentage being the highest across the globe
[6,7]. Statistics regarding the increasing trend of diabetes and pre
diabetes in the world have also been observed in Saudi Arabia.
As per the WHO country profile 2016, 14.4% of Saudi population
has diabetes, while prevalence in males is 14.7% [8]. In 2015, the
prevalence of pre diabetics was found to be 9.0% in Jeddah with
9.4% in men, while for diabetes, it was 12.1% with 12.9% adult
male population suffering from it [9]. Another study conducted
in Saudi population revealed that the diabetes prevalence in their
study was found to be 25.4%, while impaired fasting glucose (IFG)
was 25.5%. The strongest risk factors were age > 45 years, high
triglycerides levels, and hypertension [10].
Pre diabetes is a high-risk state for the development of diabetes
and its associated complications [11-13].
Recent data have shown that in developed countries, such as
the Unites States and the United Kingdom, more than one-third of
adults have pre diabetes, but most of these individuals are unaware
they have the condition [14-16]. Once detected, pre diabetes needs
to be acknowledged with a treatment plan to prevent or slow
the transition to diabetic [17,18]. Treatment of pre diabetes is
associated with delay of the onset of diabetes [19]. Detection and
treatment of pre diabetes is therefore a fundamental strategy in
diabetes prevention [11].
Current recommendations for pre diabetes screening by the
American Diabetes Association focus nearly exclusively on adults
who are overweight or obese as defined by body mass index (BMI)
until the patient meets the age-oriented screening at 45 years
[11]. Further, the recently released recommendation from the US
Preventive Services Task Force regarding screening for abnormal
glucose levels and T2DM limits screening to individuals who
are overweight or obese [20]. This focus on obese or overweight
individuals, although obesity and pre diabetes have shown trends
of increasing prevalence. United States Preventive Services Task
Force has recommended screening of diabetes in adults devoid
of precise symptoms and in individuals with BP higher than
135/80mmHg [21]. This study aims to determine the associated
risk factors among T2DM and pre diabetes patients among adult
Saudi population.
Methods
For the present study, we analyzed participants who are older
than 20 years old and had undergone a blood test to assess HbA1c.
A total of 1095 were selected to be enrolled for the present study.
All patients were from the population of the Primary health and
Diabetic Centers at King Fahad Armed Forces Hospital. Participants
were defined as having T2DM according to self-report, clinical
reports, use of anti diabetic agents and HbA1c (≥6.5) [11]. Non
T2DM participants were divided into normoglycemic or pre diabetic
group as follows: HbA1c<5.7, (normoglycemic) or HbA1c 5.7-6.4
(pre diabetes) [11]. 362 subjects were found to be pre diabetic.
Almost similar number of normoglyceic and T2DM subjects was
selected to be analyzed for comparison. All data were collected by
personal interview and on the basis of a review of electronic medical
data. Weight (kg) and height (cm) were measured by physician and
nurse interviewers and recorded. Overweight and obesity were
defined as BMI 25-29.9 and ≥30.0kg/m2 respectively [22]. Blood
Pressure readings were within a gap of 15 minutes using a mercury
sphygmomanometer by palpation and auscultation method in
right arm in sitting position. Two readings were taken 15 min
apart and the average of both the readings was taken for analysis.
Hypertension (HTN) was also diagnosed based on anti HTN
medications or having a prescription of antihypertensive drugs and
were classified as Hypertensive irrespective of their current blood
pressure reading or if the blood pressure was greater than 140/90
mmHg i.e. systolic BP more than 140 and diastolic BP more than 90
mm of Hg – Report of the American College of Cardiology/American
Heart Association Task Force on Clinical Practice Guidelines [23].
Laboratory assessments included HbA1c, lipids, creatinine and
urinary micro albumin. HbA1c was expressed as percentage. High
performance liquid chromatography was used. Fasting serum lipids
were measured on a sample of blood after fasting for 14 hours.
We used the enzymatic method for determining the cholesterol
and trigylcerides levels. Diabetic nephropathy (DN) was assessed
by measurement of mean albumin excretion rate (AER) on timed,
overnight urine collections. We use a polyclonal radioimmunoassay
for albumin measurement. DN is defined as an albumin excretion
rate of >20g/min in a timed or a 24hr urine collection which is an
equivalent to >30 mg/g creatinine in a random spot sample.
Statistical Analysis
Univariate analysis of demographic and clinical laboratory was
accomplished using one-way analysis of variance (ANOVA) with
posy hoc analysis between variables, to estimate the significance of
different between groups where appropriate. Chi square (X2) test
were used for categorical data comparison. The adjusted odds ratio
(OR) with a 95% confidence interval (CI) was calculated. In order
to evaluate the adjusted association of aforementioned factors on
being normoglycemic or diabetic in relation to the pre diabetes
group, a multinomial logistic regression model was fit, in which the
categorical dependent variable was normoglycemia, pre diabetes or
T2DM(with pre diabetes as the reference category), and significant
variables in bivariate analyses were included as explanatory
variables. Despite of the ordinal nature of the dependent variable,
ordered logistic regression was not adjusted because the aim of
the study was not the association of factors with a latent degree
of diabetes but the differential profile of pre diabetes in front of
normoglicemia and diabetes. As all the participants were the same
age, adjusting for age was not applied. All statistical analyses were
performed using SPSS Version 22.0. The difference between groups
was considered significant when P<0.05.
Results
Of the 1095 participants analyzed, 796 were women (72.7%).
Age was 45.1±11.1 and BMI was 30.7±5.7. Hypertension had been
diagnosed in 415 (38.2%) participants. Blood measurements
revealed the following values: creatinine 68.2±22.0umol/L,
Urine microalbumin (g/min) 55.4±200.3, total cholesterol
levels 4.9±1.0mmol/L, high density lipoprotein 1.3±0.3mmol/L,
triglyceride levels 1.5±0.7 and low density lipoprotein 3.0
±0.9mmol/L. Of the overall 1095 analyzed participants, pre diabetes
was present in 362(33.1%), 368(33.6%) were classified as T2DM
and 365 (33.3%) as normoglycemic. Table 1 shows the clinical
characteristics and laboratory data of the three groups according
to the predefined glycemic status. When comparing pre diabetic
with normoglycemic and T2DM population, pre diabetic subjects
were more likely to have hypertension and higher triglyceride
than normoglycemic but less than T2DM subjects. In addition,
prediabetic patients compared with T2DM ones had higher levels
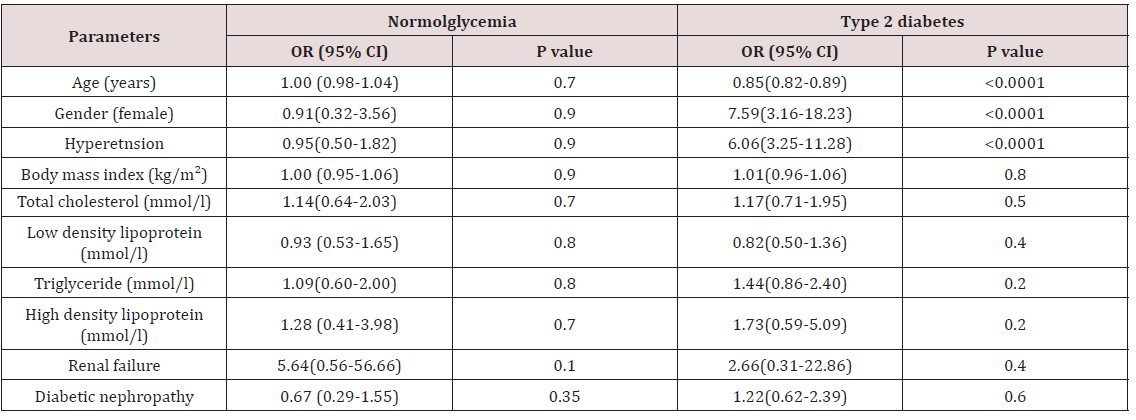
of low density lipoprotein and high density lipoprotein. In Table 2,
logistic regression analysis showed no significant association of any
of the covariables with normoglycemic subjects in front of the pre
diabetic reference group, whereas the odds of being in the diabetic
group gets multiplied by 7.56 for each unitary increase in male
gender (p<0.0001, OR: 7.56, 95% CI 3.16-18.23). Also, individuals
with hypertension had higher odds of being in the DM group than
in the pre diabetic (p<0 .0001, OR: 6.06, 95% CI 3.25-11.28). Age of
subjects had lower odds of being in the DM group than in the pre
diabetic (p<0 .0001, OR: 0.85, 95% CI (0.82-0.89).
Table 1: Characteristics of patients with Normoglycemia, prediabetes and type 2 diabetes mellitus.
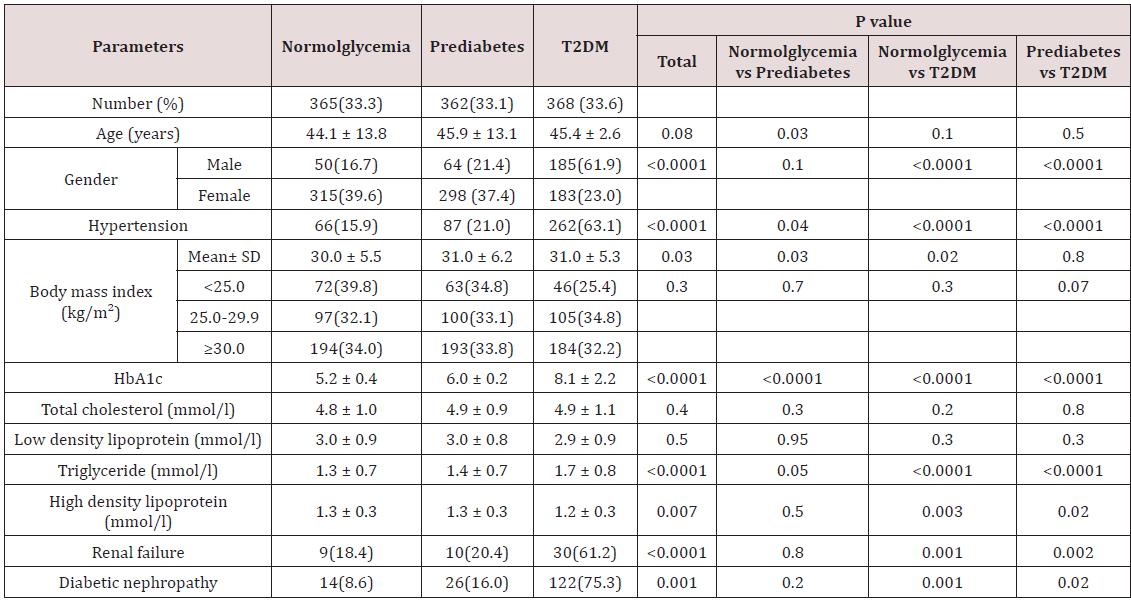
Data are means ± SD or number (%)
Table 2: Multinomial logistic regression results according to glycemic status. Association with clinical characteristics among
prediabetic as a reference category.
Discussion
This study showed that multiple risk factors are related to
T2DM, but not to the pre diabetes group, including age, female
gender and HTN. Generalization to all population could not be due
to regionalized characteristics. In addition, it does not evaluate the
healthcare services offered in our city. The size of our sample and
the cross section type of the study should be of consideration.
T2DM is a major health concern worldwide and is increasing
in parallel with the obesity epidemic [24]. Prevalence of T2DM has
increased dramatically with 1 million people reported to have been
diagnosed with T2DM in 1994, increasing to 382 million by 2013,
and with prediction of 592 million by 2035 [25]. Given that both
genetic and environmental factors contribute to T2DM progression,
it has been proposed that amongst increasing globalization, Asian
ethnicities including Saudi Arabia have been unable to adapt to
food and lifestyle related aspects of westernized culture [26]. Hence
when matched for the same gender, age, and body weight, those
with Asian ethnicity appear to have a greater risk of poor metabolic
health than Caucasian counterparts including Europeans people
[27]. This increased risk for T2DM has been reported in both Asians
and Saudi Arabia [6-10,28].
Currently, the population with pre-diabetes has reached
approximately 318 million around the world, accounting for
6.7% of the total number of adults. About 69.2% of the prediabetes
population lives in low or middle-income countries
[29]. Understanding pre diabetes may be crucial to reducing the
global T2DM epidemic and is defined either by the presence of
isolated impaired fasting glucose (I-IFG); or isolated impaired
glucose tolerance (I-IGT); or both IFG and IGT. To maintain glucose
homeostasis greater secretion of insulin is required from the
pancreatic cells, and hence hyperinsulinemia develops. Prolonged
hyperinsulinemia and/or fatty pancreas may in turn lead to the
dysfunction of pancreatic cells, resulting in impaired insulin
secretion [30]. Decreased insulin secretion and concomitant
increased blood glucose levels consequently also lead to the
reduced uptake of glucose by skeletal muscle, thereby enhancing
muscle insulin resistance [31]. IFG, determined from fasting plasma
glucose, occurs as a result of poor glucose regulation, resulting in
raised blood glucose even after an overnight fast, while IGT is due
to an individual being unable to respond to glucose consumed as
part of a meal, resulting in increased postprandial blood glucose
[11]. More recently, prediabetes has also been identified by mildly
elevated HbA1c [32,33].
The younger age of T2DM in our cohort is consistent with that
seen among other groups such as the Australians, the American
Indian and Alaska natives [34-36]. Age of subjects had lower odds of
being in the DM group than in the pre diabetic (p<0 .0001, OR: 0.85,
95% CI (0.82-0.89) in concordance with earlier reports [37,38].
Odds of being in the diabetic group gets multiplied by 7.56 for each
unitary increase in male gender (p< 0.0001, OR: 7.56, 95% CI 3.16-
18.23). As seen in this study, majority of the female participants
were either overweight (59.6%) or obese (78.6%). The reason
for such an observation has not been completely elucidated but is
proposed to be associated with obesity which is highly prevalent
in the populations worldwide. Since obesity is closely linked to
increased insulin resistance and decreased insulin sensitivity and
higher risk of diabetes, arresting the obesity pandemic among our
population should be a priority [39-41]. Special, culturally oriented
community-based intervention programs need to be implemented.
The frequency of pre diabetes in 27.2% of the female cases out
of the total cohort in this study was six times higher than other,
estimated to be 4.2% in 2006 [42,43]. Due to our small sample size,
this is inconclusive and needs to be verified by extending our study
to more of our communities. Nevertheless, our findings warrant
special attention from the health authorities since although HbA1c
is not as sensitive as IGT test, it has consistently been shown to be
a good predictor of increased risk for cardiovascular diseases and
T2DM in many populations around the world [44,45].
Previous cross-sectional studies have reported that multiple
risk factors are related to pre-diabetes, Such as increased age,
overweight, obesity, blood pressure, and dyslipidemia [37,46,47].
More importantly, impaired glucose tolerance was found to be an
independent risk factor for cardiovascular disease, the hazard ratio
of death was 2.22 (95% CI = 1.08–4.58), and arterial stiffness and
pathological changes in the arterial intima occurred in the stage of
IGT [48]. The participants in our study with pre-diabetes had higher
BMI, more frequent HTN, higher triglyceride, frequent renal failure
and DN than those without pre-diabetes but lower than participants
with T2DM. logistic regression analysis showed no significant
association of any of the covariables with normoglycemic subjects
in front of the pre diabetic reference group, whereas the odds of
being in the diabetic group gets multiplied by 7.56 for each unitary
increase in male gender. Also, individuals with hypertension had higher
odds of being in the DM group than in the pre diabetic. Age
of subjects had lower odds of being in the DM group than in the pre
diabetic which was consistent with earlier studies [37,38].
Previous studies have reported that overweight and obesity
were the mainly factors contributing to insulin resistance, and
insulin resistance was the basis of diabetes and other chronic
diseases [49,50]. In the present study, BMI was significantly higher
in the pre diabetes than the normal groups, p=0.03. When BMI was
classified into three types. The total numbers of overweight and
obese people in the pre-diabetes and normal groups were 293 and
291, respectively (the total number were 362 and 365, respectively),
and there were statistically non significant differences in being
overweight or obese between the pre-diabetes and normal groups
(OR = 1.02, 95% CI = 0.86–1.21, p=0.8). Increasing evidence suggests
that the excess body fat in overweight/obese people might lead to
increased degradation of fat, which resulted in the production of
large amounts of free fatty acids (FFAs). When the level of FFAs was
higher in blood, the capacity of liver tissue for insulin-mediated
glucose uptake and utilization was lower, so the blood glucose level
was high in circulation [51]. In other words, high FFAs in the blood
were one of the important pathogenic factors of obesity caused
by insulin resistance [52]. The fact that BMI categories was not a
significant factor in our study is the cohort mean BMI was in the
obesity range, p=0.3. However, the mean BMI was significantly
different between the studied groups, p=0.03.
A high level of triglycerides was not significantly associated
as a risk factor for developing pre-diabetes and T2DM (OR = 1.09,
95% CI = (0.60-2.00), P=0.8, 1.44(0.86-2.40),P=0.2) respectively.
High level of triglycerides could increase the fat deposition in
muscle, liver, and pancreas, and it could damage the function of
mitochondria and induce oxidative stress which, in turn, could cause
insulin resistance, but also lead to impaired islet B cell function
[53]. Some studies suggested an interrelation between hyper
triglyceridemia and insulin resistance and that they promote each
other’s development [54,55]. In concordance with our result, in
some epidemiological studies, for instance, the Framingham Heart
Study, hyper triglyceridemia was more prevalent in type 2 diabetes
mellitus patients than in the normal population, suggesting that
hyper triglyceridemia is a causal factor of type 2 diabetes mellitus
[56]. However, this paper was a cross-sectional study, thus it was
impossible to determine the causal relationship between hyper
triglyceridemia and pre-diabetes and T2DM.
Hypertension was found to be a risk factor for T2DM but not
for the pre diabetes group in our study (OR = 6.06, 95% CI =3.25-
11.28, p<0.0001, OR = 0.95, 95% CI = 0.50-1.82, p=0.9) respectively.
A possible mechanism is that the activity of angiotensin II is
increased in the circulatory system of patient with hypertension.
Angiotensin II activates renin-angiotensin-aldosterone system
and affects the function of the pancreatic islets, resulting in islet
fibrosis and reduced synthesis of insulin, and ultimately leading to
insulin resistance [57,58]. Insulin resistance can also aggravate the
condition of hypertension. Directly or indirectly through the activity
of renin-angiotensin-aldosterone system, insulin promotes renal
tubular to reabsorb Na+ and water, leading to the increased blood
volume and cardiac output; this is considered as one of reasons
for the development of hypertension [59]. Interactions between
abnormal glucose tolerance, hypertension, and dyslipidemia
could impair endothelial cell and result in atherosclerosis or other
cardiovascular complications. Therefore, the management of daily
diet of people with pre-diabetes and the monitoring of body weight,
blood lipids, and blood pressure is very important.
Results of our investigation must be interpreted in light of some
limitations such as the cross-sectional design, which does not let
to establish any causal relation with respect to prediabetic state
and only provides mere associations. Moreover, the classification of
glycemic state was based on HbA1c, instead of its combination with
a glucose tolerance test. Then, it is expected that the lack of glucose
tolerance test data leads to a suboptimal estimation of glycemic
state because normoglycemic group may include some individuals
with impaired glucose tolerance that should have been included in
pre diabetic group. Considering the goal population, a larger cohort
would have probably provided a greater power of the statistical
analyses.
Conclusion
This study found the major clinical differences between pre
diabetic and T2DM patients were the higher hypertension and
hyper triglyceridenia in the T2DM patients. Clearly, despite the
small sample size, this study has posed important public health
issues that require immediate attention from the health authority.
Unless immediate steps are taken to contain the increasing
prevalence of obesity, diabetes, pre diabetes, the health care costs
for chronic diseases will pose an enormous financial burden to the
country.
Conclusion
Use a plant based protein blend diet pea - lowers levels of
hunger hormone, ghrelin. Quinoa -chock full of anti-inflammatory
compounds called flavonoids. Hemp - contains 20 amino acids,
healthy omega fats and fiber (including 9 the body cannot make on its
own). Coconut - packed full of healthy saturated fats that go straight
to the liver for a quick energy boost. Monk fruit - contains powerful
antioxidants called mogrosides. Cinnamon - clinically proven to
support healthy blood sugar levels AND healthy triglyceride levels.
Vanilla Bean - loaded with minerals like magnesium, potassium,
and calcium. Vanilla also has mood-boosting and energy enhancing
effects on body. Zero alcohol use.
disease”.
Read More About Lupine Publishers Journal of Diabetes and Obesity Please Click on Below Link: https://diabetes-obesity-lupine-publishers.blogspot.com/