Showing posts with label Diabetes and Obesity Journals. Show all posts

Wednesday, 15 March 2023

Lupine Publishers| Diabetes in Older People: Comprehensive Approach

   Lupine Publishers| Journal of Diabetes and Obesity


Abstract

The clinical management of older people with diabetes requires a comprehensive evaluation and a holistic approach for the individualization of objectives and strategies of treatment. In older people with diabetes, geriatric syndromes, frailty and sarcopenia are considered at present as a third category of chronic complications. These situations are added to traditional microvascular and macrovascular complications, leading to significant disability and increasing the costs. In this context, two clinical scenarios can be considered: the first one, elderly subjects without significant comorbidities and good functional condition, in which an approach to diabetes similar to that of younger patients must be made. The second scenario, elderly and frail subjects, in which it will be essential a correct identification of these conditions and the evaluation of geriatric syndromes. This evaluation will guide the adaptation in the goals of treatment and in global management of diabetes.
Some basic principles should guide our decision-making: starting drugs at low - medium doses, with progressive increase according to tolerability; selection of drugs according to evidence-based medicine (considering the limited evidence in this age group), favoring agents with the lowest risk of hypoglycemia, avoid polypharmacy. Finally, patient´s safety and quality of life should be the main objectives.

Keywords: Diabetes; Older; Frailty; Evidence-Based-Medicine

Opinion

Clinical management of older diabetes people requires a comprehensive evaluation and a holistic approach for the individualization of objectives and strategies of treatment. Geriatric syndromes, frailty and sarcopenia are considered at present as a third category of chronic complications [1]. These situations are added to traditional microvascular and macrovascular complications, leading to significant disability and a significant increase in costs.
In this context, two clinical scenarios can be considered: first, elderly subjects without significant comorbidities and without frailty, in which an approach to diabetes similar to that of younger patients must be made. The second scenario, elderly and frail subjects, in which a correct identification of frailty and an evaluation of geriatric syndromes is mandatory, guiding modifications in the goals of treatment and in the global management of diabetes.

Initial Approach

1. Consider evaluation of medical, functional (self-care skills) and geriatric sphere to establish a frame of reference that determines the objectives and therapeutic strategies diabetes management (Evidence B) [2].
2. Assess presence of geriatric syndromes (polypharmacy, cognitive impairment, depression, urinary incontinence, falls, chronic pain) as conditions that interfere with patient’s management of diabetes and reduce quality of life (Evidence B) [2].

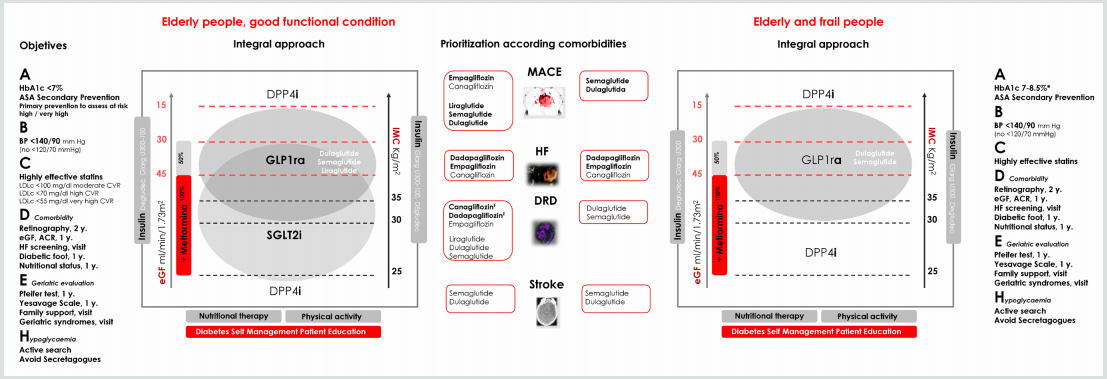
Figure 1: Comprehensive approach in older people with T2DM.
Bold therapy: grade A evidence. * Clinical situation: Intermediate / complex HbA1c 7-8%, TA <140/90 mmHg; very complex HbA1c <8.5%, TA <150/90 mm Hg.
ASA, acetylsalicylic acid; BP, blood pressure; LDLc, LDL cholesterol; y., every “number” years; eGF, estimated glomerular filtration; ACR, urine albumin creatinine ratio; HF, heart failure (evidence limited to patients at risk of heart failure or patients with FH diagnosis and reduced ejection fraction); Ŧ eGFR <30 mL/min/1.73 m2: Initiation not recommended, but once established, it can be maintained until the start of dialysis.
GLP1ra, glucagon-like peptide-1 receptor agonists; SGLT2i, sodium-glucose transport protein 2 inhibitors; DPP4i, dipeptidyl peptidase 4 inhibitors; Glarg, glargine

Lupinepublishers-openaccess-journal-diabetes-obesity

3. Evaluation of frailty. The most validated and simple evaluation tools are Fried criteria and FRAIL scale. Consider potentially reversible causes that contribute to frailty such as presence of hypothyroidism, vitamin D deficiency, anemia, etc., is advised [3].
4. In those over 65 years of age, an early diagnosis of mild cognitive alterations is recommended, at diagnosis and subsequently annually [2]. Pfeiffer questionnaire or Minimental test are validated tools. In patients with cognitive dysfunction, simplify treatment, and adapt care structure.
5. Patient safety, preferences and quality of life should be the main objectives.
Treatment objectives, therapeutic approach and the assessment of comorbidities, are shown in (Figure 1).

Treatment Objectives (ABCDEH):

A. Glycemic control (A1c)

General recommendation, which should always be individualized, is a target of HbA1c 7.5-8.5% (58-69 mmol/l) in advanced frailty, and HbA1c 7-8% (53-64 mmol/l) in mild to moderate frailty. In frailty subjects, HbA1c <7% (53 mmol/l) should be avoided, especially if drugs with risk of hypoglycemia are used [2]. Many frail subjects have medical conditions that can interfere with HbA1c determination (chronic kidney disease, anemia, transfusions), and capillary blood glucose measurement may be necessary for assessing glycemic control [2].

B. Blood pressure (BP)

The objective of elderly subjects with diabetes, including those with dementia, is <140/90 mmHg, avoiding values <120/70 mmHg. A goal of <150/90 mmHg may be more suitable for the frail and dependent elderly. Whenever possible, measure BP standing and sitting, to detect orthostatic hypotension that increase the risk of falls. Withdrawal of treatments should be evaluated as frailty progresses [2,3].

C. Hypercholesterolemia

Statin treatment is recommended in the same situations as in non-elderly subjects: secondary prevention and primary prevention with high cardiovascular risk. Treatment of hypercholesterolemia in elderly patients has some differential characteristics. Lifestyle changes may not be possible. Furthermore, statin myopathy is more frequent (up to 10%) due to sarcopenia, so it is advisable to use low or moderate doses of statins. Treatment of vitamin D deficiency can improve statin-associated myalgia [3]. In situations of advanced frailty and dependency, suspension of statins may be considered.

D. Assessment of chronic complications

It must be individualized, with particular attention to those with higher influence on functional state (retinopathy, diabetic macular edema and diabetic foot). Heart failure, chronic kidney disease, and vitamin B12 deficiency should not be forgotten [2,4].

E. Geriatric Evaluation

Consider the assessment of geriatric syndromes: polypharmacy (use of three or five drugs simultaneously or the need to indicate one drug to supply the side effects of another), cognitive impairment, depression (Yesavage scale annually), urinary incontinence, falls, chronic pain (visual analogue pain scale), and frailty [2,3].

F. Hypoglycemia

In older people prevention of hypoglycemia is especially important because of the repercussions on the risk of falls, fractures, and emergency department visits and hospitalization. Elderly patients have impaired recognition of hypoglycemia and difficulties in acquiring basic skills for self-care and for resolution of hypoglycemia, which determines a greater severity of the episodes. Also, there is a bi-directional relationship between hypoglycemia and cognitive decline [5].

Comprehensive Pharmacological Treatment in the Elderly with T2DM

In general terms, disease modifying therapies should be used in combination with metformin, that is, with benefit in morbidity - associated mortality, low risk of hypoglycemia, and benefits in terms of control of BP and excess of weight (if appropriate) [6].
The patient and their caregivers should be aware of the “sick days” rule for metformin and sodium-glucose transport protein 2 inhibitors (SGLT2i), to avoid the potential risk of impaired renal function, lactic acidosis, and euglycemic ketoacidosis. Also, simplification of complex regimens is recommended, especially in patients with insulin therapy, to reduce the risk of hypoglycemia and polypharmacy, always based on individualized HbA1c targets.
The use of SGLT2i in frail elderly patients with a diagnosis of heart failure (HF) with reduced ejection fraction (FEr), is a reasonable therapeutic option, given its potential benefits. Diuretic and blood pressure treatment must be revised to avoid volume depletion (hypotension, orthostatic hypotension, dizziness, syncope, and dehydration), and impaired kidney function.
DPP4 inhibitors (DPP4i) may be reserved for elderly people with renal function contraindicating other therapies, or those patients with normal weight, in whom the additional weight loss may be a problem; in this case, sitagliptin [7]. and linagliptin [8] must be prioritized. Sulfonylureas and glinides (hypoglycemia risk), and pioglitazone (risk of heart failure and fractures), must be avoided.
In frail elderly people with obesity, the use of weekly glucagonlike peptide-1 receptor agonists (GLP1ra) may be a good option given the low risk of hypoglycemia, the weight loss benefit, the potential benefits in comorbidities and the weekly administration [9]. Its use must be accompanied by adapted nutritional therapy, and appropriate physical activity recommendations (aerobic and resistance training) to avoid the loss of muscle mass, including strength, flexibility and balance exercises [10]. Also, the appearance of gastrointestinal effects should be monitored.

Read More about Lupine Publishers Journal of Diabetes and Obesity Please Click on Below Link: https://diabetes-obesity-lupine-publishers.blogspot.com/

Tuesday, 14 March 2023

Lupine Publishers| Identification of The Downregulation of TPD52-Like3 Gene and NKX2-1 Gene in Type 2 Diabetes Mellitus Via RNA Sequencing

  Lupine Publishers| Journal of Diabetes and Obesity


Abstract

A recent study using next-generation RNA sequencing was reported on genome-wide changes in gene expressing in the skin between patients with type 2 diabetes mellitus, compared to non-diabetic patients. Ex-post review, based in part on both the existence of lipid droplets, peridroplet mitochondria and cytoplasmic mitochondria, selected in the gene metabolism category the most downregulated gene TPD52L3, and in the gene regulation category the most downregulated gene NKX2-1. There is strong evidence that these two genes are involved in the disease process of type 2 diabetes mellitus.

Keywords: Gene Expression; Lipid Droplets; Mitochondria; RNA Sequencing; Type 2 Diabetes Mellitus

Opinion

In an earlier study, it was proposed that the final consequence of hereditary anomaly results in the development of type 2 diabetes, which already emerges in the prediabetic phase. It was thought to occur due to an increased flux, as compared to the healthy controls where protons (H+-ions) from the mitochondrial intermembranespace re-enter the matrix via uncoupling protein-1 (UCP1). This causes hyperthermia in and around the mitochondria [1].
But the key question that remains to be answered here is for the connection between the increased flow of protons and type 2 diabetes mellitus. In the past decade, a study reported on the visual documentation of the possible interaction of lipid droplets with mitochondria. This interaction was found to be quite intimate with the involvement of membrane attached receptor proteins such as SNAP23 [2]. Also, the cellular population of mitochondria in brown adipocytes tissue could be divided into two subpopulations; i.e. mitochondrial population having physical evidence of adherence to a lipid droplet or peridroplet mitochondria, and a non-lipid droplet-bound cytoplasmic mitochondrial population without any adherence to lipid droplets [3,4].
Although both the peridroplet mitochondria and cytoplasmic mitochondria are similar in their cell membrane composition they differ in other fundamental respects [3,4]. A comparison of the purified peridroplet mitochondria to cytoplasmic mitochondria suggests that peridroplet mitochondria are more elongated, whereas cytoplasmic mitochondria tend to be smaller. Also, peridroplet mitochondria have enhanced oxidative phosphorylation capacity, TCA cycle activity, ATP synthesis, as well as increased ATP-dependent triglyceride synthesis compared to cytoplasmic mitochondria. The measured fatty acid-driven respiration and UCP1 content in the isolated mitochondria suggests that for thermogenic fat oxidation peridroplet mitochondria are not specialized compared to cytoplasmic mitochondria [3]. This signifies that, under healthy conditions, in the peridroplet mitochondria the protons derived from free fatty acids (FFAs) and generated by the electron-transport chain during the oxidation process of FA are used for the production of ATP without any escape of protons via UCP1 to produce heat. On the other hand, the protons generated by the oxidation of cytoplasmic mitochondrial FA are mainly used for the production of heat. So, peridroplet mitochondria have an increased coupled respiration, while cytoplasmic mitochondria have an increased uncoupling activity. The existence of peridroplet mitochondria demonstrates that the essential processes of fat metabolism can be selectively confined to exclusive and segregated subsets of mitochondria. The fatty acids intended for storage undergo synthesis of triacylglycols followed by their storage in the lipid droplets.

Most eukaryotic cells can store lipids in the form of droplets [5]. Lipid droplets are cytosolic storage organelles at the center of the lipid and energy homeostasis. They have a unique architecture consisting of a hydrophobic core of neutral lipids, mostly triacylglycerol and sterol esters and are enclosed by a phospholipid monolayer membrane. This single layer is derived from the endoplasmic reticulum, whereby triacylglycerols are synthesized between the two leaflets of the endoplasmic reticulum membrane. Associated with the monolayer is a specific set of proteins, which decorates the surface of the lipid droplet but is absent from the hydrophobic core [6]. These proteins associate with the membrane through hydrophobic hairpins, amphipathic helices and fatty acid modifications, and are also thought to control lipid droplet positioning inside the cell and association with other organelles.
In 2016, researchers demonstrated that the exogenous expression of human tumor protein D52 (TPD52) in the cultured 3T3 cells result in a significant increase in the numbers of lipid droplets [7]. Starting with the bulging of a triglyceride lens within the endoplasmic reticulum bilayer, lipid droplet biogenesis factors including TPD52 are recruited to the lens structure and facilitate the growth of the nascent lipid droplet [8,9]. Moreover TPD52- expressing 3T3 cells form more lipid droplets following oleic acid supplementation, which contributes to the lens formation [10]. As a previous study has shown, an increase in carbon-carbon double bonds in the acyl chains of phospholipids promotes the flexibility of cellular membranes [11]. So, TPD52 expression increases lipid storage, co-distributes with lipid droplets and is recruited to lipid droplets to stabilize lipid droplets [12]. Moreover, it is interesting to note that TPD52 knockdown decreased both lipid droplet sizes and numbers [12].
Tumor protein D52 is the founding member of the TPD52-like protein family representing four paralogous mammalian genes, i.e. TPD52, TPD52L1, TPD52L2, and TPD52L3 [7,13,14]. The group of Cao demonstrated that human TPD52L3 interacted with itself and with TPD52, TPD52L1, and TPD52L2 [14]. The four human linear proteins of this family are TPD52, TPD52L1, TPD52L2, and TPD52L3, which consist of 184, 204, 206, and 140 amino acid residues, respectively. Their first exon-coded protein located at the N-terminal side is unique to each isoform, and all the members contain a highly conserved coiled-coil motif located towards the N-terminus which is required for homo- and heteromeric interaction with other TPD52-like proteins [14,15] and share a sequence identity of ~50% [7]. Byrne et al. proposed that TPD52 may exert and/or regulate its activities through interaction with itself and its related proteins [15]. The coiled-coils were predicted by use of pairwise residue correlations and were not based on their crystal structures [16].

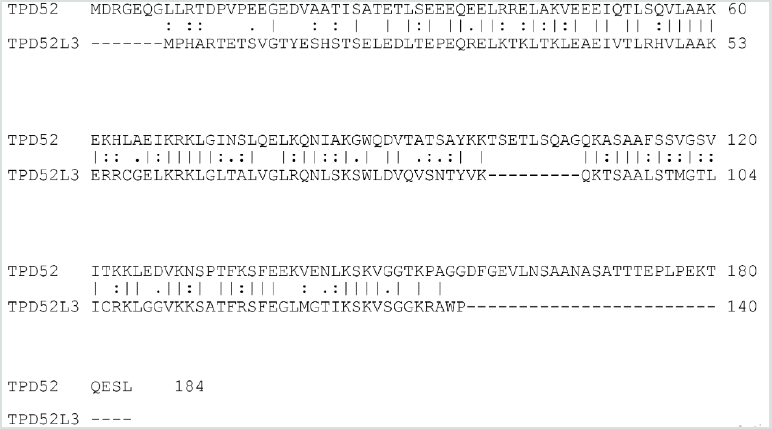
Figure 1: Alignment of the human TPD52 (upper row) and the human TPD52L3 (lower row) protein sequences. Amino acid residues are indicated by single letters. Vertical lines indicate identical residues and colons/dots indicate highly/weakly conserved residues.

Lupinepublishers-openaccess-journal-diabetes-obesity

The analysis was focused on the sequences of TPD52 and TPD52L3. The two sequences revealed an obvious similarity, they share 63 identical positions and 42 similar positions resulting in an overall homology of 57.1% (Figure 1). The coiled-coil motif near the N-terminus was found in all TPD52-like proteins. Uniprot predicts a coiled domain for residues 28-57 of TPD52L3, and also for residues 21-70 of TPD52 [17]. The common part of these two coiled-coil protein sequences has an overall homology of 67.9% (Figure 1). The information regarding the amino acid sequences of human TPD52 (P55327-2) and TPD52L3 (Q96J77-1) was retrieved from the UniProtKB/Swiss-Prot databank. Interestingly, although the coiled-coil motif is very important for the interactions mediated by TPD52-like proteins [15,18], the TPD52L3 shortened coiled-coil motif successfully interacted with TPD52-like proteins.

A recent study using next-generation RNA sequencing was reported on genome-wide changes in gene expression in the skin between patients with type 2 diabetes mellitus, compared to nondiabetic patients [19]. The most downregulated gene of patients with type 2 diabetes in the gene metabolism category is TPD52L3 with a “log2 fold change” value of -28, compared to skin samples from non-diabetic patients. So far, this gene has not been linked to type 2 diabetes or wound healing.

The fact that the exogenous expression of human TPD52 increases the number of lipid droplets [7], TPD52 knockdown decreases the number of lipid droplets [12], and the activity of TPD52 depends on the interaction with TPD52L3 [14], support the idea that the major function of TPD52L3 is the lipid storage at the center of the lipid and energy homeostasis [8,9]. In other words, in brown adipocytes tissue, it seems likely that the significant downregulation of TPD52L3 causes a reduction in the number of lipid droplets in the skin samples of type 2 diabetes mellitus patients.

This indicates that an essential reduction in the lipid droplets suggests a substantial decrease in the peridroplet mitochondria for patients with type 2 diabetes and consequently an increase in the saturated plasma FFAs. As the unsaturation index (UI; number of carbon-carbon double bonds per 100 fatty acyl-chains) of FFAs from human white fat cells is substantially lower compared to the UI of serum FFAs in the healthy controls (85.5 and 191.9, respectively), these events force a shift from unsaturated to saturated acyl chains in the phospholipids of both the erythrocyte and vascular membranes [20]. This reduction in UI translates into an increase in the attractive forces between the mutual membrane phospholipid acyl chains, which redistributes the lateral pressure profile of the cell membrane [21]. This redistribution reduces the pore diameter of the transmembrane glucose transport channels of all Class I glucose transporter proteins, leading to a marked reduction in the transmembrane glucose transport [22].

On the other hand, the increased uncoupling activity of the cytoplasmic mitochondria [4] takes up the remaining fatty acid oxidation, including the formation of protons. The rationale is that the overall balance between the number of protons which re-enter the matrix through ATP synthase on the one hand, and the number of protons which re-enter the matrix through UCP1 on the other hand, might shift to the latter side, which in turn promotes an increase in the production of heat. To keep a narrow range of mitochondrial temperature compatible with life, the slow-down principle enters into force, which also results in an essential reduction in UI [1]. This chain of events is a blueprint of the development of type 2 diabetes mellitus.

A second result of the earlier mentioned genome-wide analysis study is the most downregulated gene in the gene regulation category, NKX2-1, of type 2 diabetes patients with a “log2 fold change” value of -28 compared to skin samples from non-diabetic patients [19]. Notably, a study also reported a novel heterozygous mutation in exon 3 of the NKX2-1 gene, which is related to a reduction in the muscle mitochondrial respiratory chain complex activity, a characteristic of type 2 diabetes [23]. It is to be noted that the reduced mitochondrial activity is one of the characteristics of type 2 diabetes [24]. This may be in advance of the patients with type 2 diabetes mellitus as the reduced mitochondrial activity implies a reduction in heat production.

Finally, it is worth considering about the potential benefit of the use of (modified) synthetic TPD52L3 for combating the adverse effects of type 2 diabetes mellitus.

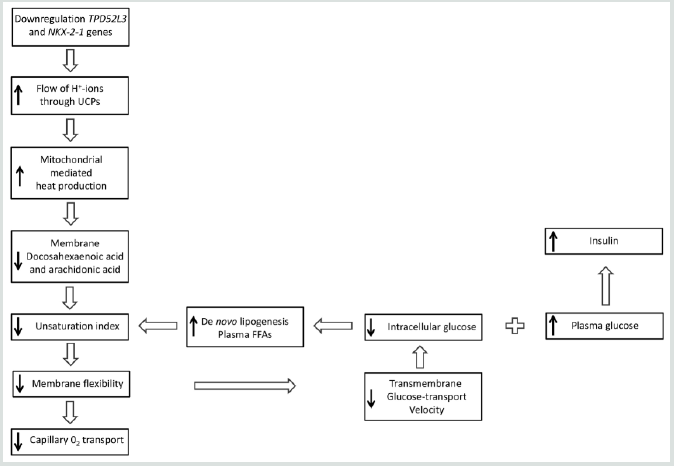
Briefly, the idea is that two genes are pertinently involved in the disease process of type 2 diabetes mellitus: one concerns the downregulation of human TPD52L3 gene expression, which yields a significant reduction in the lipid droplets, whereas the second one relates to the downregulation of human NKX2-1 gene expression which reduces the mitochondrial respiratory chain activity (Figure 2).

Figure 2: Although the results of genome-wide screen for type 2 diabetes susceptibility genes are still under debate, a refined working hypothesis proposes that the primary effect of the downregulation of the human genes TPD52L3 and NKX2-1 generates an increased flux of mitochondrial intermembrane-space protons through UCP1 into the matrix, which causes an increase of extra heat. This process initiates the slow-down principle. UCP: Uncoupling protein; FFA: Free fatty acid; GLUT: Glucose transporter.

Lupinepublishers-openaccess-journal-diabetes-obesity


Read More about Lupine Publishers Journal of Diabetes and Obesity Please Click on Below Link: https://diabetes-obesity-lupine-publishers.blogspot.com/

Wednesday, 1 February 2023

Lupine Publishers| Properties of Mitochondrial-Derived Peptides (Mdps), Type 2 Diabetes, and Relationship with Oxidative Stress

 Lupine Publishers| Journal of Diabetes and Obesity


Abstract

Objective: In addition to its role in energy production and metabolism, mitochondria play a major role in apoptosis, oxidative stress, and calcium homeostasis. This review highlights the intricate role of mitochondria derived peptides (MPs), oxidative stress, and age-related disease such as diabetes.

Key Findings: The mitochondria produce MDPs: specific peptides that mediate transcriptional stress response by its translocation into the nucleus and interaction with DNA. MDPs are regulators of metabolism with cytoprotective effects through anti-oxidative stress, anti-inflammatory responses and anti-apoptosis. This class of peptides comprises: humanin (HN), MOTS-c, Small HN-like peptides. HN inhibits mitochondrial complex 1 activity and limits oxidative stress level in the cell. HN has been shown to prevent apoptosis by decreasing the reactive oxygen species production. Mitochondrial dysfunction and oxidative stress are implicated in the pathogenesis of diabetes. Data suggested that MDPs had a role in improving type 2 diabetes (T2D).

Summary: The goal of this review is to discuss the newly emerging functions of MDPs and their biological role in ageing and age-related diseases such as T2D.

Keywords:Mitochondrial-Derived-Peptides; Humanin; Oxidative Stress; Diabetes

Introduction

Mitochondria play a critical role in maintaining cellular function by ATP production. In addition to its role in energy production and metabolism, mitochondria play a major role in apoptosis, oxidative stress, and calcium homeostasis. A mitochondrial stress signal, or a ‘mitokine’, could confer protection and promote survival, while priming the cell’s readiness for subsequent insults with increasing severity. The term ‘mitohormesis’ for such a phenomenon has been created [1]. The mitochondrial unfolded protein response (UPRmt) is a central part of the “mitohormetic” response. The UPRmt may be an alternative way in relationship with mitochondria signal in the cell. The mitochondria produce some specific peptides that mediate transcriptional stress response by the translocation into the nucleus and interaction with DNA. Mitochondrial derived peptides (MDPs) are regulators of metabolism and various studies have shown that MDPs exerted cytoprotective effects through anti-oxidative stress, anti-inflammatory responses and anti-apoptosis [2,3]. The goal of this review is to discuss the newly emerging functions of MDPs and their biological role in ageing and metabolic diseases such as T2D.

Mitochondrial Metabolism Modulation

Functions in the Mitonuclear Communication Pathways

Mitochondria booked a portion of the original bacterial genomes that co-evolved with nuclear genome. However, mitochondria import over a thousand proteins encoded in the nuclear genome to maintain their diverse functions, reflecting their adjacent relationship [4].

The mitochondrial genome inherits bacterial-like traits: the DNA molecules (mtDNA) are circular, double stranded, small (16,569 nucleotides in humans) and compact. mtDNA contains 37 genes, including 22 tRNAs, 2 rRNAs (12S and 16S rRNA) and 13 mRNAs encoding the proteins of the electron transport chain [5]. The mtDNA has no introns but a few non-coding nucleotides between adjacent genes and small open reading frames that encode functional MDPs. This class of peptides comprises humanin (HN) and mitochondrial open reading frame of the 12S rRNA-c (MOTS-c) and expands the expression of mitochondrial proteome [6]. It has been established that mitochondria can export peptides and also import cytosolic peptides. It is the class of “cell-penetrating peptides” designed also as “mitochondrial cell-penetrating peptides” [7]. Many age-induced processes and degenerative diseases are related to mitochondrial dysfunction, further highlighting the critical importance of this organelle [8]. Complex human diseases, including diabetes, obesity, fatty liver disease and aging-related degenerative diseases are associated with alterations in mitochondrial oxidative phosphorylation (OXPHOS) function.

Overview on Concepts of Retrograde Signaling and Unfolded Protein

Numerous implications of these anterograde and retrograde signaling pathways between the mitochondria and the nucleus are appropriate for therapeutic exploitation with bioactive molecules.

Concept of Retrograde Signaling

The hallmark of mitochondrial retrograde signaling is the modification of the expression of nuclear genes induced by a signal from mitochondria [9]. Retrograde signaling must be triggered by a mitochondrial signal that in turn is relayed via molecules that finally reach the nucleus. In mammalian cells, altered nuclear expression in response to mitochondrial dysfunction is reported; a number of signaling pathways being implicated in this retrograde communication [10]. Mitochondrial retrograde signaling is a signaling pathway connecting mitochondria and the nucleus. Signal transducers in the yeast retrograde response are Rtg1p, Rtg2p, and Rtg3p proteins [11]. The outcomes of mitochondrial retrograde signaling go far beyond the maintenance or biogenesis of the organelle, affecting the homeostasis of the whole organism through body weight or immunity.

Concept of Unfolded Protein

Mitochondrial protein homeostasis is maintained through proper folding and assembly of newly translated polypeptides. Several factors challenge the mitochondrial protein-folding environment including reactive oxygen species (ROS) that are generated within mitochondria, as well as environmental situations such as exposure to toxic compounds. To promote efficient mitochondrial protein folding mitochondria possess molecular chaperones located in both the intermembrane space and matrix [12].

UPRmt is a mitochondria-to-nuclear communication mechanism that promotes adaptive regulation of nuclear genes related to mitochondrial response, and metabolism, implicated in the cellular homeostasis [13].

Mitochondrial-Derived Peptides: Classification

MDPs are a series of peptides encoded by mitochondrial DNA. This class of peptides comprises HN, MOTS-c, Small HN-like peptides (SHLPs) and expands the expression of mitochondrial proteome [6].

Humanin

The first MDP discovered back in 2001 was HN; the term based on the potential of this peptide for restoring the “humanity” of Alzheimer’s disease (AD) patients. HN promotes cell survival in response to a variety of insults.
It is a small, secreted, 24 or 21 amino acid peptide, depending on cytoplasmic or mitochondrial translation, respectively. If HN is translated within the mitochondria, the peptide will be 21 amino acids; and if it is translated in the cytoplasm, then the result is a 24 amino acid peptide [14]. HN is encoded by an HN open reading frame (ORF) within the gene for the 16S ribosomal subunit within the mitochondrial genome [15]. HN was discovered during a search for survival factors in unaffected areas of an AD patient’s brain. The initial studies were first performed in cell culture and then followed by in vivo studies using both pharmacological mimetics of AD as well as mutant gene: amyloid-β precursor protein. The most recent studies used transgenic models of AD. As HN is a relatively short peptide, exhaustive mutational analysis of the importance of each amino acid has been possible. Interestingly, single amino acid substitutions of HN can lead to significant alterations in its potency and biologic functions. S14G-HN in which the serine at position 14 is replaced by glycine, is a highly potent analogue of HN.
Finally, HN may be the first small peptide of its kind representing a putative set of MDPs, a novel concept that modifies the established concept about retrograde mitochondrial signaling as well as mitochondrial gene expression. HN is a neuroprotective peptide and a cytoprotective factor against oxidative stress [16].

Read More about Lupine Publishers Journal of Diabetes and Obesity Please Click on Below Link: https://diabetes-obesity-lupine-publishers.blogspot.com/

Tuesday, 20 December 2022

Lupine Publishers| Variability in Plasma FGF21 Levels in Rats Fed A Standard 15% Protein Diet is not Sensitive Enough to Reflect Differences in Protein Requirements

 Lupine Publishers| Journal of Diabetes and Obesity 


Introduction

Fibroblast growth factor 21 (FGF21) is a hepatokine member of a subfamily of “fibroblast growth factors” that responds to multiple metabolic stresses as protein deficiency [1-4]. FGF21 is produced in various tissues but the FGF21 circulating form is primarily of hepatic origin [1,2]. FGF21 affects numerous metabolic and behavioural parameters, and in particular, increases appetite for protein in subjects fed a protein-deprived diets [5,6]. In a recent still unpublished study, we observed that plasma FGF21 levels were higher in adult male Wistar rats fed a standard diet, formulated according the AIN93 recommendations for rats’ feed, containing 15% protein by energy [7] than in rats fed a 30% protein diet. In addition, inter-individual variability of plasma FGF21 levels was larger in rats fed the standard 15% protein diet than in rats fed the 30% protein diet. We therefore considered the hypothesis that higher levels and inter-individual variability in plasma FGF21 levels in rats fed a standard 15% protein diet would reflect the variability in protein requirements between individuals and thus, that measurement of plasma FGF21 levels can be used as a simple, rapid, and minimally-invasive test to estimate the adequacy of protein intake.
Dietary self-selection is a method that has been largely used in farm animals and laboratory rodents to study the requirements for macronutrients (carbohydrates, lipids and proteins), vitamins and minerals [8,9]. Many studies using this method, in our lab and others, showed that rats self-selecting between a protein diet and a protein-free diet often ingest up to 30-50% of total energy intake as protein [10-15], so much higher than the level considered as sufficient for an optimal growth in adult rats (10-15% by energy), which comforted our hypothesis that 15% dietary protein was possibly not the optimal dietary content.
The objective of this study was to verify that variability in plasma FGF21 levels in rats fed a standard 15% protein diet was indicative of differences in protein requirements. To this end, we have analyzed the relationship between FGF21 levels, and the level of protein subsequently selected during self-selection between a protein diet and a protein-free diet.

Experimental Procedure

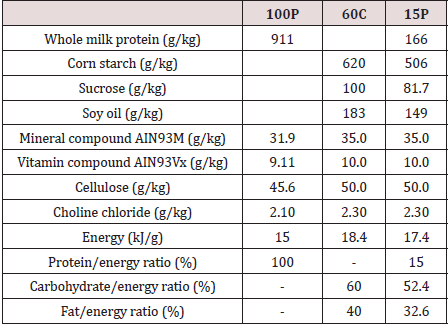
24 adult male rats (215-240g) of the Wistar RccHan strain (ENVIGO) were used and individually housed (22°C ± 1°C, 12/12 L/D, cycle lights on at 08:00). After 1 week of adaptation to the laboratory conditions, the rats were fed for 12 days (Basal period) a standard diet formulated according to the AIN93 requirements [7] that contained 15% protein (15P); then, for 28 days (Choice period), 6 rats (Control group) continued to be fed with the standard diet and 18 (Self-selecting group) were given a choice between a pure protein diet (100P) and a protein-free diet containing a mix of fat (soy oil) and carbohydrate (corn starch and sucrose) in which carbohydrate amounted 60% by energy. The diets were provided, as necessary.

The food pellets were prepared twice a week by mixing the macronutrients, vitamins, and mineral mix with the amount of water required to make a thick dough. Food intake (g/day) was measured twice a week and converted in kJ/day based on the energy content of the diets (Table 1).

Table 1: Composition and energy content of the 3 used diets.

lupinepublishers-openaccess-journal-diabetes-obesity

100P: diet containing only proteins; 60C: protein-free diet containing only lipids and carbohydrates and in which carbohydrates amounted 60% by energy; 15P: standard diet containing 15% of protein by energy.

Blood samples (0.5 mL) were collected from the tail vein in EDTA tubes: once during the basal period and once during the choice period. Blood collection was made in the morning (10:00- 12:00) in rats that were not previously fasted. Blood samples were centrifuged (5000g, 15min, 4°C) and the plasma stored at -20°C. Plasma FGF21 levels (pg/ml) were measured by ELISA tests using commercial kits from Bio Vendor (Mouse/Rat FGF-21 ELISA RD291108200R).

Statistical Analysis

Statistical tests were performed using RStudio software, 2015. Changes in protein intake and plasma FGF21 level were compared using mixed two-factor ANOVA tests (parameter ~ group*period), which were followed by the main effects analysis by Bonferroni adjusted pairwise comparisons. Values are presented as means ± standard error of the mean (SEM). Linear regression analysis was used to study the link between plasma FGF21 levels during the basal period and protein intake during the choice period and was performed using Excel software. Significance of correlations was assessed using the Pearson correlation coefficient. A threshold of P≤0.05 was chosen as significant.

Results and Discussion

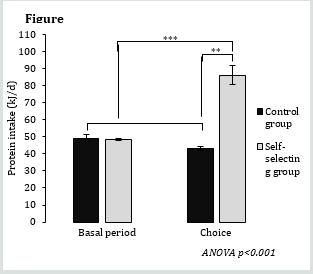
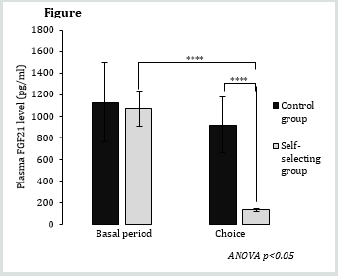
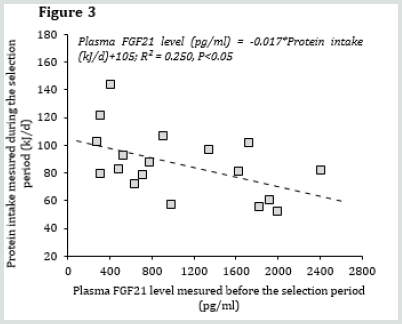
Protein intake was similar between the control and selfselecting group during the basal period but increased by 80% in the self-selecting group during the choice period (+37.8 kJ/d, p<0.0001) (Figure 1). This response significantly increased the contribution of protein to total energy intake from 15.0% to 23.5% (p<0.001). Mean plasma FGF21 levels averaged ~1,100 pg/mL in both groups during the basal period and decreased to 131 pg/mL in self-selecting group during the choice period (P<0.001) (Figure 2). Finally, contrary to our hypothesis, not only did we not observe a positive correlation between plasma FGF21 levels during the basal period and protein intake during the choice period, but instead we observed a weak and inverse correlation (Figure 3).

Figure 1: Protein intake (kJ/d) according to diet group and period.
(*:0.05; **:0.01; ***:0.001; ****:0.0001) Values are represented as means ±SEM, only the p-value of the interaction of ANOVA tests are indicated.

Lupinepublishers-openaccess-journal-diabetes-obesity

Figure 2: FGF21 level in plasma (pg/ml) according to diet group and period.
(*:0.05; **:0.01; ***:0.001; ****:0.0001) Values are represented as means ±SEM, only the p-value of the interaction of ANOVA tests are indicated.

Lupinepublishers-openaccess-journal-diabetes-obesity

Figure 3: Protein intake (kJ/d) during the choice period as a function of plasma FGF21 levels during the basal period in the self-selecting group.

Lupinepublishers-openaccess-journal-diabetes-obesity

Conclusion

In conclusion, inter-individual variability in plasma FGF21 levels in rats fed a standard 15% protein diet did not appear to be a parameter sensitive enough to reflect inter-individual differences in protein requirements. Therefore, plasma FGF21 level cannot be used as a test to determine inter-individual variability in protein requirements in individuals. Nevertheless we observed that plasma FGF21 levels in P15 fed rats were ~7 fold higher than in selfselecting rats ingesting 23.5% protein, which points on the fact that changes in plasma FGF21 levels are very sensitive to dietary protein intake, even when protein intake is well above essential protein requirements (~8-10 % in adult male rats).

Read More about Lupine Publishers Journal of Diabetes and Obesity Please Click on Below Link: https://diabetes-obesity-lupine-publishers.blogspot.com/


Tuesday, 8 November 2022

Lupine Publishers| Variability in Plasma FGF21 Levels in Rats Fed A Standard 15% Protein Diet is not Sensitive Enough to Reflect Differences in Protein Requirements

 Lupine Publishers| Journal of Diabetes and Obesity


Introduction

Fibroblast growth factor 21 (FGF21) is a hepatokine member of a subfamily of “fibroblast growth factors” that responds to multiple metabolic stresses as protein deficiency [1-4]. FGF21 is produced in various tissues but the FGF21 circulating form is primarily of hepatic origin [1,2]. FGF21 affects numerous metabolic and behavioural parameters, and in particular, increases appetite for protein in subjects fed a protein-deprived diets [5,6]. In a recent still unpublished study, we observed that plasma FGF21 levels were higher in adult male Wistar rats fed a standard diet, formulated according the AIN93 recommendations for rats’ feed, containing 15% protein by energy [7] than in rats fed a 30% protein diet. In addition, inter-individual variability of plasma FGF21 levels was larger in rats fed the standard 15% protein diet than in rats fed the 30% protein diet. We therefore considered the hypothesis that higher levels and inter-individual variability in plasma FGF21 levels in rats fed a standard 15% protein diet would reflect the variability in protein requirements between individuals and thus, that measurement of plasma FGF21 levels can be used as a simple, rapid, and minimally-invasive test to estimate the adequacy of protein intake.
Dietary self-selection is a method that has been largely used in farm animals and laboratory rodents to study the requirements for macronutrients (carbohydrates, lipids and proteins), vitamins and minerals [8,9]. Many studies using this method, in our lab and others, showed that rats self-selecting between a protein diet and a protein-free diet often ingest up to 30-50% of total energy intake as protein [10-15], so much higher than the level considered as sufficient for an optimal growth in adult rats (10-15% by energy), which comforted our hypothesis that 15% dietary protein was possibly not the optimal dietary content.
The objective of this study was to verify that variability in plasma FGF21 levels in rats fed a standard 15% protein diet was indicative of differences in protein requirements. To this end, we have analyzed the relationship between FGF21 levels, and the level of protein subsequently selected during self-selection between a protein diet and a protein-free diet.

Experimental Procedure

24 adult male rats (215-240g) of the Wistar RccHan strain (ENVIGO) were used and individually housed (22°C ± 1°C, 12/12 L/D, cycle lights on at 08:00). After 1 week of adaptation to the laboratory conditions, the rats were fed for 12 days (Basal period) a standard diet formulated according to the AIN93 requirements [7] that contained 15% protein (15P); then, for 28 days (Choice period), 6 rats (Control group) continued to be fed with the standard diet and 18 (Self-selecting group) were given a choice between a pure protein diet (100P) and a protein-free diet containing a mix of fat (soy oil) and carbohydrate (corn starch and sucrose) in which carbohydrate amounted 60% by energy. The diets were provided, as necessary.

The food pellets were prepared twice a week by mixing the macronutrients, vitamins, and mineral mix with the amount of water required to make a thick dough. Food intake (g/day) was measured twice a week and converted in kJ/day based on the energy content of the diets (Table 1).

Table 1: Composition and energy content of the 3 used diets.

lupinepublishers-openaccess-journal-diabetes-obesity

100P: diet containing only proteins; 60C: protein-free diet containing only lipids and carbohydrates and in which carbohydrates amounted 60% by energy; 15P: standard diet containing 15% of protein by energy.

Blood samples (0.5 mL) were collected from the tail vein in EDTA tubes: once during the basal period and once during the choice period. Blood collection was made in the morning (10:00- 12:00) in rats that were not previously fasted. Blood samples were centrifuged (5000g, 15min, 4°C) and the plasma stored at -20°C. Plasma FGF21 levels (pg/ml) were measured by ELISA tests using commercial kits from Bio Vendor (Mouse/Rat FGF-21 ELISA RD291108200R).

Statistical Analysis

Statistical tests were performed using RStudio software, 2015. Changes in protein intake and plasma FGF21 level were compared using mixed two-factor ANOVA tests (parameter ~ group*period), which were followed by the main effects analysis by Bonferroni adjusted pairwise comparisons. Values are presented as means ± standard error of the mean (SEM). Linear regression analysis was used to study the link between plasma FGF21 levels during the basal period and protein intake during the choice period and was performed using Excel software. Significance of correlations was assessed using the Pearson correlation coefficient. A threshold of P≤0.05 was chosen as significant.

Results and Discussion

Protein intake was similar between the control and selfselecting group during the basal period but increased by 80% in the self-selecting group during the choice period (+37.8 kJ/d, p<0.0001) (Figure 1). This response significantly increased the contribution of protein to total energy intake from 15.0% to 23.5% (p<0.001). Mean plasma FGF21 levels averaged ~1,100 pg/mL in both groups during the basal period and decreased to 131 pg/mL in self-selecting group during the choice period (P<0.001) (Figure 2). Finally, contrary to our hypothesis, not only did we not observe a positive correlation between plasma FGF21 levels during the basal period and protein intake during the choice period, but instead we observed a weak and inverse correlation (Figure 3).

Figure 1: Protein intake (kJ/d) according to diet group and period.
(*:0.05; **:0.01; ***:0.001; ****:0.0001) Values are represented as means ±SEM, only the p-value of the interaction of ANOVA tests are indicated.

Lupinepublishers-openaccess-journal-diabetes-obesity

Figure 2: FGF21 level in plasma (pg/ml) according to diet group and period.
(*:0.05; **:0.01; ***:0.001; ****:0.0001) Values are represented as means ±SEM, only the p-value of the interaction of ANOVA tests are indicated.

Lupinepublishers-openaccess-journal-diabetes-obesity

Figure 3: Protein intake (kJ/d) during the choice period as a function of plasma FGF21 levels during the basal period in the self-selecting group.

Lupinepublishers-openaccess-journal-diabetes-obesity

Conclusion

In conclusion, inter-individual variability in plasma FGF21 levels in rats fed a standard 15% protein diet did not appear to be a parameter sensitive enough to reflect inter-individual differences in protein requirements. Therefore, plasma FGF21 level cannot be used as a test to determine inter-individual variability in protein requirements in individuals. Nevertheless we observed that plasma FGF21 levels in P15 fed rats were ~7 fold higher than in selfselecting rats ingesting 23.5% protein, which points on the fact that changes in plasma FGF21 levels are very sensitive to dietary protein intake, even when protein intake is well above essential protein requirements (~8-10 % in adult male rats).

Read More About our Lupine Publishers Journal of Diabetes and Obesity Please Click on Below Link: 
https://diabetes-obesity-lupine-publishers.blogspot.com

Monday, 19 September 2022

Lupine Publishers| Excess Weight, Obesity, Diabetes and Coronavirus Disease

 Lupine Publishers| Journal of Diabetes and Obesity


Introduction

SARS-CoV-2 virus has created an unprecedented public health and global economic crisis. Despite the fact, that this virus was discovered half a century ago, earlier version of this RNA virus (SARS-CoV) was less virulent than the 2019 version of the virus (CoV-2), which turned out to be the most potent killer virus. According to the Johns Hopkins University (JHU) Coronavirus Resources Center (coronavirus.jhu.edu), globally there are 28 million Covid-19 infected individuals and 900,000 deaths. In the USA, we have over 6.4 million infected individuals and 192,000 confirmed covid-related deaths. The response from the public health perspective is important, to prevent further escalation of the SARS-CoV-2 epidemic. Having said that, it is important to note, that each country has responded differently. Vietnam, and Taiwan have done well in keeping the Covid-19 infection rate and death to a minimum. Public health experts worldwide, should study the response of Taiwan, in preventing the spread of this highly contagious disease, without massive tests and lockdowns. Currently the oldest (USA) and the youngest (India) democracies, are competing for the number one position, interns of highest number of infected individuals. India has over 4.5 million infected individuals and 76,000 deaths. According to the JHU report dated September 10, 2020, Mexico has the highest observed case-fatality ratio (CFR) of 10.7%, compared to the USA (3.0%), and India (1.7%). In earlier articles we have discussed the role of comorbidities such as hypertension, excess weight, obesity, diabetes (Type-2) and vascular diseases, on the severity of Covid-19 infection [1-6]. However, if one looks at this situation from a historic perspective, in the last four decades cardiometabolic disease such as hypertension, excess weight, obesity, diabetes (Type-2), and vascular diseases, have increased in prevalence and incidence to epidemic proportions worldwide [7-16]. Added to this global burden of metabolic diseases, a killer virus has taken advantage of the existence of these metabolic risks, which are known to promote, oxidative stress, inflammation, vascular and immune dysfunction.

China Medical Treatment Expert Group for Covid-19, reported in January of 2019, that on admission, 20-51% of patients reported as having at least one comorbidity, with diabetes (10-20%), hypertension (10-15%), and other cardiovascular diseases (7-40%) being the most common [17]. In this guest editorial, we will briefly discuss the role of metabolic diseases such as hypertension, obesity, and diabetes in the progression and severity of the coronavirus disease. According to news reports, the first group of people to get hit by the virus in Italy were the elderly. They also noted that Italy has the second oldest population in the world, after Japan. Irony of this comparison is, that Japan did not suffer such devastating effect from the SARS-CoV-2 as Italy and Spain. In China, of the 1590 patients hospitalized in the early days of Covid-19 pandemic, the mean age was 48.9 years. In the USA, rates were highest among persons aged 65 years (12.2%), 65-74 (17.2%), and population older than 85 (54.4%). Public health experts believed that younger population was less susceptible for the SARS-CoV-2 infection. As is with any prediction about the Covid-19, the story keeps changing as the timeline changes. Currently there are over 500,000 infected young students in the USA. Earlier reports from China, indicated hypertension and diabetes (Type-2) as the two major comorbidities. However, in the recent months, dozens of studies have reported that many of the sickest patients have been people with obesity [18]. Furthermore, studies have demonstrated that even people who are merely overweight, also are at higher risk for Covid-19. The study by Ogden et al reported, the prevalence of childhood and adolescent obesity, and noticed grater increases (2-fold) in non-Hispanic Black and Mexican American adolescents [19]. This is particularly concerning, because adolescents with severe obesity are at high risk for the development of serious comorbidities including hypertension, diabetes as well as Covid-19. In a recent editorial in JAMA, Rodgers and Gibbons discuss the role of obesity and hypertension as comorbidities of Covid-19. SARS-CoV-2 pandemic has brought out the susceptibility of minority communities of color, and has exposed the complex interplay of contributing factors, that are rooted in the social determinants of health, and racial inequities. A 6-fold increase in the rate of death for African Americans, living in the USA due to a ubiquitous virus should be deemed unconscionable, as reported in the recent issue of JAMA (April15, 2020). What is currently known about these differences in disease risk and fatality rates? In Chicago, more than 50% of COVID-19 cases and nearly 70% of COVID-19 deaths involve African American individuals, although they make up only 30% of the population. This trend can me tracked down in various US Cities. Poor living conditions, health care disparity, unhealthy nutrition, and high incidence of metabolic diseases, seem to contribute to the excess CFR in this ethnic group, as well as in other minority communities [20, 21].

Considering the contribution of comorbidities to the progression and severity of the coronavirus disease, one would expect that China and India, with the largest populations of diabetic subjects, should have the highest CFR (Deaths per 100,000 population) for Covid-19. On the other hand, Mexico (10.7%), Iran (5.8%), and Spain (5.4%) have lot more mortality than the USA (3.0%) and India (1.7%). Since the two major populations with highest number of diabetics have not shown comparatively high case fatality rate, it is worthwhile discussing the other two comorbidities (hypertension and obesity) as the chief contributors for the Covid-19 progression and severity. Trends in the prevalence of hypertension in the USA, according to the NHANCE survey of age standardized prevalence, decreased from 48.4% in 1999-2000 to 45.4% in 2015-2016. However, absolute burden of hypertension consistently increased, from 87.0 million in 1999-2000 to 108 million in 2015-2016 [22]. Hypertension appears to be more common in Mexico, than among Mexican Immigrants in the United States. As far as the obesity goes, the number of obese children and adolescents aged five to 19 years, has risen tenfold in the past four decades and if current trends continue, there will be more obese children and adolescents than those moderately or severely [23]. Among adolescents, obesity prevalence in the USA was 16.8% in 2007 and 18.5% in 2016. Age standardized obesity in adults increased from 33.7% in 2007 to 39.6% in 2015. Whereas, 62% of the participants in Mexico reported, at least, being overweight [24]. When considering obesity data based on the BMI, we should keep in mind that South Asians have a different body fat distribution, compared to the European and Western population. South Asians in general have central abdominal obesity.

Data from 6916 patient records that researchers from Kaiser Permanente reported, compared to normal body mass index (BMI) of 18-24 Kg/m2, the risk of death more than doubled for patients with a BMI of 40-44 Kg/m2 and nearly doubled again, for those with a BMI of 45kg/m2 or more [25] In an accompanying editorial, David A Kass, a Cardiologist at the Johns Hopkins University, wrote, “that these findings taken with prior research -should put to rest the contention that obesity is common in severe COVID-19, -because it is common in the population.” The pathophysiology of hypertension involves, complex interaction of multiple vascular effectors, including activation of the sympathetic nervous system, of the renin-angiotensin-aldosterone system, and of the inflammatory mediators. Oxidative stress and endothelial dysfunction are consistently observed in hypertensive subjects [26]. As we have discussed earlier, obesity has reached epidemic proportions worldwide. In the USA alone, the prevalence of obesity has increased 50% in the past three decades, with 70% of all adults being classified as either overweight or obese [27]. Beyond an impaired response to infections, people with obesity also suffer from chronic, low grade inflammation. Fat cells secrete inflammation triggering chemical messengers called cytokines, and more come from immune cells called macrophages, that clean up dead and dying fat cells. These in turn, impair vascular homeostasis and lead to endothelial dysfunction [28].

If we carefully analyze a series of clinical events, that develop post SARS-CoV-2 infection, we can begin to understand, why metabolic diseases serve as independent risk factors for the progression and severity of coronavirus disease. Initial route of entry is via nasal and oral mucosa, -the preferred receptor that facilitates the transmission seems to be the ubiquitous ACE2, which is found in multiple types of cells and tissue including vascular endothelium. Recent findings, that following the injury to the lung tissue, the virus gets entry into the endothelium, opens a whole new avenue for the progress of the disease and its severity. Endothelium is the largest organ of the body, covering a large surface area and reaching out to every tissue and organ. As such, the injury to the endothelium could introduce a cascade of events, leading to platelet activation, thrombin generation, and promotion of both thrombotic and thrombolytic events [3]. Furthermore, people with metabolic diseases such as, hypertension, excess weight, obesity, diabetes (Type-2), and vascular disease, already have a compromised endothelium and invasion of the SARS-CoV-2 virus leads to further injury to the vascular system, by the disruption of vascular integrity and endothelial cell death. These events lead to the exposure of the subendothelial basement membrane, and results in the activation of thrombotic and clotting cascade of events.

The question of why China and India with the largest populations of diabetics, have relatively low rates of Covid-related mortality, is quite puzzling. In China, -Covid-19 pandemic’s epicenter, Wuhan, and its province, Hubei, Chinese Center for Disease Control-network, formed 1300 epidemic investigation teams, in addition to the 40,000 doctors and nurses. They used very clever tracing tools with big data support. In the first week of January the novel coronavirus infection was detected, and on 23 January 2020, they locked down the city of 11 million people and soon the rest of the Hubei-a province of nearly 60 million. The WHO-China Joint Mission on Coronavirus Disease 2019 Task Force concluded, “In the face of unknown virus, China has rolled out perhaps the most ambitious, agile, and aggressive, disease containment effort in history.” The strategy that underpinned this containment effort was initially a national approach, that promoted universal temperature monitoring, masking, and hand washing [29]. As far as India is concerned, the general population thinks, that they have innate immunity, as they are exposed to a variety of Asian viruses. On the other hand, some scientists speculate that the SARS-CoV-2 in India is a milder version, compared to the European and US strains. According to a news report by Rajesh Nair in ‘The Hindu’ of September 11, 2020, “Diabetes seems to be the main cause of COVID-19 deaths in the Union Territories (UT) of India. A survey conducted by the Jawaharlal Institute of Postgraduate Medical Sciences and Research (JIPMER) showed 30% of the government servants in Puducherry (UT) were diabetic.

In the same report by Nair, Emergency Surgeon of New Medical Center, Dr T. Arjun Sundaram expresses his optimism by saying, “It is an obedient (SARS-CoV-2) virus, if treated early for even people with comorbidities. But people with comorbidities try to ignore early symptoms, as part of their existing medical conditions, - just as flu-like symptoms.” Comorbidities such as hypertension, excess weight, obesity, diabetes, and vascular diseases increase COVID-19 related hospitalization by 6-fold and deaths, by 12-fold. In a recent report from the USA, underlying conditions were reported in 71% of individuals admitted to hospital with COVID-19 and in 94% of the deaths [30]. In a study done at Westchester County, New York, among Covid-19 patients, who presented with a comorbid condition, more than 57% had high blood pressure, while 41.7% were obese and 33.8% had diabetes. This study also found 90% of coronavirus patients, who were put on ventilators died. A recent global estimate published in Lancet, estimated that one in five individuals worldwide are at risk for infection by SARS-CoV-2 virus. A recent report by Jain and associates from New Delhi, India, discusses differential mortality in COVID-19 patients from India and Western Countries [31]. The authors discuss the age of the population, genetics of the virus, mutation of the virus, immune variations of Indian subjects and the expression of the ACE2 receptor in the adipose tissue.

Authors claim that they have investigated and identified the possible reasons and hypotheses for this disparity in observed or reported Covid-19 related mortality. However, we feel strongly, that there may be other, as yet unknown causes, and only future history will reveal all the mysteries of coronavirus disease.

Read More About Lupine Publishers Journal of Diabetes and Obesity Please Click on Below Link: https://diabetes-obesity-lupine-publishers.blogspot.com/

Monday, 8 August 2022

Lupine Publishers| Factors Responsible for Diabetes Elevated Blood Pressure Among Bangladesh Adults

 Lupine Publishers| Journal of Diabetes and Obesity


Abstract

The analytical results presented here were based on data collected from 960 adults of ages 18 years and above residing in both urban and rural areas of Bangladesh. The data were collected by some doctors and nurses from and nearby their working places according to quota sampling plan. The objective of the study was to investigate the impacts of different socioeconomic variables on simultaneous sufferings of adults from diabetes and high blood pressure and to identify the most responsible variables for this suffering. The analysis indicated that 5.4 percent adults were simultaneously suffering from both diabetes and elevated blood pressure. The most responsible variable for the diseases was occupation followed by gender variation, income and expenditure. The results of risk ratio and factor analysis indicated that the females and physically inactive adults had the more chance of affecting by the disease. Males, non- user of can food and skilled or unskilled working group had less chance of affected by the disease. The variables were identified by factor analysis.

Keywords: Diabetes; Elevated Blood Pressure; Socioeconomic Variables; Risk Ratio; Standard Error of ln (Risk Ratio); Factor Analysis; Factor Loading

Introduction

Diabetes is one of the most risky health hazard which can enhance many non-communicable diseases like cardiovascular diseases, hypertension, kidney diseases, retinopathy, sensory system and so –fourth. Again, hypertension and or elevated blood pressure, though it is curable NCDs, is the primary risk factor for cardiovascular disease including stroke, heart failure, heart attack and aneurysm [1-8]. The elevated blood pressure is considered if systolic blood pressure is greater than or equal to 140 mmHg and diastolic blood pressure is greater than or equal to 90 mmHg [9,10]. In 2015, I in 4 men and 1 in 5 women had hypertension [1]. Number of adults with hypertension increased from 594 million in 1975 to 1.13 billion in 2015 [1,11]. The increase was noted in low-and middle-income countries. The prevalence rate was 28.6 percent among adults of ages 18 years and above [3]. Prevalence was increased significantly with age, ranging from 6.8 percent among individuals aged 18 to 39 years to 30.4 percent in those aged 40 to 59 years and 66.7 percent in individuals aged 60 years and above [4]. In Bangladesh, according to JNC 7 guidelines the prevalence of hypertension was 17.9 percent [10].
Urban adults, elderly adults, adults with physical inactivity, obese and diabetic adults were more likely to have hypertension [10]. People with both diabetes and hypertension have approximately twice the risk of cardiovascular diseases compared to the people with non-diabetic hypertension [12]. The prevalence of hypertension among diabetic patients is around three times compared to the people of non-diabetic hypertension [13]. Diabetes is the targeted disease by WHO as it has some social and economic consequences [14-17]. Accordingly, the problem is addressed to reduce the prevalence of the disease. Still, upward trend in deaths due to diabetes is noted [16]. This is true for both home and abroad [17]. It was reported that, approximately 463 million adults of ages 20-79 years worldwide were diabetic [17]. This figure will be increased up to 700 million in 2045. In a separate report, it was mentioned that 1 in 5 diabetic patients were at the age above 65 years and 2 in 3 were urban residents [18,19].
In one study, it was observed that most of the Bangladeshi urban adults (36.3%) were suffering from diabetes [20]. Both diabetes and hypertension are in alarming stage for elderly people in both home and abroad. Thus, the simultaneous impact of diabetes and elevated blood pressure needs to be considered and how these diseases are influenced by different socioeconomic variables are needed to be studied. For this reason, the objective of the study was to observe the association of the prevalence of both the diseases simultaneously with different socioeconomic variables and to identify the variables responsible for both the diseases among adults. The responsible variables were identified by factor analysis.

Methodology

The present work was done by analyzing the data collected from adults of ages 18 years and above residing in both urban and rural areas of Bangladesh. The investigated adults were 960. They were available for investigation nearby the working places of some doctors and nurses when they were doing their Master of Public Health degree in American International University- Bangladesh during the academic session 2017-18. These adults were investigated by quota sampling method to cover around 70% diabetic patients [21]. The objective to cover this number of diabetic patients was to ensure a good amount of elevated blood pressure people simultaneously suffering from diabetes [1]. For comparative study, a good number of normal subjects were also investigated. Finally, 960 adults were interviewed, and data were recorded through a pre-designed and pre-tested questionnaire.
The questionnaire contained different questions related to different socioeconomic variables of the respondents and of the families. The main questions for families were related to the monthly family income and monthly family expenditure. The questions for the diabetic adults were related to the duration of disease, disease related health hazard, i.e. eye problem, kidney problem, heart problem, blood pressure, blood sugar, treatment stage of disease, admission into hospital, etc. Beside these, the other questions were related to personal habit, viz. food habit, working habit, physical activity, utilization of time, etc. The collected personal information were residence, religion, marital status, age, height, weight, education, and occupation. Some of the above-mentioned variables were qualitative and some were quantitative in nature. All the recorded variables were measured in nominal scale by assigning numbers. Height and weight were used to measure the level of obesity and level of obesity was measured by the value of BMI, where BMI was calculated by weight (in kg) divided by height (in meter2). The respondents were classified as underweight (BMI < 20), normal (BMI = 20 and above but less than 25), overweight (BMI = 25 and above but less than 30) and obese (BMI ≥ 30).
At the first step of analysis, association of level of prevalence of diabetes and prevalence of elevated blood pressure [if diastolic blood pressure ≥ 90 mmHg and systolic blood pressure ≥ 140 mmHg] was investigated. The association of socioeconomic variables and prevalence of diabetes and high blood pressure were investigated by Chi-square test, where significant association was decided if the p-value of Chi-square statistic is less than or equal to 0.05. Some diabetic adults were at higher risk of elevated blood pressure compared to others. To study this characteristic the risk ratio (R.R.) along with standard error of ln (R.R.) for a particular level of a social variable compared to the level of the variable which did not create problem for the disease was calculated. Factor analysis was done to identify the most responsible variables to create problems simultaneously for diabetes and high blood pressure among the adults. Important variables which did not create simultaneously problem of diabetes and higher blood pressure among adults were also detected. The importance of the variables were decided by the highest absolute value of factor loading [22, 23]. The analysis was done using the SPSS [Version 25].

Results

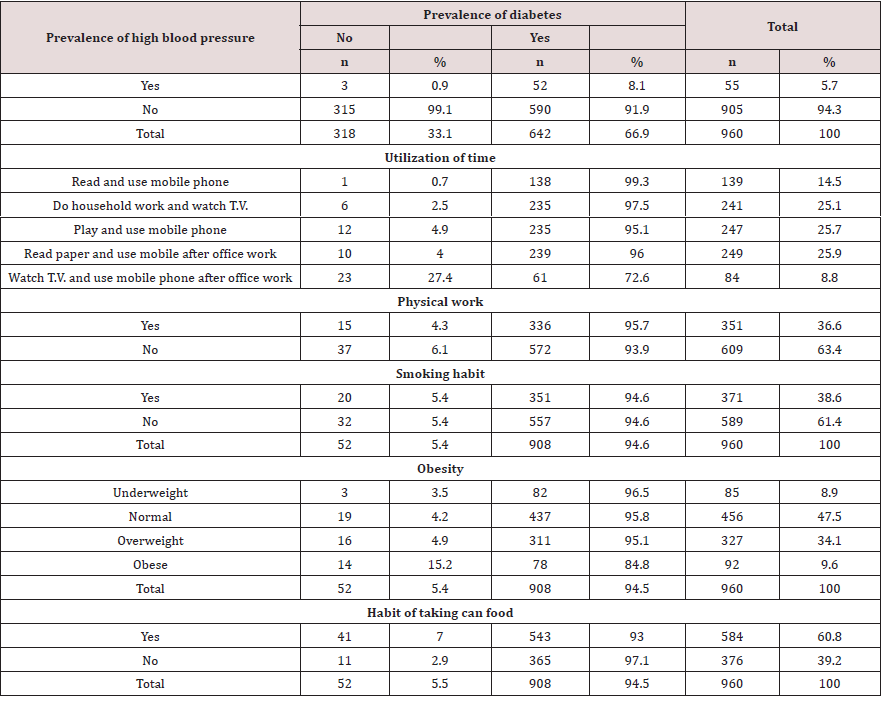
The investigated adults were classified into two groups according to the prevalence of diabetes. There were 66.9 percent diabetic respondents and 8.1 percent of them were suffering from high blood pressure (Table 1) also. The prevalence of diabetes and prevalence of high blood pressure were significantly associated as is observed by Chi-square test [χ2 = 20.17, p –value = 0.000]. The diabetic patients were at higher risk of high blood pressure by 45 percent compared to the risk of non-diabetic adults [R.R =1.45, S.E. ln (R.R.) = 0.0405]. It was also observed that 5.7 percent adults were suffering from elevated blood pressure but 94.5 percent of them were the patients of diabetes also. They were suffering for different periods. Eight of them were suffering for less than 5 years, 18 were suffering for 5 but less than 10 years, 11 were suffering for 10 to less than 15 years and 15 were suffering for 15 years and above.

Table 1: Distribution of respondents according to prevalence of diabetes and prevalence of high blood pressure.
lupinepublishers-openaccess-journal-diabetes-obesity

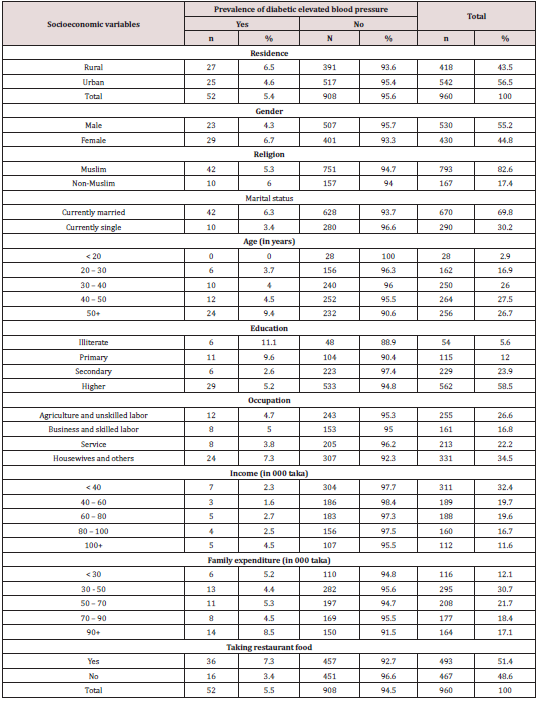
In the sample, the rural adults were 43.5 percent and 6.5 percent of them were simultaneously suffering from diabetes and high blood pressure (Table 2). Among urban adults the percentage of sufferers from both the diseases was 4.6. This differential in proportions was not statistically significant [χ2 = 1.571, p – value = 0.210]. But rural adults were at 40 % more risk of affecting from both the diseases compared to the risk of urban adults [R.R.= 1.40, S.E ln (R.R.) = 0.96. Among the investigated adults 44.8 percent were females and 6.7 percent of them were suffering from the aforesaid disease. The corresponding percentage among males was lower (4.3%). But the difference in percentages was statistically similar [χ2 = 2.679, p – value = 0.102]. However, females were at 55 percent more risk of the disease compared to the risk of males [ R.R.= 1.55, S.E. ln (R.R.) = 0.27]; R.R.=0.64, S.E. ln (R.R.) = 0.27, respectively]. The females are usually housewives. But this study indicated that most of the females were not housewives as the number of adults in this group was 331. In this group students and employed adults were also included. This group were usually not involved in physical labor and for that reason they had the more risk of affecting by diabetes and diabetes related disease. This fact was noted in different studies [24-26]. The present study also supported the fact, though there was no significant association between occupation and prevalence of the diseases under study [χ2 =3.635, p – value = 0.304]. But still housewives, students and unemployed adults had 63 percent more risk of affecting by the disease compared to the risk of other adults [R.R. = 1.63, S.E. ln (R.R.) = 0.27]. Skilled or unskilled physical labourers had lower risk of affecting by the disease [R.R.=0.82, S.E (R.R) = 0.60].

Table 2: Distribution of adults according to prevalence of diabetes high blood pressure and some Socioeconomic variables.
lupinepublishers-openaccess-journal-diabetes-obesity

The non-Muslim adults were 17.4 percent only and 6.0 percent of them were suffering from the disease. This percentage among Muslim adults was slightly less (5.3%). But there was no significant association between religion and prevalence of diabetes high blood pressure [χ2 = 0.129, p value = 0.720]. Even then, the non- Muslim adults were at higher risk of the disease compared to the risk of Muslim adults [R.R. = 1.13, S.E ln (R.R.) = 0.34]. Most of the investigated adults (69.8%) were currently married and 6.3 percent of them were suffering from the prevalence of diabetes high blood pressure. This percentage among currently single adults was 3.4. But this difference in percentages was not statistically significant as was observed by Chi-square test where χ2 =3.132 with p value = 0.076. But currently married adults were at 82 percent more risk of the disease compared to the risk of currently single adults [R.R. = 1.82, S.E. ln (R.R) = 0.40]. In studying different aspects of non-communicable diseases using the same set of data it was noted that the diseases were prevalent among elderly people [24,25,27]. The same phenomena was noted in this case also. The prevalence of diabetes higher blood pressure was significantly different among adults of different ages [χ2 = 11.731, p – value = 0.019]. The rate of prevalence was in increasing trend with the increase in ages of adults and this rate was higher (9.4%) among adults of ages 50 years and above. The elderly adults of ages 40 years and above had 69 percent more risk of suffering from the disease compared to the risk of younger adults [R.R.= 1.69, S.E. ln (R.R.) = 0.29]. Higher proportion of illiterate (11.1%) and primary educated adults (11.6%) were suffering from diabetes and high blood pressure. The different proportions of adults suffering from the disease was significantly different [χ2 = 10.849, p value = 0.013]. In the sample the higher educated adults were 562 and 5.2 percent of them were suffering from the disease. The percentages of illiterate and primary educated adults suffering from the disease were 11.1 and 9.6, respectively. The illiterate and primary educated adults had more than two times risk of the diseases compared to the risk of secondary and higher educated adults [R.R.= 2.27, S.E. ln (R.R.) = 0.28]. The percentage of adults coming from highest income group (Tk. 100.00 thousand and above) of families was 11.6 and 8.9 percent of them were suffering from the disease. Lowest proportion of affected adults (4.2%) were noted in lower income families (income < Tk. 60.00 thousand). But the differences in proportions of adults of different families of different levels of income were not statistically significant [χ2 = 5.642, p value = 0.227]. However, adults belonged to families of highest income level were at 80 percent more risk of the disease compared to the risk of adults of lower income group of families [R.R = 1.80, S.E.ln(R.R )= 0.34 ]. Similar results were noted in case of family expenditure of adults spending highest amount of money [R.R. = 1.79, S.E. ln (R.R.) = 0.30].

The present analysis indicated that 34.7 percent adults were involved in sedentary activities and 9.9 percent of them were affected by diabetes and elevated blood pressure. Another big group (25.7%) of adults were also passing their time watching television but they did household work also. A smaller proportion (2.5%) of them were suffering from diabetes high blood pressure. The proportions of affected adults involved in different activities except physical work were significantly different [ χ2 = 90.218, pvalue = 0.000]. Those who were only involved in sedentary activities were at higher risk of the disease by 827 percent compared to the risk of other adults [R.R.=8.27, S.E. ln (R.R.) = 0.25]. The percentage of physically inactive adults was 63.4 and 6.1 percent of them were affected by diabetes and elevated blood pressure. The corresponding percentage among physically active adults was 4.3. This difference in proportions was not significant. But physically inactive adults had a higher risk of suffering from the disease by 42 percent compared to the risk of other adults [R.R.=1.42, S.E. ln (R.R.) = 0.30].

The percentage of obese adults in the sample was 9.6 and 15.2 percent of them were affected by the prevalence of diabetic high blood pressure. With the increase in level of obesity there was an upward movement in the percentage of affected adults. Significant association between level of obesity and prevalence of diabetic elevated blood pressure was observed [χ2 = 19.405, p- value= 0.000]. The obese adults were at risk of the disease which was more than 3 times than the risk of non-obese adults [R.R =3.48, S.E. ln (S.E.) =0.29]. The analysis of the data showed that 51.4 percent adults had the habit of taking restaurant food and 7.3 percent of them were affected by the disease. This group of adults were at risk by more than two times compared to the risk of adults who were not habituated in taking restaurant food [R.R.=2.13, S.E. ln (R.R.) = 0.29]. The habit of taking restaurant food was significantly associated with prevalence of diabetic high blood pressure [ χ2 = 7.033, p – value = 0.008]. Similar was the case for the adults who were taking can food [χ2 = 7.487, p – value= 0.000; R.R.= 2.40, S.E. ln (R.R.) = 0.33]. The percentage of users of can food was 60.8 and 7.0 percent of them were suffering from the disease. For this group of adults, the risk of suffering was more than two times compared to the risk of adults who were not habituated in taking can food. The risk for adults not using can food was less [R.R.= 0.42, S.E. (R.R) = 0.33]. Among the adults 38.6 percent were smokers and prevalence of diabetes elevated blood pressure was observed among 5.4 percent of them. But smoking habit was not associated with prevalence of diabetic elevated blood pressure [χ2 = 0.311, p – value = 0.577]. Both the smoker and non-smoker adults were at similar risk of affecting by the disease [R.R.= 0.99, S.E. ln (R.R.) = 0.28].

Factor Analysis

The analytical results presented above gave the evidence that some of the socioeconomic variables, viz. age, education, utilization of time, level of obesity, food habit and use of can food were significantly associated with the prevalence of diabetes elevated blood pressure. But the study of this association did not indicate the most responsible factor in enhancing the afore mentioned health problem. To identify the most responsible factor for the prevalence of the disease among adults, factor analysis was done. Factors which were not enhancing the problem were also identified. Separate analyses for both affected and non-affected groups were done using all the data available for the study variables. It was already mentioned that the adults were classified into two groups. For each group important variable was identified observing the highest value of the absolute coefficient of the variables. Some variables were not included in the final selection of the coefficients as their communalities were less than 0.40 [22,23]. The inclusion of the variables for analysis was sufficient for both group of adults as KMO= 0.585, χ2 = 385.731, p-value=0.000; and KMO= 0.592, χ2 = 3332.688, p value = 0.000, respectively (Table 3). For the affected adults, the most responsible variable was occupation followed by gender variation, income and expenditure. For the non-affected group, the most important variable was gender variation followed by use of can food and occupation.

Discussion

The different results discussed in this paper was derived from the data collected from 960 adults of ages 18 years and above residing in both urban and rural areas of Bangladesh. Most of the investigated adults (56.5%) were from urban area as the data were collected by some doctors and nurses from and nearby their working places. Among the investigated adults 5.4 percent were suffering simultaneously from diabetes and high blood pressure, though the percentage of diabetic patients in the sample was higher (66.9%). In urban area higher percentage of diabetic adults were noted in some earlier studies also [20,21,24,25] and these adults were suffering from different types of non-communicable diseases. In this analysis, no significant association between residence and prevalence was observed but rural adults were at higher risk (40% higher) of affecting by the disease compared to the risk of urban adults. This risk was higher (55% higher) among the female adults. But prevalence of the disease was independent of the gender. The risk of suffering from the disease by male adults was lower [R.R.=0.64]. Similar findings were noted in other studies [24,25]. The independence was observed in studying the association of prevalence of the disease with religion and marital status of the adults.

In different studies, in both home and abroad, aged males and females were at higher risk of different types of non-communicable diseases including higher blood pressure [28-34]. This study also indicated that with the increase in ages there was significant increase in the prevalence rate of diabetes and high blood pressure. The adults of ages 40 years and above had the higher risk of affecting by the disease compared to the risk of younger adults. With the increase in level of education of adults there was a downward shift in the prevalence rate of diabetes elevated blood pressure. The risk of illiterate adults of affecting by the disease was more than two times than the risk of educated adults. Housewives, students and unemployed adults were not directly doing any physical labor and this physical inactivity was the important cause of higher risk of affecting by the disease. In other studies, also it was observed that this group of adults were more exposed to different types of non-communicable diseases [24,25]. Due to this physical inactivity factor analysis also indicated that occupation was the most important factor for the prevalence of the disease. On the other hand, skilled or unskilled workers had lower risk of affecting by the disease. It was also reflected in doing factor analysis. However, level of occupation was independent of level of prevalence of the disease.

Physical inactivity and involvement in sedentary activities are two risk factors for many types of NCDs. It was noted in both home and abroad [27-30]. This study also indicated that the adults involved in sedentary activities had more than 8 times risk of facing the problem of diabetes and high blood pressure simultaneously.
Obesity is one of the highly risk factor for NCDs. It was noted in both home and abroad [28-33]. This analysis provided the evidence that with the increase in level of BMI there was a significant increase in the rate of prevalence of diabetes elevated blood pressure. The obese adults had more than 3 times risk of facing the problem of diabetes and high blood pressure compared to the risk of other adults. In earlier studies it was noted that habit of taking restaurant food and can food be the risk factors for NCDs [24,25]. The present analysis showed that majority (51.4%) of the adults were habituated in taking restaurant food and can food (60.8%). Both these two groups of adults had more than two times risk of affecting by the disease compared to the risk of adults who were not taking either restaurant food or can food. Non-consumption of can food was the second most important factor for non-prevalence of diabetes elevated blood pressure.

Conclusion

The present paper was prepared with an objective to study the impacts of different socioeconomic variables on the prevalence of diabetes and high blood pressure among adults of ages 18 years and above. The targeted adults were investigated by some doctors and nurses from their working places using quota sampling plan to cover around 70 percent diabetic patients so that some of the diabetic adults were suffering from other non-communicable diseases also. But during data collection,66.9 percent diabetic adults were interviewed, and total investigated adults were 960. Among these diabetic adults, 8.1percent were suffering from both diabetes and elevated blood pressure for different periods [1].
These adults were classified into 4 groups according to their sufferings for less than 5 years, 5 - < 10 years, 10 - < 15 years and 15 years and above. The number of total diabetic adults belonging to these 4 periods were significantly different as was observed during discriminant analysis. Among the investigated adults 43.5 percent were from rural area, 44.8 percent were females, 17.4 percent were non-Muslims, 69.8 percent were currently married, 54.2 percent were of ages 40 years and above, 5.6 percent were illiterate, 34.5 percent were housewives, students and unemployed adults. In each case of these demographic characteristics higher proportion of the adults were suffering from diabetes and high blood pressure simultaneously compared to the proportions of sufferers of their counterparts. The adults possessing these demographic characteristics were at higher risk of the diseases under consideration. So far economy concern the adults belonging to families of highest level of income and highest level of expenditure were at higher risk of the disease compared to the risk of adults of other families.
Among the adults 34.7 percent were involved in sedentary activities, 63.4 percent were physically inactive. Both these groups of adults were at higher risk of the disease compared to the risk of adults involved in some sort of physical activities. So far food habit concern, 51.4 percent were habituated in taking restaurant food and 60.8 percent were used to take can food. Both these groups of adults were at higher risk of the disease compared to the risk of their counter parts. Obese adults (9.6%) were at higher risk of the disease compared to the risk of non-obese adults. From the results of factor analysis and risk ratio, it could be concluded that females, physically inactive adults and adults from affluent families had higher risk of affecting by the prevalence of diabetes elevated blood pressure. On the other hand, males, skilled or unskilled physical workers and non-consumers of can food were less affected by the prevalence of diabetes elevated blood pressure.
As the prevalence of the disease is associated with maximum socioeconomic variables, the problem of prevalence cannot be avoided but intensity of the problem can be reduced if some plans related to proper health care can be formulated and action is taken to implement those plans. The following steps can be taken for healthy society and reduced rate of NCDs affected people.

1. People should be encouraged to maintain healthy body weight or to reduce the BMI.
2. People should be advised to eat heart- healthy food and food free of much sugar and salt.
3. People should be encouraged to take more fresh vegetables and fruits.
4. Elderly people should consult the doctor for proper medication regularly so that blood pressure is properly controlled.
5. Each and every one should do some sort of physical work whenever it is possible.
6. Each and every one at least walk a while whenever it is possible.
7. Everyone should avoid sedentary activities as per as possible.
8. Health authority in both urban and rural areas can provide a service free of cost to check up the blood pressure, blood sugar and body weight at least twice a year. This can be done by forming different charitable trusts in the community or forming social workers groups.

Read More about Lupine Publishers Journal of Diabetes and Obesity Please Click on below Link:
https://diabetes-obesity-lupine-publishers.blogspot.com/