Lupine
Publishers- Trends in Civil Engineering and its Architecture
The current study focuses on a sub-urban sector of the historical
centre of Sant’Antimo, placed in the province of Naples (Italy),
in order to estimate the expected damage scenario due to earthquakes by
using a probabilistic approach. First, aiming at performing
an exposure analysis, the typological and structural characterization of
buildings within the urban sector has been done with the
purpose to redact the CARTIS form, which was developed by the PLINIVS
research centre in cooperation with the Italian Civil
Protection Department in the framework of the ReLUIS research project.
Subsequently, the vulnerability form developed by the first
Author has been used for the vulnerability assessment of the study area.
Furthermore, the typological fragility curves, according to
the EMS-98 scale, have been derived for the building stocks located in
the sub-urban sector. Finally, the probabilistic approach for
the urban risk evaluation has been applied in order to derive the damage
scenario for a set of different magnitudes and site-source
distances.
Keywords: Seismic risk assessment, CARTIS form, Damage scenarios, Fragility curves, Probabilistic method
Keywords: E: Exposure, V: Vulnerability, H: Hazard, DSHA: Deterministic Seismic Hazard Analysis, DPM: Damage Probability
Matrices, UNDRO: United Nations Disaster Relief Co-ordinator
The large-scale seismic risk is a useful tool for assessing the
susceptibility of a sample of buildings to overcome, in a given period
of time, a certain seismic event of an assigned entity. Seismic risk can
be understood as the combination of three factors, such as Exposure
(E), Vulnerability (V) and Hazard (H). The Exposure is connected
to the nature, quantity and value of properties and activities of the
area that can be influenced directly or indirectly by the seismic
event. Vulnerability can be defined as the intrinsic potential of
buildings to suffer a certain level of damage when subjected to a
seismic event of defined intensity. Finally, Hazard is considered as
the occurrence probability of the asymptomatic event of a certain
intensity in a specific site, it depending mainly on the geographic
position and the geological characteristics of the site where the
event is expected [1-3]. These three factors are interconnected
to each other and they are influenced by uncertainties due to the
variability of the variables involved, represented by buildings in the
case under study.
However, the risk, independently from the natural phenomena,
is to be considered as the attainment of a level of social and economic
“losses” [4]. These losses are commonly identified in terms of costs
that should be supported for the system to restore its original
configuration. The protection strategies of built-up areas must,
therefore, represent a useful and concrete investment tool for the
planning of the risk mitigation and for the protection of both people
and constructive heritage. As a result, a model for vulnerability
assessment and for the evaluation of economic and social losses
would not only be able to estimate future potential losses due to
the occurrence of earthquakes that can affect a particular region,
but it should also be used to prepare and implement risk mitigation
measures [5]. Generally, the heterogeneity of buildings, especially
in historical centres, is still one of the most important issues
concerning the large-scale seismic risk evaluation.
The methodologies used for large-scale estimations are mainly
based on observational data for a significant sample of buildings considered as isolated [6], therefore neglecting the so-called
building aggregates, where interactions and the connections among
adjacent buildings modify significantly their seismic behaviour.
Generally, the most refined analysis methods, based on the FEM
technique, for evaluating these interactions among buildings
placed into historical centres are generally time consuming and
require greater computational efforts. So, for the evaluation of the
seismic vulnerability of building aggregates, which represent the
heart of the historical centres of Mediterranean area countries,
speedy methods based on collection of simple data (drawings and
in-situ inspections) are proposed with the purpose to provide a fast
vulnerability indicator [7].
The method was initially developed by the Italian National
Group for the Defence against Earthquakes (GNDT), which take
profit of post-earthquake damage observations of masonry
buildings in Italy [8]. Subsequently, quick methods were proposed
by many European researchers into several case studies in Spain
[9], Italy [10], Romania [11], Portugal [12-14] and Iran [15]. In
addition, some other studies for the urban seismic vulnerability
assessment, including estimation of social costs and human losses,
were also delivered [16,17].
The peculiarities of these methodologies lie in the fact that
they can be combined with the macroseismic method [18] for the
assessment of damage scenarios. In particular, the macroseismic
methodology is able to evaluate the susceptibility at damage of
building stocks under variable seismic hazards usually defined
according to the EMS-98 macroseismic intensity scale [19]. The
possibility of identifying the most vulnerable samples of buildings
allows mitigating the effects of seismic phenomena. On the other
hand, the probabilistic approach for seismic risk estimation was
introduced in the late 1960’s [20]. It is particularly useful for the
ability to provide results that can be easily overlapped with other
types of environmental risks.
The use of seismological data strictly connected to the
characterization of seismogenic sources in terms of maximum
expected magnitude and recurrence (number of events “E” in a
period “T”) of the phenomenon have allowed to define more and
more scenario analysis models accurate for earthquake mitigation.
The intensity occurrence frequency, corresponding to a ground
motion with a certain return period, requires a continuous
observation period equal to ten times the return period, assuming
that ten observations are sufficient to get a good estimation of the
return frequency. Similarly, making use of the confidence interval
concept [21], the number of years of continuous observation
necessary to validate ground motion hazard estimates at a site is
analytically derived.
An alternative to the seismic risk probabilistic evaluation
method is the Deterministic Seismic Hazard Analysis (DSHA),
which refers to the maximum credible event able to produce
what is reasonably considered the highest level of shaking into a
given site. The method takes into account the historical seismicity,
the observed events and the characteristics of sources that may
affect the site in order to define the design earthquake in terms
of magnitude, distance and focal mechanism. The DSHA does not
consider the rate of recurrence of earthquakes, but contemplates
the scenarios able to generate the level of shaking probably more
felt in the considered site; in contrast, the probabilistic approach
takes into account all the possible shaking scenarios [22].
The seismic risk analysis on a regional scale requires the
development of simplified methods and models capable of
characterising both the capacity of buildings exposed to risk and
the seismic demand. Therefore, a large-scale risk analysis does not
refer to individual structures, but to classes of buildings having
vulnerability expressed as a function of structural parameters
collected by standard in situ investigations. Another interesting
method for urban risk evaluation is based on the holistic approach
[23], which describes seismic risk through an index. Expected
building damage and losses in the infrastructure, obtained from
future loss scenarios, are basic information for the evaluation of
physical risk in each urban unit of analysis. Starting from these
data, a physical damage index is obtained. The proposed method
is developed for a multi-hazard evaluation and, therefore, it is
necessary to dispose of physical damage estimations for all the
significant hazards. Often, when historical information is available,
the principal hazard, and thus the most potential critical situation,
can be usually identified.
The risk holistic evaluation by means of indices is achieved
affecting the physical risk with an impact factor obtained from
contextual conditions, such as the socio-economic fragility and the
lack of resilience, that aggravate the initial physical loss scenario.
Available data about these conditions at urban level are necessary
to apply the method. From the described scenario of available
analysis methods it emerges that the choice of the most reliable
one is a very critical issue, since all of them could predict well the
seismic hazard into a given urban area. In the current paper, the
seismic scenario analysis based on the probabilistic approach has
been used. It has been applied to an urban sector located in the
municipality of Sant’Antimo, a district of Naples (Italy), with the
final aim to define the risk index of the analysed area starting from
the recurrence of seismic events in a certain return period.
The Historical Centre of Sant’antimo
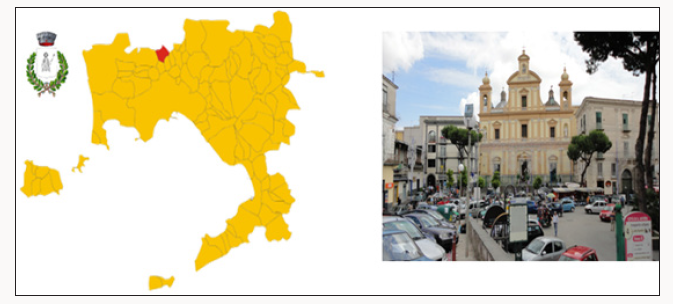
Sant’Antimo (Figure 1) is an Italian town with 33.905 inhabitants
located 67m on the sea level and placed 16 Km far from the
historical centre of Naples. The urban centre is developed between
the Appia Street (East) and the Napoli-Foggia railway line (West),
where a dense network of roads from the various centres of this
area is convergent. The built-up area of Sant’Antimo appears rather
compact and expands radially. From the historical and geographic
point of view, it is part of the Frattamagiore’s area and constitutes
an urban unicum with Melito. The first urban nucleus of Sant’Antimo
dated back from IV - III century before Christ. Subsequently to the
regular layout of the cadastral division, in the V century before
Christ the characteristic road scheme of the medieval period, with
the characteristic winding roads that crossed the agglomerations
mostly erected around a church or a castle, was developed. In the
case of Sant’Antimo the medieval nucleus arose in the presence of
both artefacts. The period from VI century to XVI one showed the
changing political conditions of the Campania Felix territory. In fact,
since the year 476, with the fall of the Western Roman Empire, the
period of foreign domination and political instability in the region
began.
Figure 1: The city of Sant’Antimo in the Campania region of Italy.
At the urban level it can be assumed that the continuous
barbarian invasions for the conquest of the territory have led the
population to abandon the scattered settlements and to concentrate
in few more secure urban habitats, generally around the Christian
places of worship. The traditional historiography of Sant’Antimo
helps to support this thesis and provides information about its
origins, establishing in 816 the foundation of the town, when the
duke of Naples, Antemio, founded an aedicule in honour of the
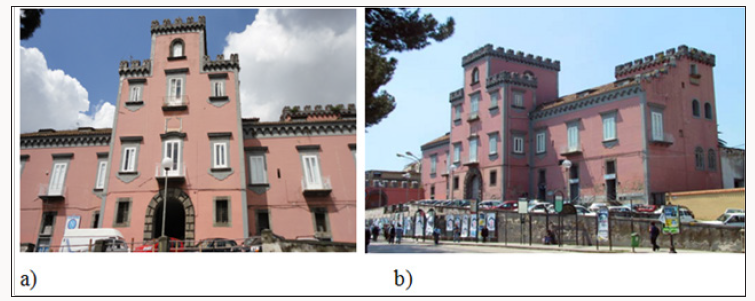
saint. In the middle of the town there is the main square, today
called Piazza della Repubblica, where the Baronial Castle is located
(Figure 2). This castle was built in the Renaissance period, as it is
noticed from the characteristic architectural structures, such as the
entrance hall, the loggia made of piperno and the porticoes. The
central and lateral towers, instead, refer to the original medieval
structure. Until the beginning of XIX century, the castle was
surrounded by two gardens: one in front of the building, located
near the current Republic square, the other placed behind the
building, covering all the current area of Trieste and Trento Street.
Figure 2: The Baronial Castle: a) front and b) lateral views.
The noble feudalists, who lived there, namely the Dukes
Revertera until 1629, the Dukes and Princes Ruffo and the
Princes Mirelli until 1806, administered the feud of Sant’Antimo,
conditioning its socio-economic development. In fact, other than
rents of the Feudal lands, they offered the use of own services after
the payment of a tribute. In addition, they had the ability to both
appoint the judge of the territory for the administration of justice
and validate appointments, as well as the capacity to dismiss the
elected people from the municipal administration. The town of
Sant’Antimo was an agricultural centre of primary importance
until the middle of XX century, when the treatment of a remnant
of the processing of grapes allowed to play the industrial role of
the world’s largest producer of the so-called Cremore of Tartaro, a
substance which is often used in combination with small amounts
of baking soda in baking powder for desserts. This work, already
present in the early XVI century, assumed, until the beginning of the
XX century, a fundamental function in local development and the
determination of a widespread well-being, which guaranteed the
civil and industrial development of the entire area. The Cremore of
Tartaro, obtained for hot treatment, in large copper pots, from the
residues of grapes, was then defined by the Britannica Encyclopedia
as “S Antimo’s Cremore “. In this context, education spread and a
class of professionals formed and distributed their experiences
throughout the country: men as Nicola Romeo, founder of the Alfa
Romeo company, and Cardinal Alessandro Verde, born at that time.
The Cartis Form
Large scale risk analyses at national and regional levels, with
regard to natural phenomena such as seismic events, require
qualitative and quantitative evaluation of the exposed elements.
In this framework, the typological and structural characterization
of built-up areas has usually the intent to investigate the features
of constructions from the qualitative point of view. In fact, the
constructive techniques were differentiated over the centuries, due
to local cultures and urban conditioning, which in some cases had
a major impact on the characteristics and qualities of buildings,
resulting in substantial differences also in terms of response
towards seismic events. The CARTIS form (acronym of Typological
and Structural Characterization of Buildings) is aimed at detecting
common building typologies within the communal and subcommunal
areas (called sectors), characterized by homogeneity in
terms of age and constructive techniques [24].
The form was initially developed by the PLINIVS research centre,
in collaboration with the Italian Civil Protection Department (DPC),
within the ReLUIS 2014-2016 Research Project for the evaluation
of Italian territorial exposure. This form mainly refers to ordinary
buildings (masonry and r.c), with regular inter-storey heights and
spacing among vertical structural elements. The survey activity
by the CARTIS form should be extended to the entire municipal or
parts of it, thereof, provided that the “population of buildings” is
exhaustive. The form is divided into four sections:
a) Section 0: for the identification of the Municipality and
the sectors identified therein;
b) Section 1: for the identification of each of the predominant
typologies characterizing the generic sub-sector of the assigned
Municipality;
c) Section 2: for the identification of general characteristics
of each typology of constructions;
d) Section 3: for the characterization of structural elements
of all individuated construction typologies.
The subdivision of the territory must be addressed taking
into account historical, bibliographic and documentary inquiries
that allow the various constructive phases of buildings to be
defined, implicitly drawing upon the indications for a final
compartmentation. To this purpose, bibliographic and documentary
sources can be juxtaposed by cartographic and cadastral ones.
Aerial view photos and photos from Satellite, also using the most
modern tools available through the web, can be also useful. In this
context, the assessment of the exposure of residential properties
may be proposed in terms of “inventory characterization” of the
population of residential buildings. This can be obtained through
the statistical evaluation of the distribution of ordinary buildings,
grouped into seismic vulnerability classes, on a territorial scale
with the built-up area divided into square grids having minimum
side of 500 m. In the examined case study, the sub-sectors have
been identified taking into account the construction period and,
consequently, the normative codes used for their erection.
First, the first built area, characterized by buildings erected in
both the early years of the last century and the post-war period,
has been identified. Subsequently, the so-called expansion areas
have been identified, giving rise to the definition of the remaining
compartments. The use of the PRG (General Regulator Plan)
cartography, dated 1977, superimposed on the present cartography
of the Municipality, has allowed defining the historic centre area,
characterized by almost all of masonry buildings. The buildings
of the first establishment were masonry constructions made of
rough stones, especially built in the first post-war period. After that
period, the buildings were made of square masonry blocks. With
the advent of reinforced concrete, around 1970s the first buildings
were erected and grouped into construction blocks. There were
also a high percentage of structures assembled in aggregates with
complex geometries, especially in the area of the historic centre.
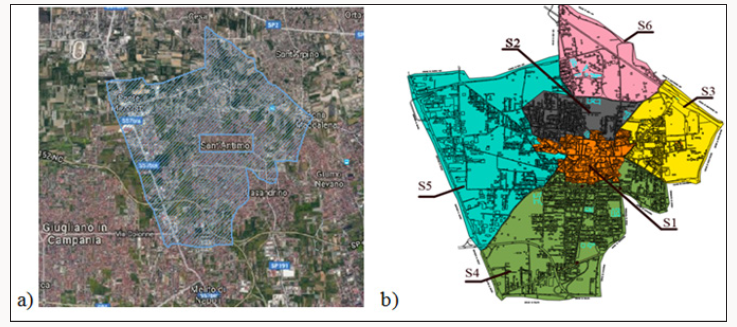
For the study area, six sub-sectors have been identified (Figure 3).
Figure 3: General cartography of Sant’Antimo: a) territorial area and b) individuation of urban sectors.
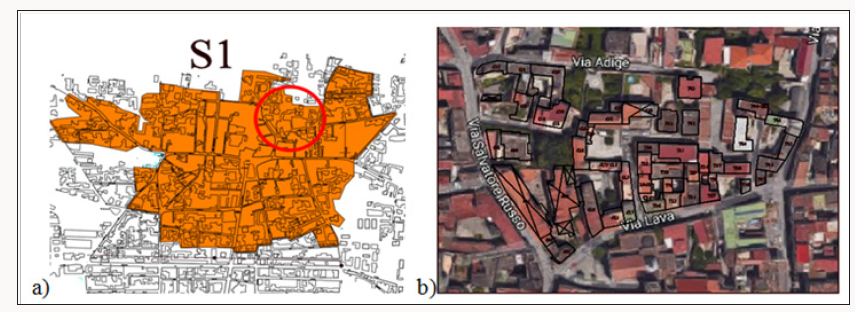
In the current paper the attention is focused on the typologicalstructural
characterization of a sub-sector of the sector 1, circled
in red in Figure 4. This sub-sector represents the first residential
centre of the Sant’Antimo municipality, with structures built in the
early 1900s and after the Second World War. This area represents
the centre of commercial activities and includes also numerous
historic buildings, such as the Baronial castle, having Renaissance
style but with the first implant dated from the Middle Ages, the
Church of Santo Spirito and the Chapel of Sant’Antimo’s priest
and martyr. In that area, the buildings are erected in aggregate
characterized by the lack of effective connections. The prevailing
construction type is a masonry structure made of tuff block stones,
which represent the local masonry obtained by extracting stones
from the ground. This area is characterized by the presence of
cavities with depths of more than 30m.
Figure 4: The sector 1 of Sant’Antimo: a) extension and b) the investigated sub-sector.
The masonry walls, usually with thickness of about 65cm, are
of sack type with the interspace among external layers filled with
stone remains and mortar. The foundations consisted in arranging
the masonry walls directly on the ground at a depth of about 1.50m.
In addition, there were numerous roofs without the presence of
steel ties. On the other hand, albeit in small numbers, r.c. structures
were also detected. These constructions were realized over the
years from 2000 to 2017, often as result of the demolition of old
buildings and the re-construction of new ones. Exposure analysis
of an area refers to the nature, quality and quantity of risk assets.
Therefore, the estimate of exposure consists on both quantification
of artefacts (buildings, infrastructures, etc.) and evaluation of the
number of people likely to be involved in the seismic event and
able to react to it. In general, populations, artefacts and buildings
are chaotically distributed in the territory: exposure analysis tends
to evaluate the different concentration levels. There is a direct
proportionality between the concentration of the risk elements
and the exposure level. In fact, greater the risk elements at risk and
greater the exposure will be.
Figure 5: Volumes of investigated structural units.
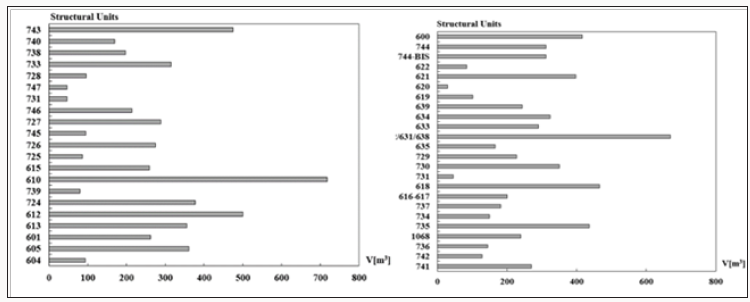
In any case, in order to make a more accurate assessment, the
analysis of exposure should not be linked solely to the number of
risk elements concentrated in a certain area, but it should be also
associated to the evaluation of the function importance that is
exerted on the territorial system. In the current study, the seismic
exposure evaluation is based on the calculation of the total volume
V, expressed in m3, of buildings within the inspected area (Figure 5).
This choice takes into consideration the possibility of conducting an
urban-scale seismic risk analysis, which is not influenced by the use
of exposed buildings, but is a function of the volume of buildings.
In this case, there is a possibility to solve the problem concerning
the building category using the volume of such aggregates as the
sole exposure indicator. As can be seen in Fig. 9, there is a marked
heterogeneity of volumes, ranging from a minimum value of 28.6m3
for aggregate 620 to a maximum value of 717m3 for aggregate 632.
Therefore, greater volumes correspond to greater susceptibility at
exposure.
The vulnerability assessment of the sub-sector chosen within
the historical centre of Sant’Antimo is considered as initial stage of
a more wide study having the final purpose to evaluate the seismic
risk of the whole urban built-up area investigated. The inspected
masonry aggregates generally develop in elevation from 2 to 3
stories. The inter-storey height is about 3.00-4.00m for the first level
and 3.00-3.50m for other floors. Horizontal structures are made of
either steel-hollow tile floors or timber ones. Roofing structures are
often composed of double pitch r.c. beams with clay tile covering
(Figure 6). In many cases the presence of an incongruous and
brittle binder in the walls, which lost over time its characteristics,
compromises the static nature of the buildings themselves and,
sometimes, of the whole aggregate. Therefore, renovation works
to be carried out are planned, they usually leading towards the
construction of new structural parts generally not perfectly linked
to the existing structures.
Figure 6: Masonry building typologies within the investigated sub-urban sector.
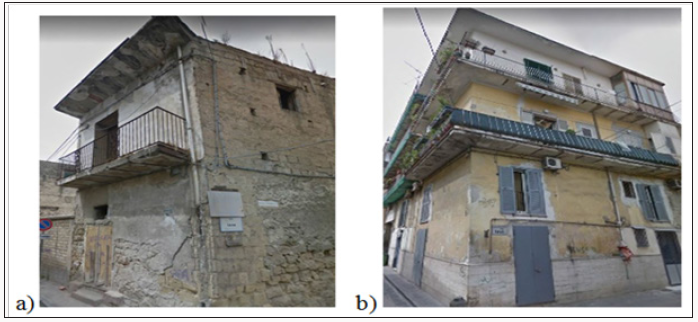
The presence of these vulnerability factors increases the
possibility of collapse and instability of such historical buildings
when they will be subjected to seismic actions. The lack of
connections among perimeter walls orthogonal to each other
(corners) does not guarantee a global behaviour of the structure.
As a negative consequence, in case of earthquake, the activation
of the most risky out-of-plane collapse mechanisms (overturning,
vertical arch effect, horizontal arch effect, corner overturning), that
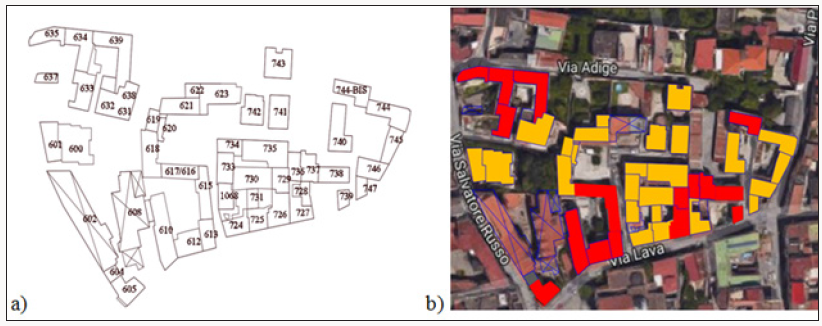
may invest one or more structural units, can occur. The sub-sector
under study is composed by 44 buildings, which are classified
according to the Building Typology Matrix (BTM) into M3.3 class
masonry structures with steel floors and rc slab (36%) and M3.4
class masonry structures with rc floors (64%) (Figure 7).
Figure 7: a) Numbering and b) typological classes of masonry buildings in the sub-sector of Sant’Antimo under study.
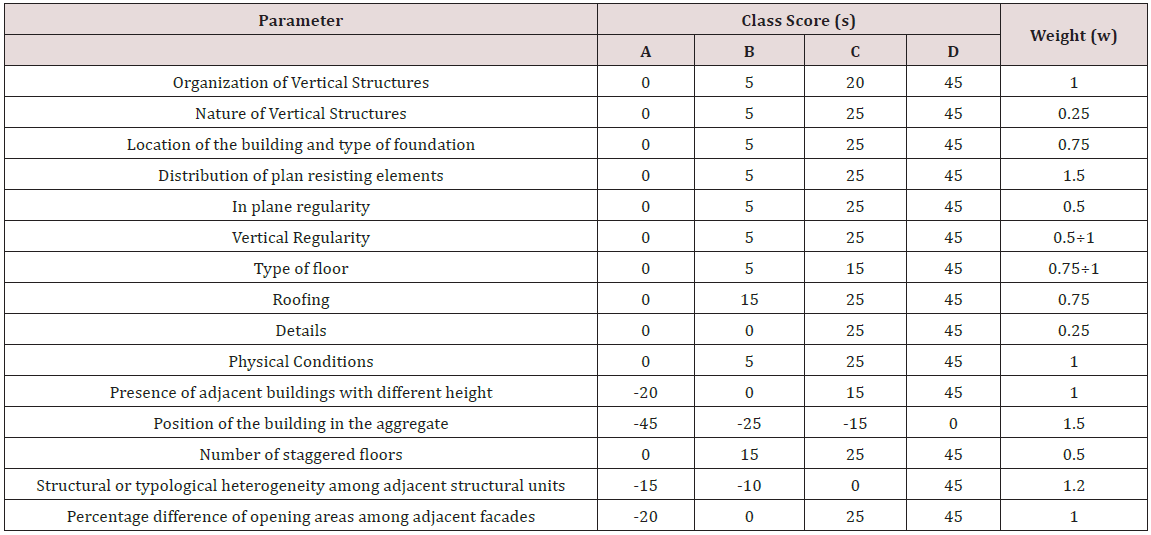
Aiming at implementing a quick seismic evaluation procedure
for masonry aggregates, it has been used the new vulnerability form
proposed by the first Author (Table 1) [25,26,27]. The application of
such a form to the selected sub-urban sector has allowed evaluating
the seismic vulnerability of investigated buildings, as illustrated in
Figure 8. In particular, from previous results, it is possible to notice
that the most vulnerable aggregate of the typological class M3.3 is
the number 744-bis, which has a vulnerability index VI= 0.46. On the
other hand, for the typological class M3.4, the aggregates having the
highest vulnerability are those with numbers 618 and 724, showing
indexes equal to 0.46 and 0.45, respectively. These aggregates,
composed of tuff stones, have an irregular configuration, both in
plan and in elevation, and they are not in a very good health state
(Figure 9).
Figure 8: Ranking of buildings belonging to M3.3 (a) and M3.4 (b) typological classes.
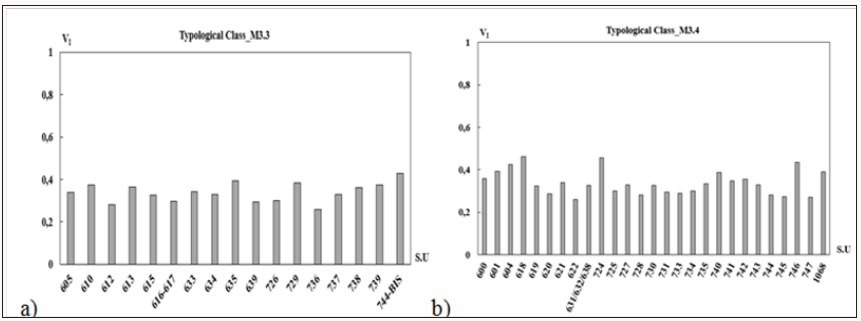
Figure 9: Views of the most vulnerable aggregates: a) n. 744-bis (M3.3 class) and b) n. 618 (M34 class).
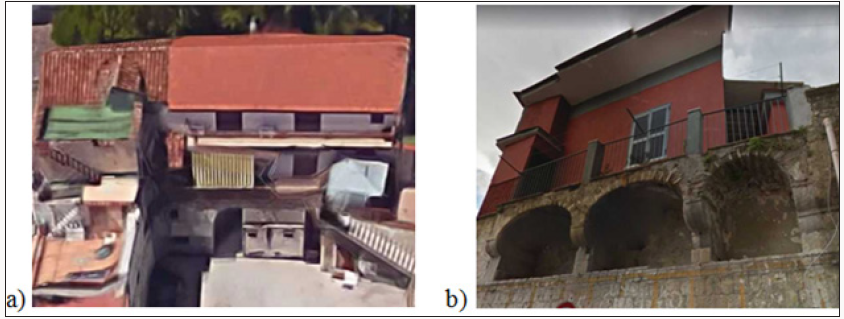
Table 1. The new vulnerability assessment form for buildings in aggregate.
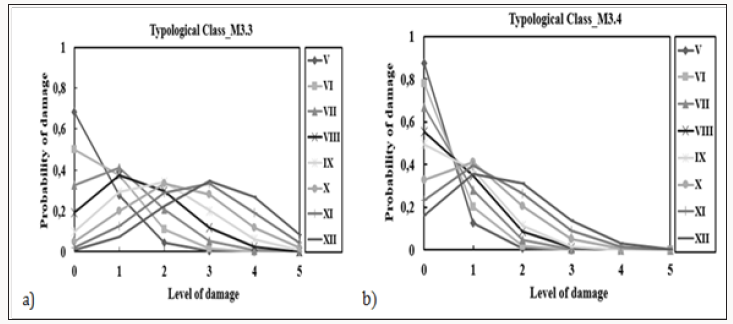
The Damage Probability Matrices (DPM) expresses the
occurrence probability of a certain damage level of different
typological classes for different seismic intensity levels. They can
be generated by referring to a generic damage scale expressed
in terms of costs (such as the ratio of the repairing cost over
the reconstruction one), which can be intended either in
phenomenological terms or according to a qualitative estimation
of the different damage degree that buildings may undergo in case of seismic events. In the case under study, the DPM have been
derived for the 2 vulnerability classes of buildings (M3.3 and M3.4)
by considering macroseismic intensities from V to XII (Figure 10).
From the practical point of view, DPM can be constructed after
binomial coefficients are known. In the examined case, the study
under consideration is that of the GNDT SSN-2002 working group
[28], whose binomial coefficients are obtained from statistical
analysis of the damage suffered by the various building types on
the basis of occurred earthquakes.
Figure 10: Damage Probability Matrices for building typological classes within the sub-sector of Sant’Antimo.
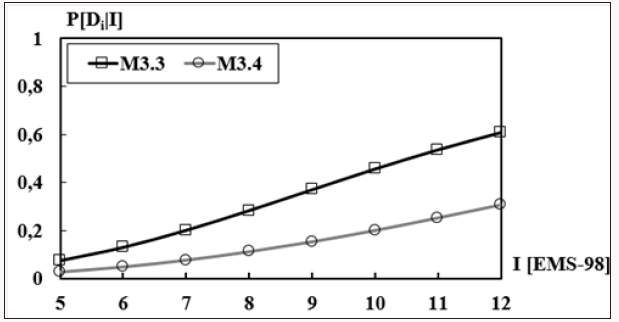
The achieved binomial distribution, corresponding to the
conditional probability of having a certain damage threshold
(Di) depending on the macroseismic intensity (I) (Figure 11). In
this figure, the binomial distribution has the highest binomial
coefficients for the M3.3 typological class, while the M3.4 one
exhibits the best seismic performances with significantly reduced
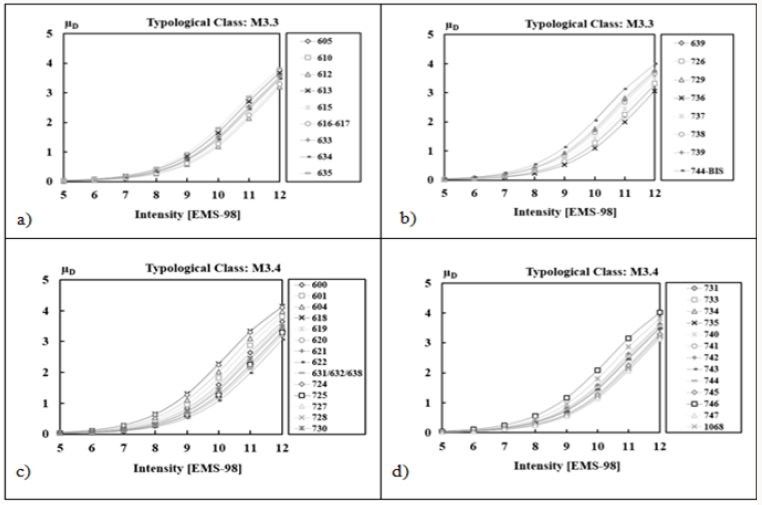
values of those coefficients. Subsequently, the fragility curves
have been derived to estimate the collapse probability of analysed
structural units under assigned seismic actions. More in detail,
these curves can be properly defined as the probability P[SL|I] that
a building reaches a certain limit state “LS” at a given intensity “I”
defined according to the European Macroseismic Scale (EMS-98).
Figure 11: Distribution of binomial coefficients for the inspected building classes.
In particular, they depend on both the vulnerability index
(IV) and the ductility factor Q, the latter variable according to
the ductility of typological classes. In order to provide the best
vulnerability function between the GNDT method and the EMS-98
one, a ductility factor Q equal to 2.3 has been considered. In order
to assess the damages should be suffered by building aggregates
under different earthquakes [29-31], the methodology proposed by
Lagomarsino, Giovinazzi [32] for plotting fragility curves illustrated
in Figure 12 has been used. The generated fragility curves depend
on both the vulnerability index of buildings and the macroseismic
intensity. Starting from the above curves, a seismic damage scenario
for the examined urban sector of Sant’Antimo has been derived, as
shown in the next section.
The Seismic Risk Assessment
The risk is defined for management and mitigation purposes
as potential economic, social and environmental consequences of
dangerous events that may occur within a given period of time.
However, in the past, the concept of risk has been fragmented in
many cases, according to each scientific discipline involved in its
assessment. Risk requires a multidisciplinary assessment that
takes into account not only the expected physical damage, the
number and type of casualties and the economic losses, but also the
conditions of social fragility and the lack of resistance conditions
that favour second-order effects when a hazardous event hits an
urban centre.
Figure 12: Fragility curves for building compounds of (a, b) M3.3 and (c, d) M3.4 typological classes.
According to the United Nations Disaster Relief Co-ordinator
(UNDRO), the risk R can be intended as linear combination of
hazard, vulnerability and exposure as follows [33]:
Where E is the exposure, P [Di|M=M*; d=depi] is the conditional
probability to have a specific damage threshold (Di), given
magnitude (M) and epicentral distance (depi) and P[E>E*(Δt)] is the
seismic hazard, or rather the probability that a seismic event (E)
with certain IM (Intensity Measure) occurs in a given time (T).
In the case under investigation, the exposure assessment is
based on the analysis of individual aggregates volumes. The severity
of seismic damage has been analysed thanks to predictive analyses
where, during the earthquake, buildings with the same structural
characteristics would be subjected to a damage that decreases
when the epicentral distance increases.
To this purpose, a moment magnitude range of [4÷6] and
epicentral distances varying in the range [5÷30Km] have been
defined. Subsequently, the attenuation law of seismic effects
according to the formula proposed by Crespellani, [34] has been
taken into account as follows:
I = 6.39 +1.756Mw− 2.747ln(D + 7) (2)
Where Mw is magnitude and D is the site-source distance
expressed in Km. The correlation law between seismic intensity
and moment magnitude for different epicentral distances (Figure
13). Later on, considering the damage parameter μD representative
of the damage levels of the EMS-98 scale, the expected number
of buildings that undergo a certain damage level under different
grade earthquakes has been determined for the inspected subsector
of Sant’Antimo. So, the damage maps for nine combinations
of epicentral distances and seismic intensities have been plotted
(Figure 14).
Figure 13: Linear correlation between moment magnitude and seismic intensity for different epicentral distances.
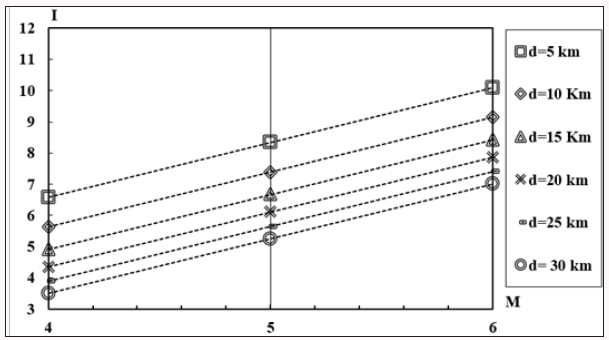
Figure 14: Damage scenarios of the investigated sector within the historical centre of Sant’Antimo.
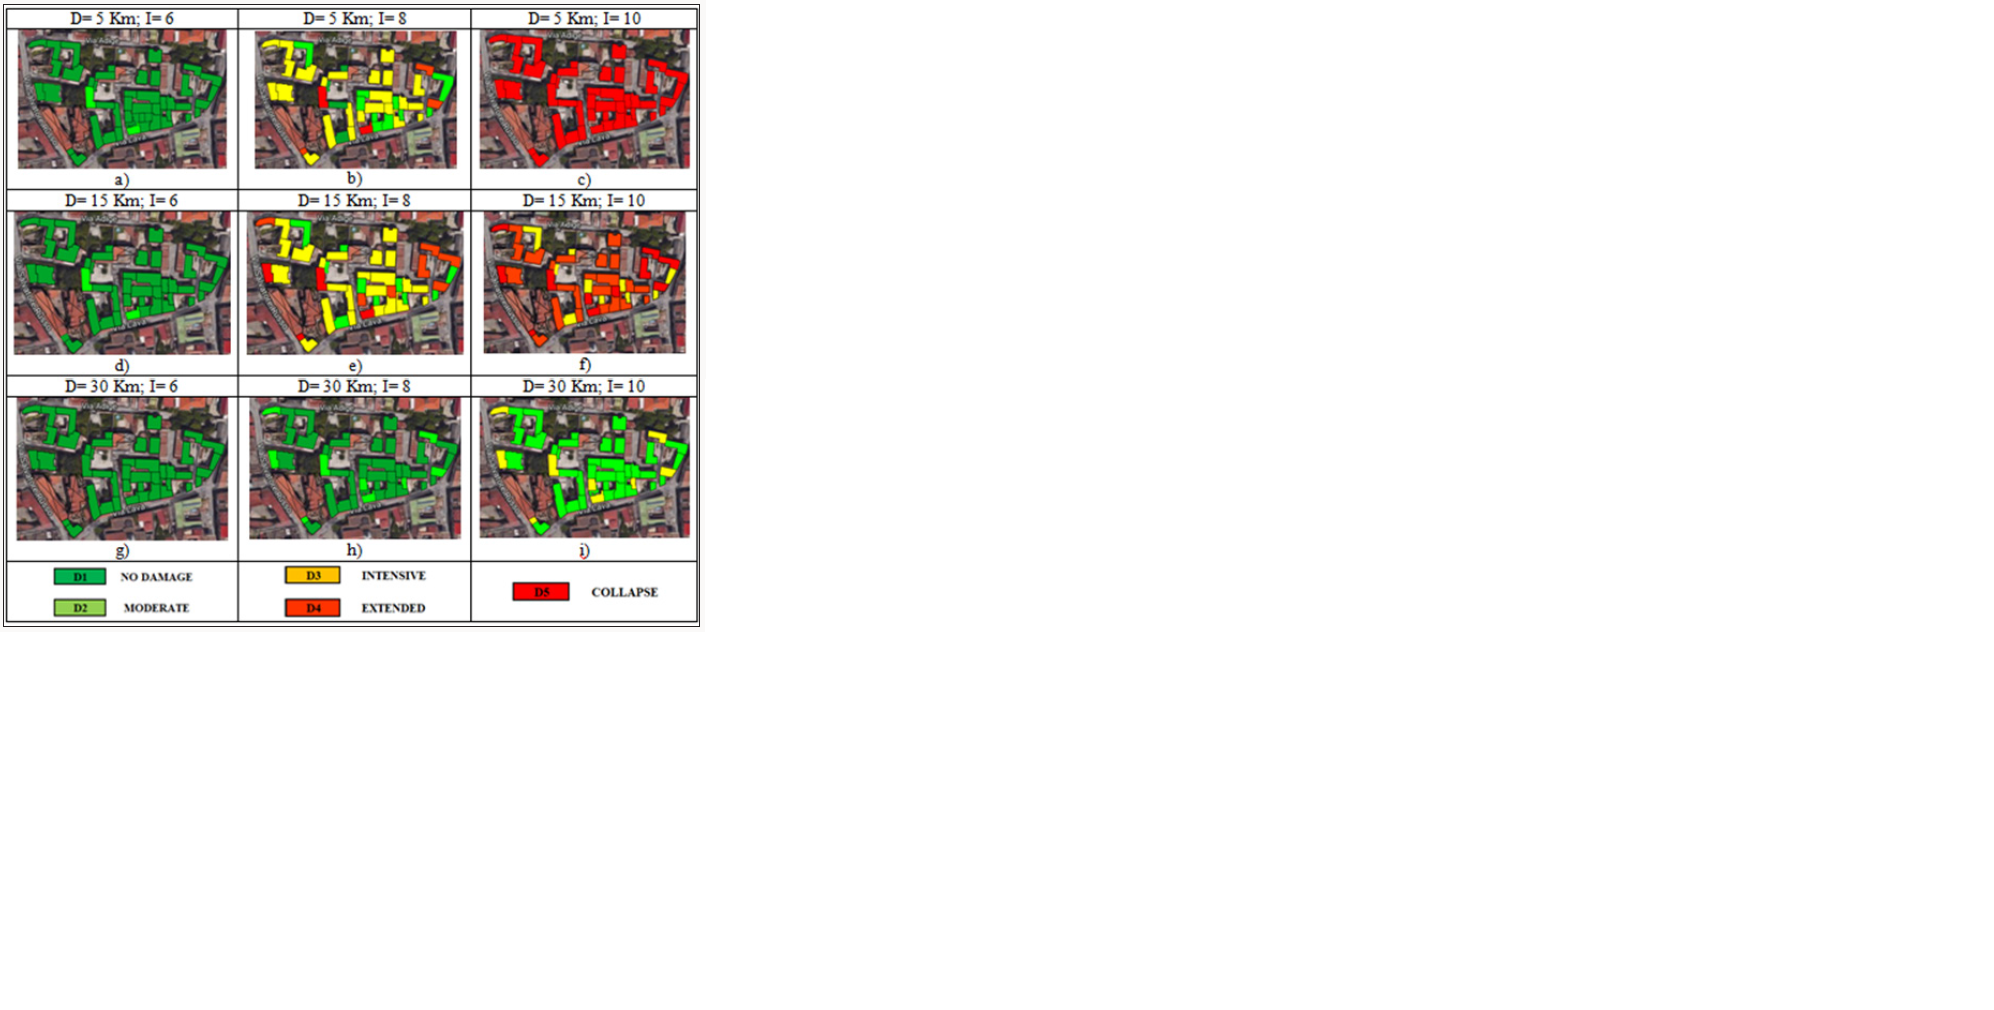
From the previous picture it is apparent that the seismic
event effects depend mainly on the distance of the site from
the seismogenic source. In fact, it is possible to note that, when
increasing the epicentral distance, the expected damage tends to
decrease because the seismic intensity attenuates much more. As an
example, for an epicentral distance of 5km and a seismic intensity
of 10, through the attenuation law proposed by Crespellani, the
collapse of all buildings (damage level D5) should occur. Differently,
by increasing the epicentral distance up to a maximum of 30 km
and by leaving unaltered the magnitude, the seismic effects are
mitigated with expected damage levels D2 (moderate) and D3
(intensive). In addition, for seismic intensities between 8 and 12,
aggregates belonging to the M3.4 typological class show damages
greater than those of M3.3 class aggregates because the former
have largest geometric irregularities which tend to worsen their
seismic behaviour.
Figure 15: Disaggregation of the seismic damage by varying epicentral distances and damage threshold for (a) M
w=4, (b) M
w=5
and (c) M
w=6.
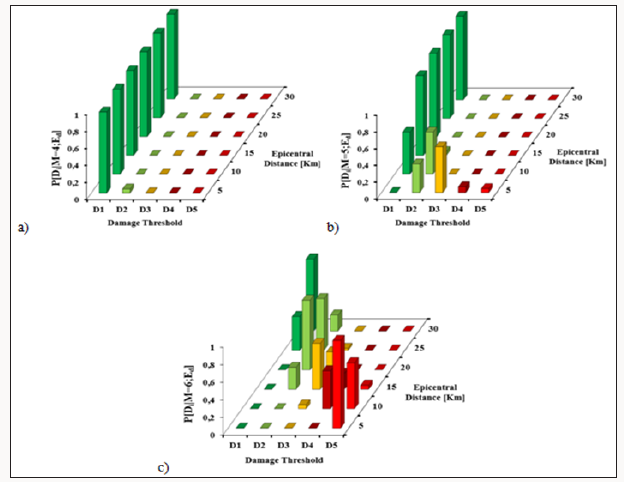
The study developed in [35] showed that the seismic damage
disaggregation can be intended as a multifactorial operator that
allows to evaluate the contributions of different seismic sources
(depi) at the global damage threshold of the site (Figure 15). The
scenarios obtained through the disaggregation process, therefore,
allow obtaining information regarding seismic hazard by setting
magnitude and epicentral distance. In particular, this process allows
correlating the contribution of different scenarios induced by a
magnitude (Mwi) of a given intensity (I) on the expected seismic
damage (Di). In Figure 15 it can be noted that, for a magnitude M=4
and variable epicentral distances, the most probable damage is that
with threshold D1 (no damage). This means that, independently
from the epicentral distance, buildings have a probability of about
100% chances to overpass the D1 damage level. On the other hand,
for M=5 and for M=6, the expected major damages are characterized
by levels D3 (intensive) and D5 (collapse), respectively. Based on
these damage data, the number of collapsed and unusable buildings
is calculated by means of the following equations [35]:
Ncoll. =100%D5 + 40%D4 (3)

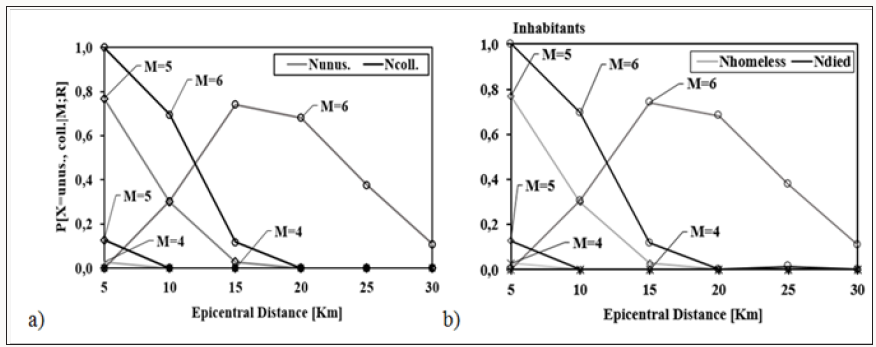
In Figure 16a it is perceived that, when increasing the epicentral
distance (R), the number of buildings involved in the collapse tends
to decrease. In fact, for R=5 Km and M=6, there is the global collapse
of the whole analysed sector (overcoming probability of the D5
level equal to 100%), while for R=5Km and M=5 the probability
of collapse is 13%, and the probability to have unusable buildings
is 77%. The probable number of people died due to the buildings
collapse and homeless inhabitants has been also assessed. The
number of died and homeless depends on the average number of
residents per building for each cadastral sector. In this context it
should be pointed out that the maximum number of residents in the
study area is equal to 153. In Figure 16b it is possible to notice that
the number of people involved in the collapse is increasing with the
earthquake magnitude. For magnitude M=6 and epicentral distance
R=5Km, it can be noted that the probability of having all people
died is equal to 100%, whereas for M=5 the probability to detect
homeless and died people is equal to 77% and 12%, respectively.
Figure 16: Casualty loss analysis: estimation of a) collapsed and unusable buildings and b) died and homeless people.
Regarding the Seismic Hazard Analysis, it has been necessary
to determine the probability curves for exceeding peak ground
accelerations in the range [1÷500 years] by using the Poisson
method shown in the following equation:
Where λ is the rate of exceeding the intensity measure IM=PGA
in the period ΔT.
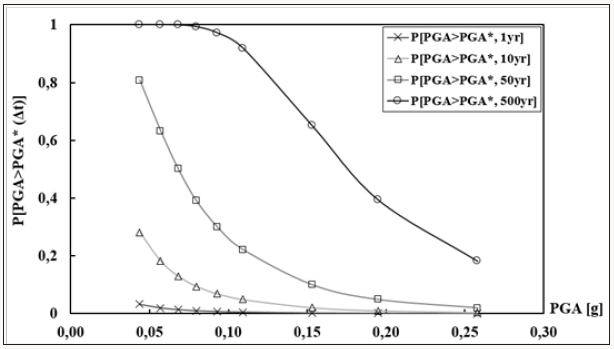
The probability of having PGA values greater than the PGA*
ones, giving rise to the so-called exceedance probability curves
(Figure 17). These curves show how the probability of overcoming
a specific Intensity Measure (IM) in a number of year’s t follows
a nonlinear law. In fact, with reference to an observation time
t=500 years, the probability of exceeding PGA=0.05g is 100%,
while it is equal to 19% for a PGA=0.25g. The Italian Institute of
Geophysics and Volcanology (INGV) [36] provides the probabilities of
exceedance of PGA values for different annual frequencies. The
results obtained are summarized in Table 2.
Table 2: Probability of exceedance of PGA.
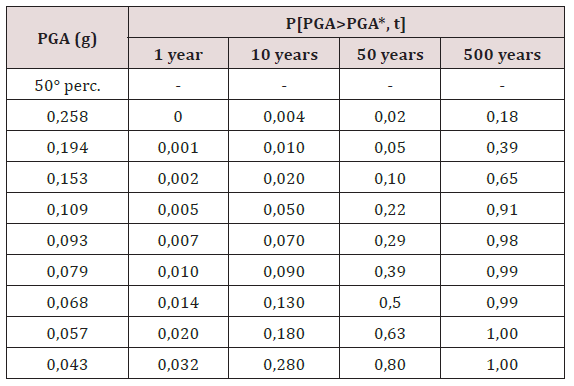
Figure 17: Casualty loss analysis: estimation of a) collapsed and unusable buildings and b) died and homeless people.
The overcoming of seismic events in a predetermined region is
modelled on the basis of the hypothesis of the Poissonian stochastic
process [37]. The Poisson process is defined by the probability
that the number of events occurred in the time interval [0, T=t],
indicated by the random variable Xt, assumes a set of variables x.
The probability of occurrence of X=x seismic events in the period T
is expressed through the following equation:
Where ν is the annual frequency of events and T is the return
period of the seismic event. With reference to the Poisson process, it
has been possible to consider return periods (Tr) associated to the
Limit States defined in the Italian code NTC08 [38] corresponding to
the exceeding probabilities of 81%, 63%, 10% and 5%, respectively
(Table 3).
Table 3: Return periods (Tr) associated to the main Limit States.

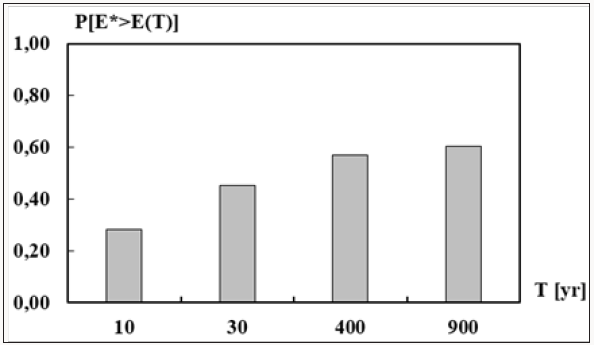
So, established the return period, the probability of having at
least one seismic event in the time t is estimated. In particular, it has
been possible to define time periods t of 10, 30, 400, 900 years, which
have been associated to the probability of exceedance (Figure 18).
The probability of having a seismic event increases with increasing
number of years. In fact, considering Tr=30 years at a time t=10
years, the probability of occurrence (P[E>E*(10years)])=28%;
while for Tr=975 years in t=900 years, the probability of occurrence
is 60%. These considerations allowed estimating the seismic risk
index (IRI) for the study sub-sector. The investigation goal has been
the estimation of the occurrence probability of the seismic risk Ri,
associated to the damage Di at the time t, as a function of both the
magnitude Mi and the epicentral distance d=depi.
In particular, the risk index IRI evaluated for each damage level
Di, by varying the magnitude Mi and the epicentral distance depi,
has been calculated through the following relationship [38,39]:
Figure 18: Exceeding probability of seismic events in the time t.
In this case, it has been taken into account the cumulative
damage associated with the different magnitudes included in the
range [4÷6] within the considered interval of epicentral distances
[5÷30 Km]. Finally, the sub-sector risk Ri can be interpreted as the
average value of the risk indices IRI associated to each observation
time t:
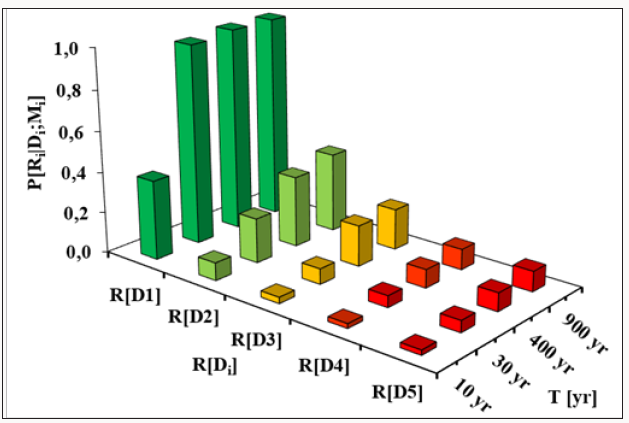
Figure 19 shows that the risk exceeding probability associated
with the damage D1 in 10 years is 40% and it increases with the
observation period up to attain 100% for t=900 years. Similarly,
considering the risk associated to the damage threshold D5, it
can be noted that it tends to increase from 0% for t=10 years to a
maximum value of 10% referred to an observation period t=900
years.
Figure 19: Exceeding probability of seismic events in the time t.
The study illustrated has provided the seismic risk and damage
assessment of an urban sector within the historical centre of
Sant’Antimo by using a probabilistic scenario method. Firstly, with
reference to the typological characterization analysis through the
CARTIS form, the types of buildings within the sub-sector 1 of the
inspected centre, as well as the volumes of the buildings detected
there, have been identified so to individuate the built-up exposure
to seismic events. In this case, being an urban-scale risk analysis, it
has been assumed as a hypothesis to associate a greater exposure
to larger built volumes. Subsequently, the seismic vulnerability
analysis has been carried out by using an appropriate vulnerability
form taking into account the aggregate conditions of individual
structural units. Based on this survey tool, the expected damages
for different seismic intensities have been evaluated through
the derivation of fragility curves. From these curve, it has been
obtained that for modest seismic intensities, buildings shows zero
or very slight damage levels, whereas for high intensities almost all
buildings should collapse.
Later on, a risk analysis has been conducted by taking into
account the distribution of epicentre distances and magnitudes
variable in the range [4÷6]. Applying the Crespellani’s seismic
intensity attenuation law, through the variation of input parameters
(magnitude and site-source distance), it has been possible to
determine the expected maximum seismic intensities in order to
estimate the associated degree of damage that the examined built
up should exhibit under different grade earthquakes. The achieved
results have shown that, for distances very close to the site of
interest, the expected damage increases when seismic intensity
increases. In fact, for R=5 Km and for a value of the expected
seismic intensity ranging from 6 to 10, it can be noticed that the
damage progressively increases in term of collapsed buildings in
the study area. Moreover, the risk index associated with any degree
of expected injury has been calculated. This index has allowed
estimating the probability that a given event E at a time t may be
able to produce a damage D in the sub-urban sector analysed.
From the analysis of results it has been possible to perceive
that, with observation times ranging from 10 to 900 years, when the
intensity of ground motion increases, the probability of exceeding
the null damage threshold (D1) increases much more than the
probability to attain the collapse limit (D5) of all the buildings
placed in the area. In fact, it can be noted that, as an example, for
t=10 years, the probability of having a risk associated with the
damage D1 is 40%, while it is null for the risk associated to the
damage D5. Conversely, for an observation period of 900 years, the
probability of risk associated to the damage D1 is 100%, while this
probability is equal to 10% for the damage level D5. This makes
clear the conclusion that, in case of slow motions, buildings either
do not suffer any damage or exhibit moderate damage, whereas in
case of strong motions the risk associated to the structural collapse
increases.