Wednesday, 14 June 2023

Lupine Publishers | Sustainability, gives Impetus to Innovation and Research

 Lupine Publishers | Latest Trends in Textile and Fashion Designing


Abstract

An increasing population of the Globe in general and that of India and China in particular brings before us a number of challenges of providing the people enough food, shelter, clothing, sanitation & health facilities, infrastructure, etc. To meet these challenges, unbridled manufacturing activities disregarding environment and society has been taking place almost all over the world which has resulted in alarming level of increase in Green House gases and depletion of valuable nonrenewable resources and water bodies. Under this backdrop business practices based on sustainability are becoming inevitable and textile sector is no exception to it. India’s aspiring young population, like consumers from developed countries, further demands quality apparels with multifunctional performance properties and thus Technical Textiles consumption is growing rapidly. The present paper explains how innovation and sustainability driven research can meet the challenges of coming decades. In this paper a few examples of the research work and their findings are summarized and their potential in meeting such challenges is presented.

Introduction

Indian Textile Industry being Mother industry, its growth is weaved with the future of over 55 million people connected directly or indirectly to this sector. Many a times Business as usual manufacturing activities are carried out with unbridled freedom, and total disregard to optimization and use of raw materials/ processes and energy sources. This is leading to air & water pollution; Green House Gases Emission and rapid depletion of fossil fuels and water resources. It has been reported that Globally we have ploughed in extra 30% of earth’s resources depriving our future generations. Hence, it is natural that Sustainability issues take center stage. It is inevitable that we adapt to Sustainable value model.

Environment has to be protected and people have to be respected and looking after the profitability of any business enterprise. Planet, People and Profit are these three pillars on which business success is to be measured. While following sustainability agenda, the steps to be taken include more and more use of renewable raw materials and energy; process intensification to conserve energy, water, and use of utilities, etc. increase the use of products which are biodegradable, etc. Thus, SUSTAINABILITY is never to be considered as financial burden; in fact, it is a key driver for Innovation based research as well as Technological Developments which can give an enterprise competitive advantage.

When we look at the respect to environment and people over the profitability, it is not a philosophical or wishful thinking. Top management needs to have commitment to sustainability; intern it, it is a matter of commitment to ethically doing the business. Indeed, when ethics becomes core component of business, only then no one would compromise environment and the society for the paltry sum of profits. Sustainability requires multipronged approach. It necessitates exploration of newer ways of processing, newer raw materials, technologies which require minimum energy/water inputs and has lowest level of emissions and effluents. Hence, naturally the regular processes and technologies need to be relooked in to the sustainability lens and explored giving impetus to research and developments. Fortunately, awareness about use of products made by eco-friendly processing technologies is increasing and such products based on green technology are being preferred even paying slight premium. Positive development in India is the introduction of new company law, making it compulsory for the companies to spend 2% profit of theirs for Corporate Social Responsibility projects, which again creates mental frame among the corporates about social commitment and corporate philanthropy.

India is a Young Nation as 65 % of its population is below the age of 35 years. This aspiring young Population with increasing standard of living and surplus disposable income, are quite aware about Consumer rights and environment, and are Brand conscious and quality conscious. They need improved quality of life and Standard Medical care. And to meet these demands of enlightened and economically affording section of customer base, we have to switch from traditional Textile manufacturing to the diversification towards manufacture of Technical Textiles. Coming decade is thus going to be decisive in terms of adapting to various products based

on Technical Textiles of different segments.

Many of the reported technologies such as Digital Printing; Transfer Printing; Ultrasonic /Laser Energy, Supercritical Carbon dioxide dyeing of Polyester; Plasma application etc. can be further extrapolated and up-scaled to see their application potential on large scale level. Also, a number of efforts in Process intensification giving rise to optimum use of utilities, with improved performance of the product and quality , various Fibre Modification processes and Nano -Technological applications need to be thoroughly investigated to extract the un-tapped value in these technologies which can propel us toward the fulfillment of our sustainability agenda.

Personally, I have been privileged to guide the research in the field of fibre science, technical textiles and textile processing for close 40 years with over 200 students for Master and Ph D degrees. Due to the paucity of the space and time, it will be prudent to describe here the outlines of a few pieces of our research work which are deeply rooted in sustainability, process intensification and technical textile applications. The examples taken here are not exhaustive and they are just representative samples.

Ecofriendly and Economical Finishing agents for Cotton and Cellulosic fibres

Cotton and cellulosic fibres enjoy important position in clothing. In fact, today Cotton garments have become revenue earners and are the materials for those who can afford to have them. However, fibre lacks wrinkle resistance and it is important that these required properties are imparted to cotton. Traditional way is to modify this fibre by resin finishing, which makes use of formaldehyde-based resin. This itself gives rise to the issue of release of formaldehyde during wearing. Hence low formaldehyde and formaldehyde free finishing agents are in demand. Polycaroxylic acid such as 1,1,2,2, butanae tetra carboxylic acid(BTCA) is presented as an alternative to this; however, it is cost prohibitive and hence used only in a limited extent. We have worked on similar lines making use of polycarboxylic acids such as polymaleic acid, citric acid and their combination and we have found interesting results with respect to crease recovery properties. The use of Polyethylene emulsion further helps in reducing the stiffness caused and thus fabric does not suffer on that account too. In addition, when this formulation is mixed with Chitosan, (We had prepared the naturally occurring biopolymer Chitosan from shrimp shells obtained from the fish market), it gets further enhanced with regard to imparting antibacterial properties. Padding through the solution was done with Wet pick up of 95% and then drying on pin frames at 80°C for 2 min. This was followed by curing at 160°C for 2 min .The results indicate very good degree of CRA and wrinkle resistance properties as well as acceptable softness level, and antibacterial properties [1].

Dyeing of finished Garments as per the Market needs

The limited aim was to address the need of the Garment dyers to quickly deliver the goods as per the purchase order, which is fluid. Since the demand for typical fashion colors keep changing fast, it is important to avoid the unnecessary large inventory of the garments in specific color combinations. The wise things to do is to have the garments finished in un-dyed form which can be dyed in a short time as per the orders placed and made available promptly. Technologically this is a bit difficult thing to do as after finishing the color uptake of the garments is reduced to as low as 10% of the unfinished garments.

We undertook this work with an aim to convert the finished un-dyed garment into dyeable form as and when needed as per color requirements. To that effect we used N- containing Additives in finishing formulation for garment dyeing. Nitrogen containing additives such as Triethanol amine can act in acidic conditions of dyeing enabling protonation of the fabric due to cationisation effect and the exhaustion of the reactive dye takes place very easily which can then be fixed well. The results were quite promising, and additives used in finishing were found to give the dyeability as good as or near about equivalent to that when finish was absent [2].

Simultaneous ACID Dyeing and Finishing of Cotton

It is well known that Acid dyes are cheaper than that of direct dyes; however, they do not have any substantivity for cotton and hence one is compelled to restrict the use of acid dyes only to proteinic fibres. In this piece of work, we attempted to establish linkage between acid dyes and cotton using a bridging chemical such as multifunctional resin or polycarboxylic acids. The resin as well as polycarboxylic acid while reacting with hydroxyl groups in cellulosic chains on one end, can be made to react with amino groups of acid dyes at the other end ,in one single operation of pad, dry and cure technique. A lot of trials to optimize conditions were taken and it was concluded that acid dyes which contain free primary or secondary amino groups can participate in this reaction with cross-linking agents, which intern can also react with the cellulosic fibre and impart wrinkle resistance properties as well as dyeability. The padding bath contained cross-linking agent, catalyst, acid dye and after padding the fabric with 100%expression, it was dried and cured at 150oC for 3 mins. Detail studies showed that the dye forms a covalent bond with the cross-linking agent which inturn is covalently bonded with the fabric. Hence the fastness properties exhibited by these dyeing were exceptionally good. The Advantages of this process include capacity to make dyeing operation continuous; acid dye application on Cotton and cellulosic fibres; high performance properties; simultaneous resin finishing happening and thus saving on energy, chemicals and water. Shortening of the process will give rise to extra production and thus this process is Eco-friendlier and more sustainable one [3,4].

Development of Hygienic, Fragrant and Mosquito repellent Cotton

Fragrance and essential oil have specific effects on individual’s feelings and emotions such as relaxation, exhilaration, sensuality, happiness and wellbeing through odour via stimulation of brain. Essential oils also have antibacterial, insect repellent, and mosquito repellent properties. However, many of these oils are volatile and hence lose their property very rapidly. However, the storage life of a volatile compound can be increased markedly by micro-encapsulation technique. Microencapsulation of fragrance compounds maintain fresh aroma on textiles, so that material retains its freshness for longer duration. Capsules rupture by friction during wearing giving necessary fragrance and under normal conditions remain intact. Fragrance oil has been encapsulated in gum Arabic and gelatin. The microcapsules containing these oils (Cederwood , Lavender, Lemon grass oils) with aroma are applied on cotton fabric from resin as well as binder bath.

The evaluation of the final finished fabric involved estimation of intensity of aroma, washing durability of the aroma, Antibacterial activity of these oils in microcapsules and efficiency of Mosquito repellency of microcapsule treated fabric. All these anticipated properties were found to be imparted on to the cotton fabric using this one shot natural herbal recipe. In other words, finished fabric in addition to being wrinkle resistant, also showed, pleasant aroma, antibacterial property, as well as mosquito repellency. The feasible end uses of such products include ribbons, handkerchiefs, curtains and furnishing fabrics [5].

Conclusion

These are just a few examples of actual research having carried out by my group of students, it shows that there lies a great potential to exploit commercially the findings of these pieces of research work and convert them into acceptable novel technologies/products which can satisfy the parameters of sustainability and requirement of technical textiles demanded by the modern consumers. Indeed, they can provide the products of high-quality performance, the products which can be delivered in shorter dwell time, the products having optimized use of utilities and thus low Carbon foot prints. The novel products and technologies developed can offer a very good potential of industrial exploitation.

Read more about Lupine Publishers Journal of Textile and Fashion Designing Click on the below link

https://fashion-technology-lupine-publishers.blogspot.com/


Tuesday, 13 June 2023

Lupine Publishers | Unique Anatomy of the Spleen of One Humped Camel (Camelus Dromedarius): A Review

 Lupine Publishers | Open Access Journal of Biomedical Engineering and Biosciences


Abstract

Over the past years, defensive immunity has been recognized as having an important role as a front-line mechanism and as an integral part of the adaptive immune response. Immunity in One Humped Camel (Camelus dromedarius) exposed too many diseases are spleen-dependent. In this review, we discuss the general aspects of the gross anatomy of the spleen (both internal and external), based on location, position, relation, blood supply and innervations of the organ. The micro-architecture of the camel anatomy was discussed using eosin and hematoxylene stain and the cells visible in the aspect of normal tissue histology. The aim of the write-up is to examine the anatomy of the different sections in the spleen of the one-humped camel (Camelus dromedaries).

Keywords: Defensive Immunity; Camelus Dromedarius; Spleen; Gross Anatomy; Histology

Introduction

Camelids originated in North America, where they are now extinct, and did not reach the Old World until about two million years ago [1]. Camels belong to the suborder Tylopoda of the Artiodactyls (even-toed ungulates, along with pigs). Within their current native range of North Africa and central and western Asia the one-humped camel or dromedary (Camelus dromedarius) is a highly revered species, used for food, fibre, and racing [2]. The species reportedly has no known natural predators throughout this range. Australia is the only country in which camels have established a feral population, and is now the only location where the species lives in natural populations [3]. Spleen, located between the stomach, left kidney and diaphragm, the spleen is the largest lymphoid organ in the body, performing functions for the blood similar to those performed by the lymphnodes for the lymph [4]. It is a soft organ, conforming to the contours of the organs and structures surrounding it. At the hilus on the visceral surface, the splenic artery brings blood into the spleen, the splenic vein takes blood from the spleen to the hepatic portal system, and lymphatic drain lymph from the spleen.[5]. In some domestic species such as the horse and dog, the spleen functions as a reservoir from which blood can be mobilized when needed and in these species, smooth muscle is a prominent feature of the capsule and traberculae of the spleen [6].

Structure

The spleen represents the largest reticulo-endothelial accumulation in the body [6]. It has a thin fibrous capsule, to which the peritoneum adheres intimately. The fibrous tissue of the capsule extends into the spleen to form a series of traberculae between which lies the splenic pulp [5]. The spleen has an extensive blood supply consisting of traberculae arteries, central arteries, penicillar arteries, sinusoids, red pulp veins, and traberculae veins [7]. It is surrounded by a capsule, has traberculae, and is divided into red and white pulp. The spleen is very vascular and has red and white pulp [3].

Embryologically

The spleen develops in the dorsal mesentery of the stomach (dorsal mesogastrium). The spleen arises from cells of the mesentery, which migrate into the plane between the layers of the mesentery [8]. The mesentery covering the spleen becomes the visceral peritoneum of the spleen. The mesentery between the spleen and the gut tube becomes the gastrosplenic ligament. The mesentery between the spleen and the dorsal body wall becomes the splenorenal ligament (most of which subsequently fuses to become parietal peritoneum) [9].

Grossly

The spleen is about the size of the cupped hand. If forms the left lateral extremity of the lesser sac [10]. The spleen is a peritoneal organ in the upper left quadrant that is related to the left 9th, 10th, and II the ribs. Clinically, fracture of these ribs may injured or lacerate the spleen. The Spleen is located in the upper left abdominal quadrant. Unlike the lymph node, the spleen is inserted in the blood stream. The spleen clears the blood of aged blood cells and foreign material. It is the site of an immune response to bloodborne antigens, especially in children. In adults, the spleen is not essential to life.

In general, white pulp is the site of antibody synthesis and lymphocyte production. Red pulp is chiefly concerned with the removal and destruction of worn out erythrocytes. In as much as the spleen lies above the costal margin, a normal-sized spleen is not palpable. Enlarged spleen may be palpated below the left costal margin. The splenic artery and vein reach the hilus of the spleen by traversing the splenorenal ligament. Passing from it are the gastrosplenic ligament to the greater curvature of stomach (carrying the short gastric and left gastroepiploic vessels) and the lienorenal ligament to the posterior abdominal wall (carrying the splenic vessels and tail of the pancreas) [5]. The spleen is a peritoneal organ in the upper left quadrant that is related to the left 9th, 10th, and II the ribs. Fracture of these ribs may lacerate the spleen [5]. In as much as the spleen lies above the costal margin, a normal-sized spleen is not palpable. The enlarged spleen may be palpated below the left costal margin. The splenic artery and vein reach the hilus of the spleen by traversing the spleno-renal ligament.

Relations:

a) Ventrally: The left diaphragm, separating it from the pleura, left lung and the 9th, 10th and 11th ribs.

b) Cranially: The stomach.

c) Dorsally: The splenic flexure of the colon.

d) Medially: The left kidney.

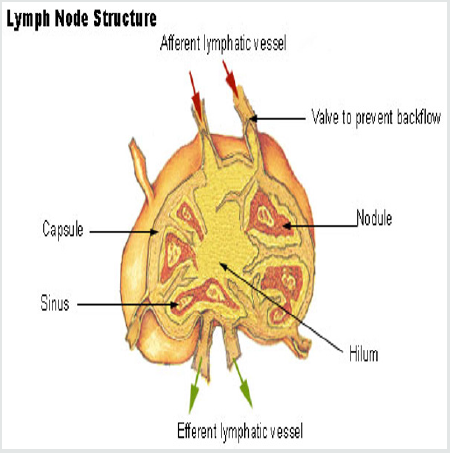
The tail of the pancreas abuts against the hilum of the spleen through which vessels and nerves enter and leave this organ Figure 1.

Figure 1: Lymph Node Structure.

lupinepublishers-openaccess-journal-environmental-soil-sciences


Histologically

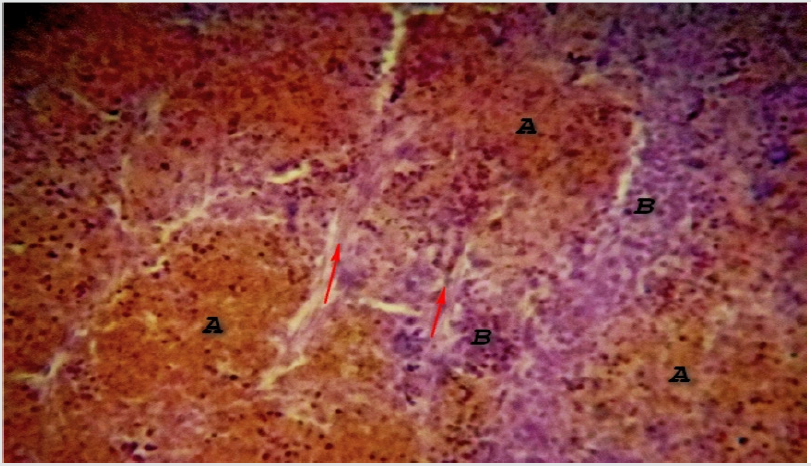
The structure resembles the lymph node except in some anatomical aspect, which includes; only efferent lymphatic drain the spleen. The sinusoids are blood vascular not lymphatic. As a result, all cells entering the spleen do so via the blood. Scattered primary nodules (germinal centers) are found throughout the spleen. These contain abundant lymphocytes and make up the “white pulp” (also known as Malpighian corpuscles). Plasma cells and macrophages are found here as well. Surrounding the white pulp nodules are venous sinuses containing abundant erythrocytes - the “red pulp”. These sinuses are lined with macrophages (RE cells) which are highly phagocytic. Between the sinuses are cords of cells - lymphocytes, monocytes and macrophages - referred to as the Cords of Billroth. The immune function of the spleen is especially important in infancy and early childhood. At these times, the rest of the lymphoid system is somewhat underdeveloped Figure 2.

Figure 2: Photomicrograph of Camel Spleen showing clearly differentiated zones of white pulp (A) and Red pulp (B) cells with inter parenchymal traberculae collagen connective tissue fibers (Red arrow) H&E x200.

lupinepublishers-openaccess-journal-environmental-soil-sciences

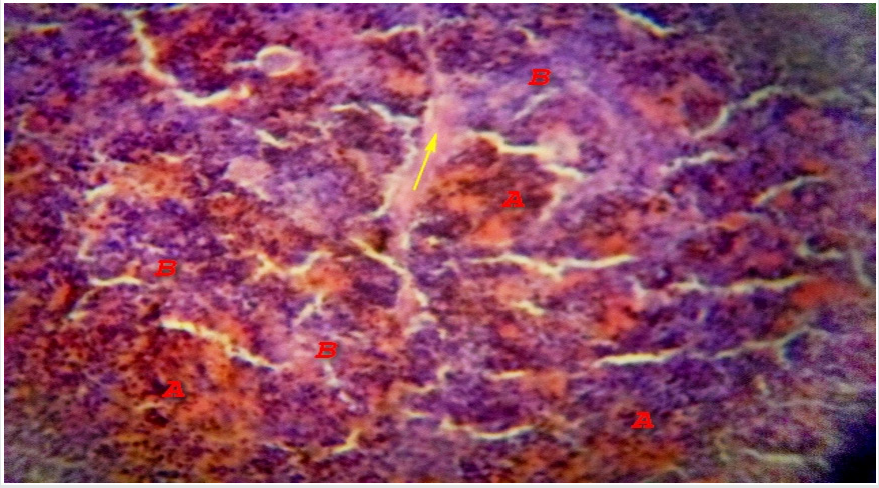
Microscopically, the spleen appears to consist of discrete 0.5-1 mm white nodules, called the white pulp, embedded in a red matrix called the red pulp. Microscopically, as shown here, the white pulp WP consists of lymphoid aggregations and the red pulp RP, making up the bulk of the organ, is a highly vascular tissue [10]. The spleen has a thin fibroelastic outer capsule C from which short traberculae T extend into the parenchyma Figure 3. The capsule is thickened at the hilum and is continuous with supporting tissues that sheath the larger blood vessels entering and leaving the organ. In dogs and horses the spleen is also a reservoir of blood and these supporting tissues contain smooth muscle to pump blood out, but in humans only a few smooth muscle cells persist Figure 4. The splenic artery divides into several major branches, which enter the hilum and branch to form numerous arterioles. [11].

Figure 3: Photomicrograph of Camel Spleen showing clearly differentiated zones of white pulp (A) and Red pulp (B) cells with communication of paranchymal traberculae connective tissue fibers connective tissue (Red arrow) and thick connective tissue fibers capsule (Yellow arrow) H&E x200.

lupinepublishers-openaccess-journal-environmental-soil-sciences

Figure 4: Photomicrograph of Camel Spleen showing clearly zones of white pulp (A) and Red pulp (B) cells with developed inter-paranchymal traberculae collagen connective tissue fibers (Yellow arrow) H&E x200

lupinepublishers-openaccess-journal-environmental-soil-sciences

An overview of the splenic ultra-structure and circulation is shown in Figure 1 above; blood enters the spleen in the splenic artery which branches repeatedly within the parenchyma [5]. The larger arteries are surrounded by a fibrocollagenous sheath that disappears in the smaller branches. These central arteries A, are so named because they have a cylindrical cuff of lymphoid tissue around them, the periarteriolar lymphoid sheath PALS, consisting mainly of TH cells. The central artery gives off a number of short branches at right angles, which are called penicilliary arteries PALS and these terminate in two to three sheathed capillaries with only one is shown for each penicilliary artery [7]. These unique vessels are small blind-ending capillaries with no endothelial lining but surrounded instead by an aggregate of macrophages. Thus the blood arriving in a sheathed capillary must traverse this wall of macrophages before entering the red pulp RP. The sheathed capillaries therefore form the first part of the filtering mechanism of the spleen [6]. The splenic white pulp is of two types, T cell and B cell, together making up 5-20% of the total mass of the spleen. The functions of these areas appear to be similar to those of the paracortex and superficial cortex of lymph nodes respectively. The non-filtering areas of red pulp parenchyma as probably be considered part of the splenic lymphoid tissue mass also, but its immunological function remains to be elucidated [12].

White Pulp

White pulp consists of lymphoid tissue that unsheathes the central arteries (periarterial sheath) along with the associated nodules and germinal centers. The periarterial sheath is populated mainly by T lymphocytes [9]. The peripheral white pulp and germinal centers are populated mainly by B lymphocytes. In the white pulp, the T cell areas surround the central arteries, forming the periarteriolar lymphoid sheath. In humans, this lymphoid tissue is less well organized than in other animals, but the term PALS persists [12].

Red Pulp

Red pulp consists of splenic cords of Billroth and venous sinusoids [8]. Defective red blood cells resulting from aging or disease (as in sickle cell anemia, hereditary spherocytosis, or thalassemia syndromes) are delayed in their passage from Billroth cords into the venous sinusoids and phagocytosed by macrophages lining the cords. The splenic parenchyma is permeated by an interconnected network of sinuses S that drain in turn into larger sinuses, tributaries of the splenic vein and finally the hepatic portal vein [3]. The sinuses are lined by endothelial cells resting upon a basement membrane with numerous narrow slits. The reticulin fibers of the sinusoidal basement membrane are arranged in a circular fashion and are continuous with the reticulin meshwork of the parenchyma [1].

Blood Supply

The splenic artery is one of the three main branches of the coeliac axis. The splenic vein is joined by the superior mesenteric to form the portal vein [6]. Blood cells entering the parenchyma from the sheathed capillaries squeeze through the walls of the sinuses to drain out of the organ via the splenic vein, an arrangement known as the open circulation [4]. Note that the splenic vessels also provide the principal blood supply of the pancreas. [6].

Read more about Lupine Publishers Journal of Biomedical Engineering and Biosciences Click on the below link : https://biomedical-sciences-lupine-publishers.blogspot.com/


Monday, 12 June 2023

Lupine Publishers | Clinical Waste Management Scenario of Private Health Care Establishment in Rajshahi City

 Lupine Publishers | Trends in Civil Engineering and its Architecture


Abstract

The increasing number of clinics and hospitals in Bangladesh has been resulting in the increased amount of waste generation. Clinical waste contains toxic chemicals and hazardous materials from several diagnosis and treatment processes. The improper disposal of clinical waste in the country poses a high health risk to humans as well as the environment.

The study of clinical waste management systems was performed to understand the various handling and disposal procedures in different clinics and diagnostics center in Rajshahi city, the knowledge and awareness of individuals involved in medical waste generation, handling and disposal, and the potential impacts of the waste stream on both human health and the natural environment. The purpose of the study is to provide direction for further study. Data were collected by field investigation and interview in the selected clinics and diagnostics center. It was found that a variety of methods were used by the medical facilities to dispose their wastes including burning, burial, entombing, selling, dumping, and removal by municipal bins. The waste disposal practice was found to be quite unsafe, and both clinical and non-clinical wastes were found to be thrown together. There was insufficient awareness of the magnitude of the medical wastes issue by concerned individuals at different levels from director or divisional head to tokai (waste pickers). This study aims at bringing safety, health and environment together as a basis for prioritizing national programmed, through collection of data on types, quantities, sources handling procedures and basic understanding by those in charge. In addition, it is also aimed at proposing ways of reducing levels of contact with hazardous health-care waste.

The improvement of waste management in clinics and hospitals is essential to minimize the spread of infectious diseases. The study was conducted at different 19 clinics and diagnostic centers at Rajshahi city in Bangladesh to quantify amount of clinical waste generated from the medical services; determine physical composition of; find out the correlation of waste quantity with relevant factors; identify problems and develop future guideline regarding waste management.

Keywords: Hazardous materials; Medical wastes; Health risk; Infectious diseases

Introduction

A hospital is a service-oriented residential establishment that provides medical care facilities comprising of observational, diagnostic, therapeutic and rehabilitative services for persons suffering from or suspected to be suffering from many kind of diseases or injury. The basic concept of waste management in a hospital do not differ basically from that in hotels, schools and catering establishments since certain areas of the hospital render the same type of basic services. But some wastes generated in a hospital are too hazardous to be treated negligently, and any carelessness in the management of these wastes in a hospital tends to spread infection and contaminate in the entire living environment prevailing in a hospital. The delay in the recovery and overburden of weak patients, endanger the patients survival and may also generate health hazards to those persons who work in the hospital environment.

Over the years, the world has witnessed the rapid population growth in different patterns and extra-ordinary waste generation. In many developed and developing countries, collection, transportation, treatment and disposal of waste are the major challenges for government, organizations and other institutions. Different types of solid wastes depending on the generation resource can be classified into household waste or municipal waste, industrial waste as hazardous waste and biomedical waste.

Biomedical waste or clinical waste is classified as one of the most dangerous wastes in the world. Clinical waste refers to any waste that is generated during medical activities such as diagnosis, monitoring, and treatment of human beings or animals. It includes viruses and bacteria that potentially cause diseases which are produced by hospitals, clinics, doctor’s offices and other types of healthcare institutions.

In recent years, concern over clinical waste has increased throughout the world. Improper management of clinical waste poses a public health risk. Therefore, appropriate Clinical Waste Management is a crucial issue for maintaining human and public health. The Clinical waste management practices cover all processes from the point of identification the wastes, to the place it is disposed in an incinerator. Initial handling, collecting, transporting, disposing and monitoring of waste materials are collectively called waste management. The primary objectives of waste management are reducing the amount and hazards of waste. Reusing the waste through the provision of secondary raw materials and use of the waste as energy resource are other objectives of waste management.

Clinical waste has been considered as one of the major health and environmental concern in Bangladesh over the last three decades. Poor management, lack of handling knowledge and unscientific disposal of various health care wastes pose serious direct and indirect public health threats to health-care personnel, nurses, technicians, waste workers, hospital visitors, patients, surrounding communities and hence, the environment [1,2]. Clinical waste, due to its content of hazardous substances such as heavy metals, chemical solvents and preservatives, poses serious threats to environmental health such as, air pollution through release of toxic pollutants (e.g. dioxin), water pollution through surface run off and infiltration of leachate into water bodies and underground aquifer.

Clinical waste contains highly toxic metals, toxic chemicals, pathogenic viruses and bacteria, which can lead to pathological dysfunction of the human body. Clinical waste presents a high risk to doctors, nurses, technicians, sweepers, hospital visitors and patients due to arbitrary management.

It is observed that the solid clinical wastes are being disposed-off in the City Corporation’s collection bins in and around the hospital premises. The waste is then collected by City Corporation’s vehicles and then transported to the open municipal dumping sites. Simply disposing it into dustbins, drains, and canals or finally dumping it to the outskirts of the city poses a serious public health hazard. It is a common observation in Rajshahi City that poor scavengers, women and children collect some of the diagnostic wastes (e.g. syringeneedles, saline bags, blood bags etc.) for reselling despite the deadly health risks. It has long been known that the re-use of syringes can cause the spread of infection such as AIDS and hepatitis [2]. The collection of disposable medical items (particularly syringes), its resale and potential re-use without sterilization could cause a serious disease burden. The safe disposal and subsequent destruction of diagnostic waste is a key step in the reduction of illness or injury through contact with this potentially hazardous material, and in the prevention of environmental contamination [3]. The transmission of blood-borne viruses and respiratory, enteric and soft tissue infections through improper clinical waste disposal is not well described. The management of clinical waste therefore, has been of major concern due to potentially high risks to human health and the environment [4].

Objectives

The objectives of the study are as follows:
(a) To study the existing situation of clinical waste management in Rajshahi city.
(b) To quantify the amount of solid wastes generated by each health care establishment.
(c) To identify the problems and inadequacies associated with the current situation of the clinical waste management in the Rajshahi city.

Clinical Waste Types and Sources

Generally, clinical waste is defined as the discarded or unwanted material or garbage or solid waste which is generated from the diagnosis, treatment, or immunization of human beings or animals, in research pertaining thereto, or in the production or testing of biological. These have the potential to cause disease and are a health risk. It is by-product of health care that includes sharps, non-sharps, blood, body parts, chemicals, pharmaceuticals, medical devices and radioactive materials. The Health Care Establishments are one of the major producers of solid wastes which are hazardous in nature. Poor management of clinical wastes exposes heath workers, waste handlers and the community to infections, toxic effects and injuries.

Sources and Types of Clinical Wastes

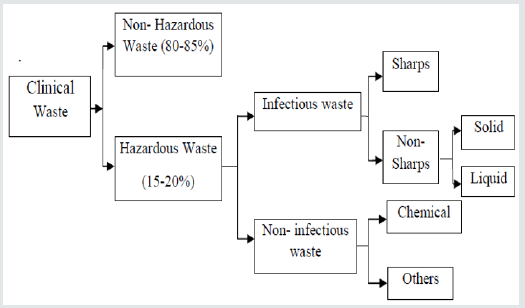
Medical wastes are mainly categorized into non-hazardous and hazardous wastes. The non-hazardous waste includes wool, kitchen wastes, etc. that do not pose any special handling problem, hazard to health or the environment and is generated in the patients’ ward areas, out-patient-department (OPD), kitchens, offices, etc. [5]. The hazardous waste includes pathological, infectious, sharps and chemical wastes and are normally produced in labor wards, operation theatres, laboratories, etc. [5]. Some definitions of clinical wastes are [5] (Figure 1) (Table 1).

Figure 1: Flow Chart for different types of clinical waste (WHO, 2001).

Lupinepublishers-openaccess-journals-Civil-engineering-Architechture

Table 1: Sources and Types of clinical Wastes (ACHWD, Health Department Victoria, 1988.

Lupinepublishers-openaccess-journals-Civil-engineering-Architechture

Clinical Waste in Environment

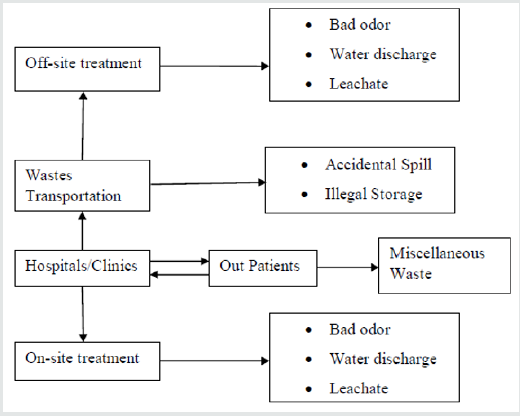
Cheremisinoff & Shah identified the relation between the waste system and its wastes in the environment as shown in below. This can be relied that clinical wastes are released to the environment by many hospital activities in terms of as air emission, waste water and solid wastes (Figure 2).

Figure 2: Clinical Wastes in Environment (Cheremisinoff and Shah, 1990).

Lupinepublishers-openaccess-journals-Civil-engineering-Architechture

Public Health Risk

Meany and Cheremisinoff has defined that infectious diseases occurred as a result of interaction between an infectious agent (pathogen) and a susceptible host. Clinical wastes are a source of pathogen. Interaction between the host and the pathogen may take one of two forms-infections. Infection is the host by the pathogen and is a more common form of diseases introduction [6-10].

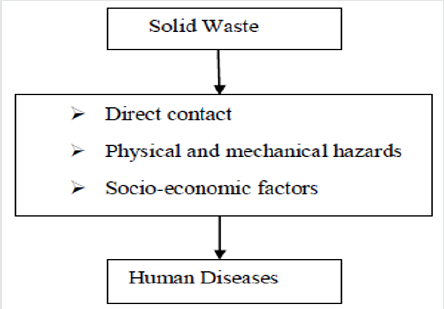
There are several modes of diseases transmission from solid wastes but lack of information makes statistical confirmation impossible. In recent years, the USEPA has initiated research in epidemiology and this should promote a greater understanding of the solid waste as shown in Figure 3.

Figure 3: Pathways of Diseases Transmission (Meaney and Cheremisinoff, 1990).

Lupinepublishers-openaccess-journals-Civil-engineering-Architechture

Treatment Method for Clinical Wastes

There are many treatment methods for the clinical wastes such as Incineration, Autoclaving (stream or heating), Chemical treatment, Microwave radiation and other thermal system and etc. Therefore, clinical wastes should be treated with the suitable treatment method [11-17] (Table 2).

Table 2: Treatment Method for Clinical Wastes.

Lupinepublishers-openaccess-journals-Civil-engineering-Architechture

Methodology

The methodology of the study included field observation and field level data collection through inventory, questionnaire survey and interviews with formal and informal ways, a review of related literature etc., to observe the physical composition of clinical waste; and to collect information regarding quantity and quality of diagnostic waste. Data were also collected through both direct observations and interviews with different officials of the studied health care establishments. Waste materials from a hospital as a whole were analyzed (sorting, segregating, and weighting) (Figure 4).

Figure 4: Flow chart for methodological procedure of the project.

Lupinepublishers-openaccess-journals-Civil-engineering-Architechture

Sources and Quantification of Clinical Waste

Medical wastes are produced by various activities. Different units within a hospitals and clinics such as Medical ward, Operation theatres and surgical ward, Health-care units, Laboratories and Pharmaceutical and Chemical stores would generate different wastes. The amount of waste generated in hospitals depends upon various factors such as the number of beds, types of health services provided, economic, social and cultural status of the patients and the general condition of the area. It was observed that the surveyed Health Care Establishments generated sharp instruments (e.g. needles, syringes, and broken glassware instruments), pathological wastes (e.g. blood, urine bags, cotton-bandages, hands glove), pharmaceutical wastes (e.g. drug shell, saline, glass bottle) and general wastes (e.g. plastics, polythene, papers, food wastes etc) which are considered for segregation of waste. The all Health Care Establishment`s solid wastes are measured in kg/day (Figure 5).

Figure 5: (a) Average Percentage of Clinical Waste in all Health Care Establishments.
(b) Average percentages of Hazardous and Non-hazardous waste.

Lupinepublishers-openaccess-journals-Civil-engineering-Architechture

Results

Percentage of clinical waste at Islami Bank Hospital

Islami Bank Hospital is the largest private hospital and very popular having all the facilities (e.g. pathology, radiology and imaging, microbiology, surgery, pharmacology, gynecology and so on). The hospital has 50 beds capacity for resident patients and provides outdoor facilities for about 500 patients daily.

Total amount of waste generated is 39.083kg/day (average) on which hazardous waste is 10.7kg/day. The rate of waste generation is 0.071kg/patient/day. Most of the hazardous wastes are surgical wastes. In this hospital it was found that the percentage amount of general waste generation is 54%, sharp waste is 14%, pathological waste is 9% and the pharmaceutical waste is 23% which is shown in below (Figure 6).

Figure 6: Percentage of clinical Waste at Islami Bank Hospital.

Lupinepublishers-openaccess-journals-Civil-engineering-Architechture

Percentage of clinical Waste at Rajshahi Royal Hospital

Rajshahi Royal Hospital is another popular private hospital in Rajshahi city. The hospital has 30 beds capacity for resident patients and provides outdoor facilities for about 150 patients daily. In this hospital at first total wastes were segregated first and then different types were weighted. Total amount of waste generated is 13.09kg/day (average) on which hazardous waste is 2.667kg/ day. Most of the hazardous wastes are surgical wastes. The rate of waste generation is 0.072kg/patient/day. The percentage amount of sharp waste is 15%, pathological waste is 13%, pharmaceutical waste is 25% and general waste is 47% (Figure 7).

Figure 7: Percentage of clinical Waste at Rajshahi Royal Hospital.

Lupinepublishers-openaccess-journals-Civil-engineering-Architechture

Percentage of clinical waste Zamzam Islami Hospital

Another popular private hospital in Rajshahi city is Zamzam Islami Hospital. The hospital has 30 beds capacity for resident patients and provides outdoor facilities for about 200 patients daily. Hospital having facilities are pathology, radiology and imaging, microbiology, surgery, pharmacology, gynecology and so on).

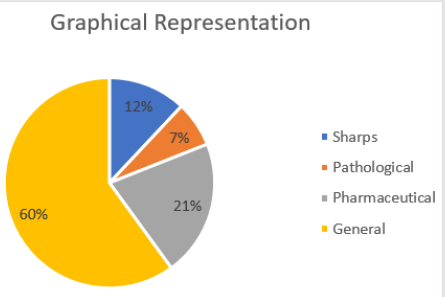
Total amount of waste generated is 18.618kg/day (average) on which hazardous waste is 4.61kg/day. Most of the hazardous wastes are surgical wastes. The rate of waste generation is 0.08kg/patient/ day. The percentage amount of sharp waste is 12%, pathological waste is 7%, pharmaceutical waste is 21% and general waste is 60% (Figure 8).

Figure 8: Percentage of clinical Waste at Zamzam Islami Hospital.

Lupinepublishers-openaccess-journals-Civil-engineering-Architechture

Percentage of clinical waste at Popular Diagnostic Centre

Popular Diagnostic Centre is one of the largest diagnostic centres in Rajshahi city having latest technology for pathogenic test, blood test, urine test etc. The hospital has no bed capacity for resident patients but provides outdoor facilities for about 700 patients daily.

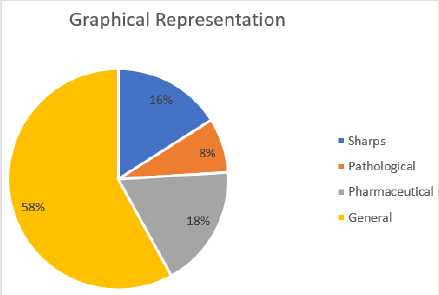
Total amount of waste generated is 39.83kg/day (average) on which hazardous waste is 9.2kg/day. The rate of waste generation is 0.057kg/patient/day. The percentage amount of sharp waste is 16%, pathological waste is 8%, and pharmaceutical waste is 18% and general waste is 58% (Figure 9).

Figure 9: Percentage of clinical waste at Popular Diagnostic Centre.

Lupinepublishers-openaccess-journals-Civil-engineering-Architechture

Analysis of Clinical Waste Management in Selected Hospitals

Waste segregation

The key to minimization and effective management of healthcare waste is segregation and identification of waste. Appropriate handling, treatment and disposal of waste by type reduce costs and do much to protect public health. It was observed that there were no segregation systems for infectious and non-infectious wastes at the site of production almost in all the Health Care Establishments. There was little systematic collection in the surveyed Health Care Establishments. They keep hazardous wastes such as syringes, gauges, cotton, blades, knives and infectious substances in red and yellow colored containers and non-hazardous wastes such as saline bags, plastic bottles, paper, kitchen garbage etc. in the green and black colored containers (Figure 10).

Figure 10: Segregation of waste.

Lupinepublishers-openaccess-journals-Civil-engineering-Architechture

On-site handling and Temporary storage

This is an important element in the overall solid waste management system because it can have significant effects on public health and on subsequent functional elements on the systems. Onsite handling refers to the activities associated with the handling of solid wastes until they are placed on containers for storage before collection. The place/storage area where medical wastes were kept before transporting to the incinerator or final disposing site was termed as temporary waste storage (Figure 11).

Figure 11: Temporary waste storage containers.

Lupinepublishers-openaccess-journals-Civil-engineering-Architechture

Off-site transportation

Clinical waste should normally be collected everyday due to its hazardous nature. The Rajshahi City Corporation has the responsibility for off-site transportation of the waste for final disposal or dumping. Rajshahi City Corporation authorities provide a van for collecting wastes from different Health Care Establishments. Every early morning, they collect wastes from Health Care Establishments and these collected wastes were transported to either the incinerator which is located at Rajshahi Medical College Hospital premises or Nowdapara Bhagar for dumping (Figure 12).

Figure 12: Waste collection vans.

Lupinepublishers-openaccess-journals-Civil-engineering-Architechture

Final disposal

Figure 13: Final disposal site.

Lupinepublishers-openaccess-journals-Civil-engineering-Architechture

The final disposing site in Rajshahi City Corporation was situated at Nawdapara which was locally called “Nawdapara Bhagar”. Medical wastes were collected everyday by rajshahi city corporation van due to its hazardous nature. Every early morning, the collected wastes are finally dumped by city corporation registered cleaners to this “Bhagar”. It was found from the survey that there was no consideration of distinguishing infectious waste with non-infectious waste when dumping. So, it may cause pollution to the environment as well as health hazard to people (Figure 13).

Discussion

From the field investigation, we observed that some Health Care Establishments are more systematic for color coding and segregation. Others follow color coding system and segregation but comparatively less than WHO standards. The hospital staffs from selected hospitals have awareness about hospital waste management practices but they need more training to do this in systematic way. Hazardous hospital waste is the serious problem for the Rajshahi city. Therefore, the efficient hospital waste management practice is essentially needed for all hospital in the Rajshahi city. The authorized person from hospital and solid waste management organization should try for possible waste reduction way from the hospitals. All the selected hospitals should follow the WHO guideline in the case of color coding. Temporary storage is kept separate for the general waste and hazardous waste.

The workers from all hospitals should carry the waste with trolley but at present they carry and transport with their own hand. Moreover, the workers have no protective clothes during the hospital waste handling. Clinical waste management in the Rajshahi is needed to provide training for hospital staff.

Rajshahi City Corporation manages treatment and disposal of hospital waste in Rajshahi City. They use incineration method for treatment. They cannot follow WHO guideline properly. General waste from hospital is sent to the open dumping site. Therefore, all of the hospital of Rajshahi City should try to improve their waste management practice.

Conclusion

The collection, storage and disposal of clinical wastes are of growing environmental problem in Bangladesh. Clinical wastes pose a significant impact on health and the environment. There is not enough information on clinical waste management technologies and impacts in developing countries. All selected clinics and diagnostic centers are joined with Rajshahi City Corporation for waste disposal and treatment. The collected field data showed that all the Health Care Establishment generate pathological wastes, used syringes, broken glass and bottles, textile stained with blood and papers. The level of awareness on clinical waste is very high, but they are not able to manage the waste systematically since there are lacking of systems, rules and regulations and financial support. The Rajshahi City Corporation also has some limitation for proper clinical waste management. Actually, when they collect these wastes, they used to collect hazardous and non-hazardous waste in a single van and then the wastes are mixed. Also, they dispose the all clinical wastes in the same area. So there remains a great chance of environmental pollution. Hence, we should raise the level of awareness and should follow the proper rules and regulation for clinical waste management.

Read more about Lupine Publishers Journal of Civil Engineering and its Architecture Click the below link : https://lupinepublishers-civilengineering.blogspot.com/


Saturday, 10 June 2023

Lupine Publishers | Standardization of Technology for Preparation of Sani-A Jaggery Based Crushed Sesame

 Lupine Publishers | Journal of Food and Nutrition


Abstract

Sesame seeds are used in the preparation of a number of food products. In north India, the black sesame seeds are used in preparation of Sani-Jaggery based crushed sesame. In this study an attempt was made to standardize the method for preparation of sani and enrich its quality with addition of different levels of dry fruits (cashewnuts and Almonds, date, Figures, Coconut shreds) and Honey and also assessed organoleptic and storage stability. The standardized sani was organoleptically evaluated using a sensorial affective hedonic scale. The results indicate that Sani samples prepared from raw sesame with 60% Jaggery and mixed with different level of dry fruits and packaged in PET (Polyethylene Terephthalate) container and stored at room temperature got good mean score up to 25 days storage except honey-based samples which was spoiled after 10 days storage. It was revealed that among all the sani treatments, Sani prepared with 10% addition of shredded cashewnuts and almonds (1:1) got highest mean sensory score for overall acceptability up to 25 days storage. There was a considerable growth in the microbial population during storage of sani samples but recorded below the satisfactory level up to 25 days of storage. E. coli and Salmonella was not detected in any of the samples during entire storage period.

Keywords: Sani; Sesame; Sensory; Storability; Microbial load

Introduction

Sesame (Sesamum indicum L) is one of the world’s important and oldest oilseed crop known to man that plays an important role in human nutrition. Sesame seeds are good source of proteins, complex carbohydrates and some minerals. The chemical composition of sesame shows that the seed is an important source of oil (44-58%), protein (18-25%), carbohydrate (~13.5%) and ash (~5%). Sesame seed is of approximately 50 percent oil (out of which 35% is mon Ranganna ounsaturated fatty acids and 44% polyunsaturated fatty acids) and 45 percent meal (out of which 20% is protein) [1,2]. It is source of nutritional and helpful biologically active components, such as phytochemicals Kanu et al 2007. Presence of isoflovones and sesamin plays a role in human health. India is the second highest producer of sesame seeds after Myanmar with an annual production of 751000 MT, followed by China and Tanzania during year 2017(Anon., 2020). Gujarat contributes 30% of total production followed by West Bengal (17.8%), Rajasthan (17.6%), Tamil Nadu (7.6%) Andhra Pradesh (5.4%) and Madhya Pradesh (5.2%) [3].

Sesame seeds are used in the preparation of a number of food products. In the Far-East, sesame seeds are roasted (180-200 °C) and their oil is extracted and sold as roasted sesame oil. Sesame oil is used as a salad or cooking oil, in shortenings, margarine and to marinate meat and vegetables. The seed is also consumed throughout the world in condiments and as an essential constituent in different recipes. It is used to add texture and flavor to bread, biscuit, cracks and salad dressing. In Gujarat sesame seeds are used in preparation of till chikki and particularly the black sesame seeds are used in preparation of Sani. Sani is the product prepared by mixing the jaggery with raw or roasted sesame seeds and partially crushing in equipment called ghani until the oozing of oil from sesame seeds. Sometimes sani is enriched by using date, Figures, cashew nut, almond, gums, coconut and many other valuable ingredients. Sani is especially prepared and consumed in winter to keep the body warm and aiding blood circulation. But no scientific and standard method is available for the preparation of sani. Therefore, this study was proposed to standardize the method for preparation of sani and to evaluate it’s organoleptic.

Materials and Methods

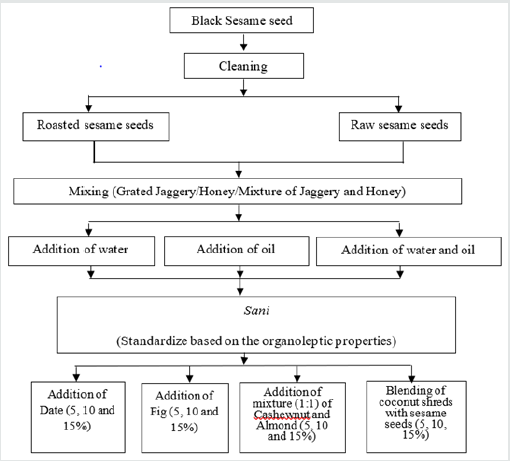
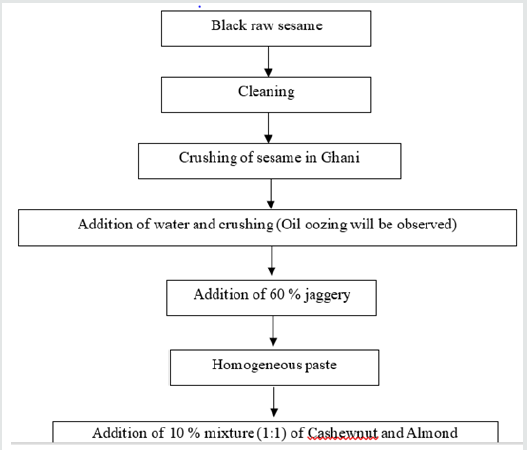
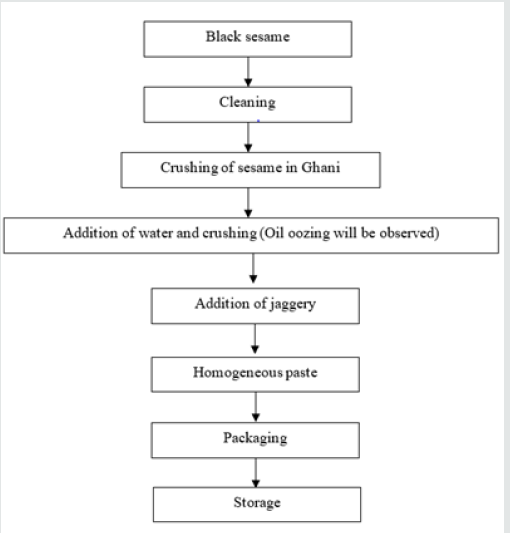
Initially Sani-Jaggery based crushed sesame was developed according to the experimental details shown in Figures 1. Earlier, it was decided to add oil and oil with water but during the experimentation, it was found that oil separated out during the crushing process was sufficient to prepare the sani. So, there was no need to add extra oil. Hence, it was decided to discard the treatment of addition of oil and oil with water. The sani prepared using honey was found to be sour after 3-4 days of its preparation. The samples added with honey got the good sensory score, but its shelf life was shorter. Keeping all these facts in view, the experiment was divided in to two parts viz., sub-experiment-I and sub-experiment-II as per flow charts given in Figures 2 & 3, respectively. All the samples of both experiments (Sub Exp-I &Exp-II) were kept for 1 month of storage and analyzed in terms of arithmetic mean of their sensory attributes such as taste, flavour, colour, texture, appearance and overall acceptability at 5 days interval by 9-points Hedonic scale standard method as suggested by Ranganna et al. [4]. Mean sensory score of different attributes table is presented here under. The panelists from different ages including students and faculties were given the coded samples of sani and allowed to judge the samples for different sensory attributes based on their degree of preference [5-8].

Figure 1: Experimental process flow chart for the preparation of Sani.

upinepublishers-openaccess-Food-Nutrition

Figure 2:Sub experiment-I process flow chart.

upinepublishers-openaccess-Food-Nutrition

Figure 3: Sub experiment-II process flow chart.

upinepublishers-openaccess-Food-Nutrition

Experimental Details Sub-experiment I

The sub experiment I was carried out as per details and flow chart given below.

Independent parameters

Type of sesame (A): (A1= Roasted and A2= Raw). Level of Jaggery (B): (B1=40 %, B2=50 % and B3=60 %).

Results and discussion of sub-experiment I

Effect of sub-experiment-I treatments on organoleptic properties viz., taste, flavor, texture, Color, Appearance and Overall acceptability were studied, and their results are summerized below.
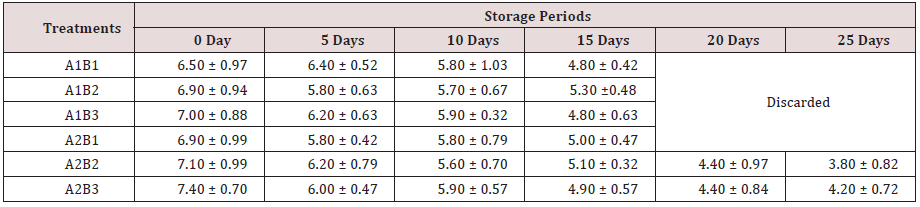
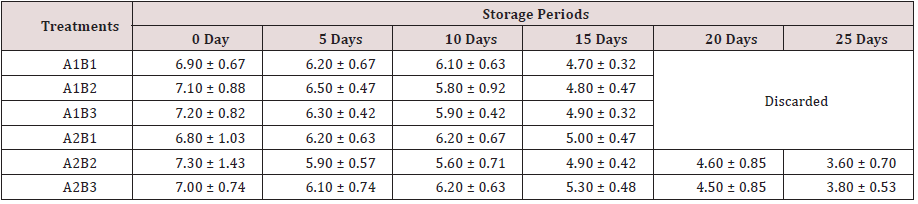
From the Table 1, it can be seen that the sensory mean score for the taste of different samples was decreased with an increase in storage period. On the first day, the highest mean score for the taste was reported for the sample A2B3 (7.40±0.70) followed by A2B2 (7.10±0.99). It was also noted that after 15 days of storage treatmets A1B1, A1B2, A1B3 and A2B1 were spoiled hence this four treatments are discarded. A2B3 treatment got highest taste mean score (4.20±0.72) followed by treatment A2B2 with taste mean score(3.80±0.82) after 25 days storage.

Table 1: Mean score for Taste of different samples at 5 days interval of storage (Mean ± SD, n=10).

upinepublishers-openaccess-Food-Nutrition

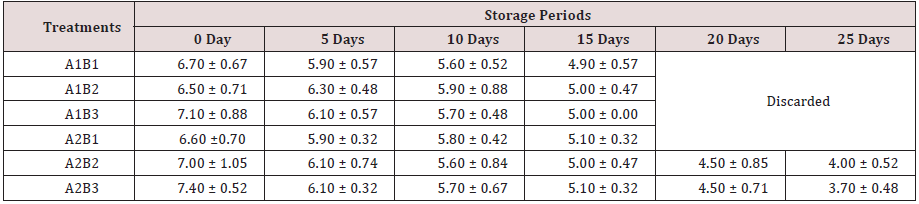
From the Table 2 it can be seen that as the storage period increases, the sensory mean score for the flavour decreases. On the first day, treatment A2B3 had highest mean score (7.46) followed by treatment A2B2 (7.40±0.52). But after 25 days of storage, remainig both treatments had decreased sensory mean score for the flavour, treatment A2B2 and A2B3 had sensory mean score of 4.00±0.52 and 3.70±0.48 respectively.

Table 2: Mean score for flavor of different samples at 5 days interval of storage (Mean ± SD, n=10).

upinepublishers-openaccess-Food-Nutrition

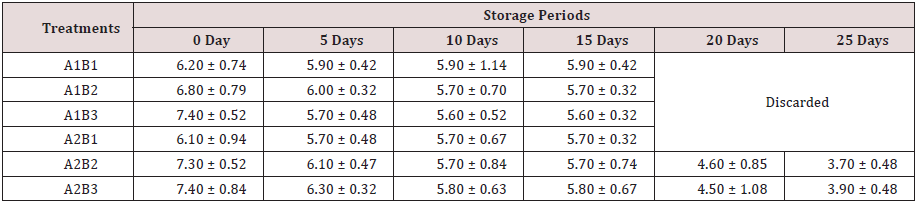
From the Table 3, it can be seen that as the storage periods increased, the sani had poor texture. As the time passed, sensory mean score of the texture decreased. The product slightly got dried-up due to evaporation of moisture which also resulted in decrease in texture mean score. The sani found harder with the increase in storage period. On the very first day, the treatment A1B3 and A2B3 found highest sensory mean score (7.40) followed by the treatment A2B2 (7.30±0.52). Hardness in the form of texture increased as the storage life increased. At the end of the 25 days treatment A2B3 had mean score of 3.90±0.48 for the texture followed by 3.70±0.48 (A2B2).

Table 3: Mean score for Texture of different samples at 5 days interval of storage (Mean ± SD, n=10).

upinepublishers-openaccess-Food-Nutrition

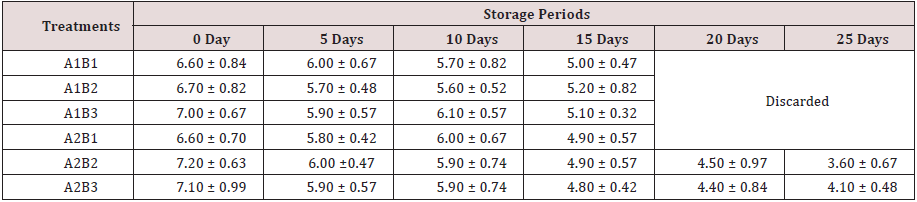
From Table 4, it can be seen that the mean score for the appearance decreased as the storage period increased. At the first day, the treatment A2B3 had the highest mean score of 7.20±0.63 followed by A2B3 (7.10±0.99) and A1B3 (7.00±0.67). At the end of the Day-25, the sensory mean score for the appearance decreased in comparison to Day 25. The (4.10±0.48) mean score was noted for the treatment of A2B3followed by treatment A2B2 (3.60±0.67).

Table 4: Mean score for appearance of different samples at 5 days interval ofstorage (Mean ± SD, n=10).

upinepublishers-openaccess-Food-Nutrition

Table 5 represents the mean sensory mean score for the color of different sani samples. From the data, it can be seen that highest mean score for color was noted for the treatment A2B2 (7.30±1.43) followed by A1B3 (7.20±0.82). But as the storage period increased, mean score for the color decreased and at the end of the Day-25, treatment A2B3 had highest mean score for the color (3.80 ± 0.53) followed by A2B2 (3.60±0.70).

Table 5: Mean score for color of different samples at 5 days interval of storage (Mean ± SD, n=10).

upinepublishers-openaccess-Food-Nutrition

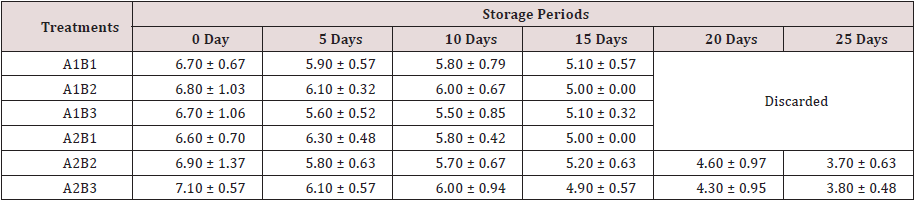
Table 6 represents the overall acceptability of the different treatments. It can be seen that the mean score for the overall acceptability decreased as the storage period increased. At the first day, the treatment A2B3 had the highest mean score of 7.10±0.57followed by A2B2 (6.90±1.37) and A1B2 (6.80±1.03). At the end of the Day-25, the sensory mean score for the overall acceptability decreased in comparison to Day 1. The highest mean score was rated for the treatment of A2B3 (3.80±0.48) followed by A2B2.

Table 6: Mean score for overall acceptability of different samples at 5 days interval ofstorage (Mean ± SD, n=10).

upinepublishers-openaccess-Food-Nutrition

Results of sub experiment I

Sani samples were prepared according process flow chart shown in Figures 2 and packaged in PET (Polyethylene Terephthalate) container and stored at room temperature. During storage it was found that the mean sensory score of all treatments were decreased, but remained well within acceptable limits during 15 days storage period. After the 15 days storage the treatment A1B1, A1B2, A1B3 and A2B1 were spoiled therefore after 15 days storage period, these four treatments were discarded. The mean sensory score of treatments A2B2 and A2B3 reported within acceptable limits up to 25 days storage period.
Among these two treatments, treatment A2B3 (raw sesame with 60% Jaggery) had the highest mean score of 7.10±0.57 for overall acceptability. Treatment A2B3 also got good sensory mean score up to 25 days storage. Keeping above fact in view, it is revealed that the raw sesame with 60% Jaggery is best combination for sani making process.

Further the Sub experiment-II was carried out to developed Sani as per treatment A2B3 (raw sesame with 60% Jaggery) of sub experiment-I with addition of dry fruits at different levels according to the experimental details and flow chart given below.

Experiment details of sub-experiment II

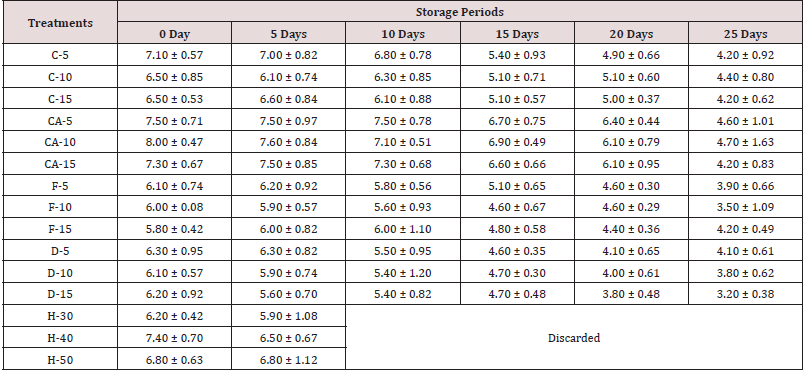
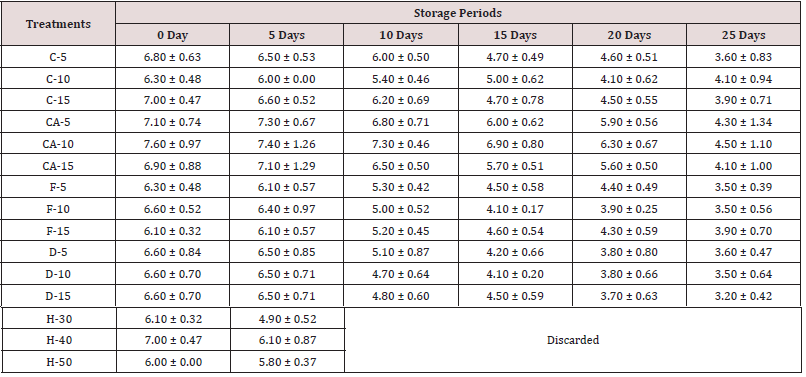
Effect of different treatments on Taste of sani sample at 5 days’ intervals of storage is reported in the Table 7. From the data it can be seen that the mean sensory mean score for the taste of different samples was decreased with an increase in storage period. On the first day, the highest mean score for the taste was reported for the sample CA-10 (8.00±0.47) followed by CA-5 (7.50±0.71). From the data, it can also be seen that fresh honey-based samples got good sensory mean score but after 10 days of storage, they started to become sour so they were discarded after 10 days of storage. After 25 days of storage, the highest taste mean score (4.70±1.01) was observed for the treatment CA-5 and CA-10 while the lowest taste mean score (3.20±0.38) was recorded by the treatment D-15.

Table 7: Taste mean score of different sani treatments at 5 days intervals of storage (Mean ± SD, n=10).

upinepublishers-openaccess-Food-Nutrition

Table 8 represents the Flavor mean score of different sani treatments at 5 days’ intervals of storage.it can be observed from the Table 8, that the mean sensory score for the flavor of different samples was decreased with an increase in storage period. On the first day, the highest mean score for the flavor was found for the sample CA-10 (7.70±0.48) followed by CA-5 (7.00±0.94). At the end of 25 days of storage, the highest flavor mean score (4.40±0.57) was observed for the treatment CA-10 while the lowest taste mean score (3.30±0.46) was reported by the treatment D-15.

Table 8: Flavor mean score of different sani treatments at 5 days intervals of storage (Mean ± SD, n=10).

upinepublishers-openaccess-Food-Nutrition

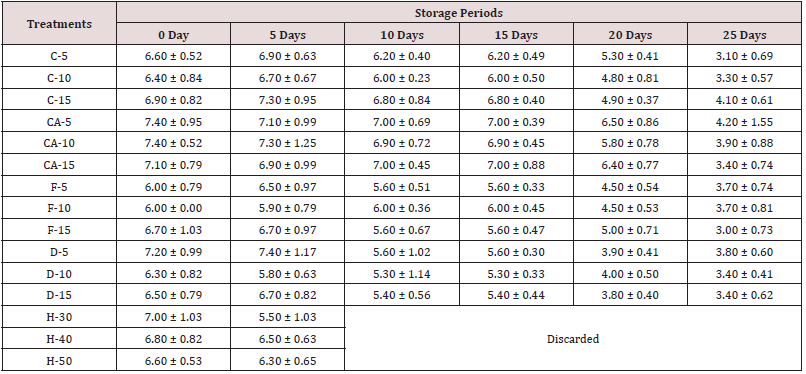
The influence of different treatments on Texture of sani sample during storage is shown in Table 9. From the data it was noted as the time passes, sensory mean score of the texture decreases. The sani found harder with the increase in storage period. At the first day, the cashewnuts and Almonds added Sani sample got highest mean score. The treatment CA-5 and CA-10 had the highest mean score of 7.40±0.95followed by D-10 (7.20±0.99). At the end of the 25 day, the sensory mean score for the texture decreased in comparison to 1st Day and the highest mean score was rated for the treatment CA-5 (4.20±1.55) followed by C-15 (4.10±0.61).

Table 9: Texture mean score of different sani treatments at 5 days intervals of storage (Mean ± SD, n=10).

upinepublishers-openaccess-Food-Nutrition

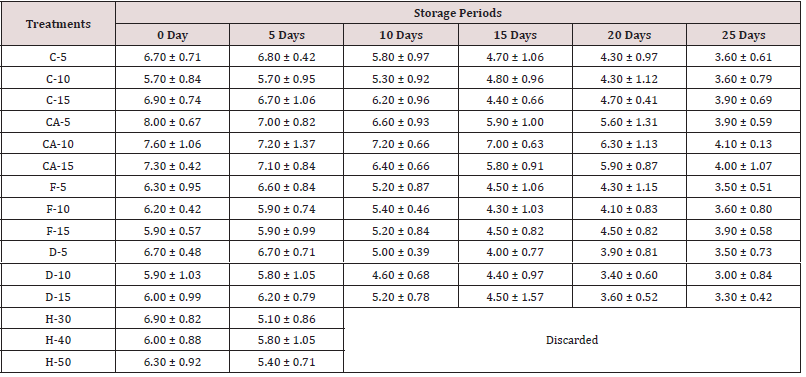
Table 10 represents the color mean score of different sani treatments at 5 days’ intervals of storage. It can be seen that the mean score for the color decreased as the storage period increased. At the first day, the treatment CA-5 had the highest mean score of 8.00±0.67followed by CA-15 (7.30±0.42). At the end of the 25 days, the sensory mean score for the color decreased in comparison to 1st day and the highest mean score was rated for the treatment CA-10 (4.10±0.13) followed by CA-15 (4.00±1.07).

Table 10: Color mean score of different sani treatments at 5 days intervals of storage (Mean ± SD, n=10).

upinepublishers-openaccess-Food-Nutrition

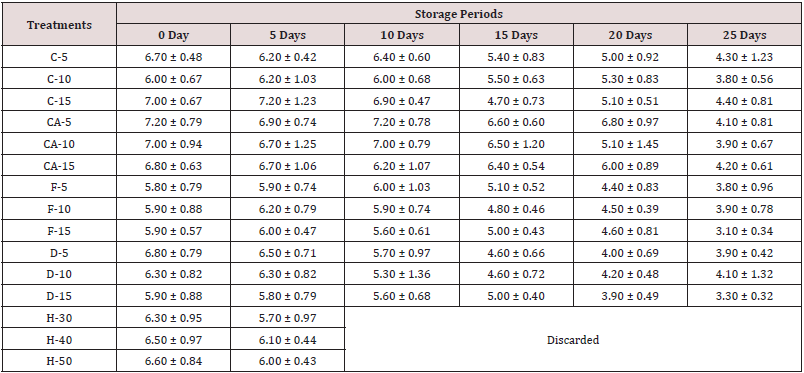
Table 11 represents the appearance mean score of different sani treatments at 5 days’ intervals of storage. Mean score for the appearance is gradual decline in sensory attributes during storage in all treatments. At the first day, the treatment CA-5 had the highest mean score of 7.20±0.79, followed by C-15 (7.00±0.67) and CA- 10 (7.00±0.94). At the end of the 25 days, the highest sensory mean score for the appearance was rated for the treatment C-15 (4.40±0.81) followed by treatment C-5 (4.30±1.23).

Table 11: Appearance mean score of different sanitreatments at 5 days intervals of storage (Mean ± SD, n=10).

upinepublishers-openaccess-Food-Nutrition

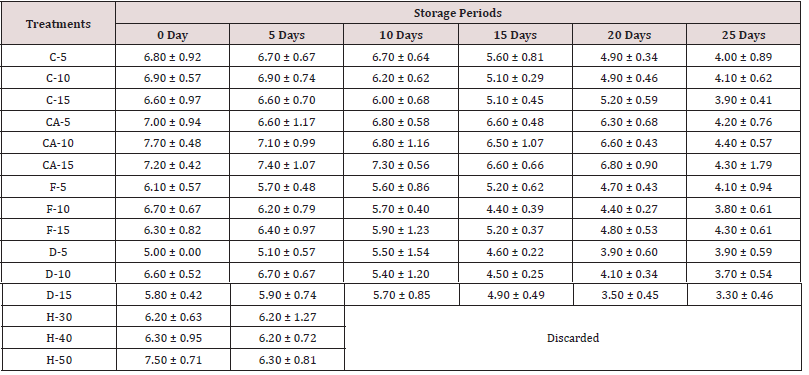
It is clearly observed from the Table 12 data that the mean score of overall acceptability of the different sani products stored at room temperature decreased with the passage of time. On the first day, the highest mean score for the overall acceptability was found for the sample CA-10 (7.60±0.97) followed by CA-5 (7.10±0.74). At the end of 25 days of storage, the highest overall acceptability mean score (4.50±1.10) was observed for the trea

Table 12: Overall acceptability mean score of different sani treatments at 5 days intervals of storage (Mean ± SD, n=10).

upinepublishers-openaccess-Food-Nutrition

Microbial status of sani during storage

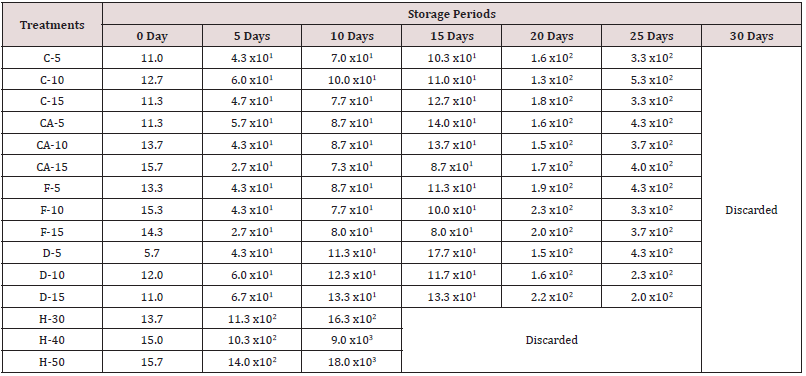
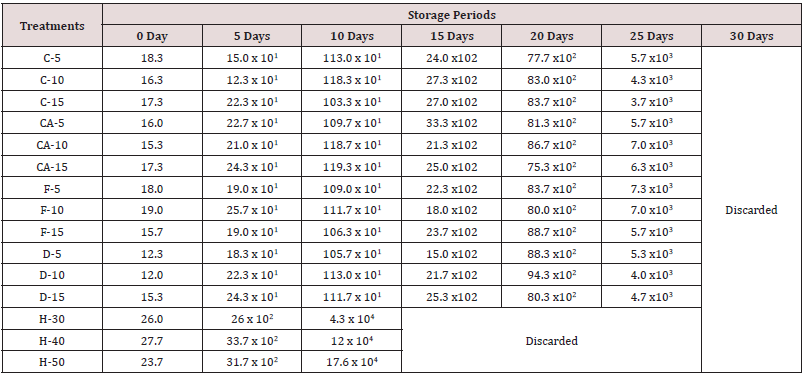
Microbial analysis in terms of Total plate count (cfu/g), yeast & mould (cfu/g), E. coli (cfu/g) and Salmonella (cfu/g) count were determined as described by AOAC 2006 [7] 18th ed. 1g of each sample was added to 9ml sterile distilled water and vortexed. This formed the initial dilution from which subsequent tenfold dilutions were made and used for analysis. Portions 0.1ml of different serial decimal dilution was spread plated on nutrient agar for total plate count and potato dextrose ag APEDA ar for fungi count. Total plate count and Yeast & Mold count (cfu/g) are presented in Table 13 & 14. E. coli and Salmonella was not detected in any of the samples during entire storage period.

Table 13: Total plate count (cfu/g) of different sani treatments at 5 days intervals of storage.

upinepublishers-openaccess-Food-Nutrition

Table 14: Yeast & Mould count (cfu/g) of different sani treatments at 5 days intervals of storage.

upinepublishers-openaccess-Food-Nutrition

The perusal of Table 13 & 14 revealed that there was a considerable growth in the microbial population during storage of different sani samples. In jaggery based sani counts were recorded below the satisfactory level i.e. < 1x10⁴ cfu/g hence, assumed to be safe and fit for human consumption up to 25 days of storage. After the 30 days of storage all the samples cross the recommended level of total plate count as well as yeast & mould count, therefore all the sample were discarded after 30 days of storage. It was observed that the honey based sani gave the satisfactory results for microbial population up to 5 days’ storage. After the 10 day of storage, honey became sour and microbial population of the honey-based samples was reached above the prescribed limit. They are assumed to be unsafe for human consumption so, all the honey-based samples were discarded after 10 days of storage.

Conclusion of sub-experiment-II

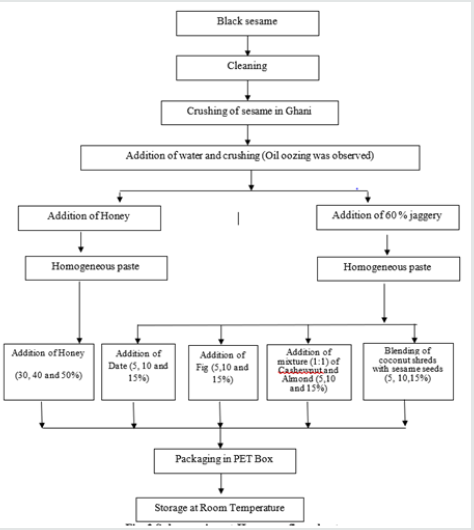
Sani samples prepared from raw sesame with 60% Jaggery and mixed with different level of dry fruits according to process flow chart shown in Figures 3 & 4. The samples were packaged in PET (Polyethylene Terephthalate) container and stored at room temperature during the sub experiment-II. All the samples got good mean score up to 25 days storage except honey-based samples which was spoiled after 10 days storage. Therefore, all the honeybased samples were discarded after 10 days storage. It was found that among all the sani treatments, treatment CA-10 (Sani prepared with 10% addition of Cashewnuts and Almonds (1:1)) got highest mean sensory score for overall acceptability up to 25 days storage. The treatment CA-10 had overall acceptability mean score of 7.6 on 1st day and 4.5 on 25th day of storage (Table 15).

Figure 4: Standardized method for sani preparation process flow chart.

upinepublishers-openaccess-Food-Nutrition

Table 15:

upinepublishers-openaccess-Food-Nutrition

The Bio-Chemical Analysis of Optimized Sani Sample

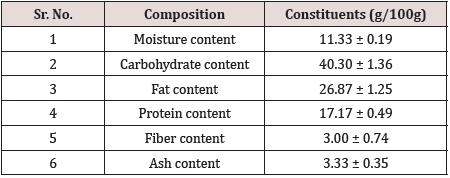
The bio-chemical constituent of optimized sani sample was analyzed in triplicate for moisture content, fat content, protein content, fiber content and ash content using standard methods of Association of Official Analytical Chemists (AOAC, 2006). The carbohydrate content was obtained by difference (i.e. subtracting the values obtained for moisture content, fat content, protein content, fiber content and ash content from 100). The results are as under.

Conclusion

In this present study the formulation and process for preparation of sani enriched with different level of dry fruits were standardized. The research data discovered from this research suggest that Sani should be prepared from black raw sesame with 60% jaggery added with 10 % Cashewnut and Almond (1:1). The sani prepare from this method and packed in PET (Polyethylene Terephthalate) container safely stored at room temperature without quality deterioration up to 25 days storage except honey-based samples which was spoiled after 10 days storage.

Acknowledgments

The authors are grateful to Project Coordinator (Sesame & Niger), All India Coordinated Research Project on Sesame and Niger, ICAR authors would also like thank to the Junagadh Agricultural University for cooperation and provided necessary facilities to achieve the desired goals of this research.
Conflict of Interest

We declare that we have no conflict of interest.

Read More About Lupine Publishers Journal of Food and Nutrition Please Click on Below Link:
https://lupine-publishers-food-and-nutrition.blogspot.com/

Friday, 9 June 2023

Lupine Publishers | Myocardial Perfusion Imaging Reveals Breast Cancer

 Lupine Publishers | Journal of Oncology


Abstract

Diagnostic evaluation of chest pain using myocardial perfusion imaging (MPI) is a common method employed to look for coronary artery disease (CAD). The isotopes used in MPI are also useful for imaging cancer, including breast cancer. We present a case where breast cancer was diagnosed using a quantitative method which simultaneously looks for cancer and CAD.

Introduction

Diagnostic evaluation of patients with chest pain may include myocardial perfusion imaging. During the initial stress imaging evaluation, differences in regional blood flow and metabolism differentiates normal coronary blood flow from abnormal – viz. ischemia. Breast cancers are also associated with increased regional blood flow and metabolism and can be seen during the initial imaging as was done in this woman. Awareness of these similarities resulted in identification and successful treatment of her breast cancer prior to further spread of the cancer.

Case Report

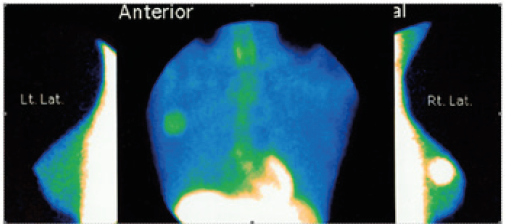
A 39-year old woman presented with atypical chest pain. She was referred for myocardial perfusion imaging. Following pharmacologic stress, her initial images - shown here - were acquired 5-minutes after isotope injection. A mass was identified in her right breast and was surgically removed revealing a Stage IIA breast cancer without LN involvement. Additional workup revealed no evidence of metastatic disease. The patient elected to undergo no further treatment.

Discussion

Quantitative measurement following enhancement of regional blood flow differences, which reflect both changes in metabolism and regional blood flow, can be measured to unmask ischemia and cancers [1]. These changes can reflect CAD, which is itself caused by inflammation [2], as well as pre-cancerous changes, which can also be associated with inflammation.

Conclusion

By understanding the fundamental differences in tissue resulting from changes in metabolism and regional blood flow differences, nuclear imaging can quantitatively unmask CAD and hidden cancer (Figure 1).

Figure 1: Figure of FMTVDM.

Lupinepublishers-openaccess-cancer-Oncology

Acknowledgment

FMTVDM issued to first author. Figures reproduces by expressed consent of first author.

Read More About Lupine Publishers Journal of Oncology Please Click on Below Link:
https://lupine-publishers-cancer-journal.blogspot.com/