Lupine Publishers| Journal of Nanomedicine
Abstract
γ-ray radiation was used to reduce graphene oxide thin films to partially reduced graphene oxide films at ambient conditions. Micro-Raman spectroscopy showed that irradiation of GO with γ-rays did not change the structure of graphene. The γ-rays are only active on the oxygen functional groups bonds because they are short and highly energized wavelengths. γ-rays penetrate the C-C lattice isotropically hence sustaining the graphene layer structure. This results in transparent and intact r-GO thin films with no structural defects. The defects on the structure would result to the opaqueness of the C-C lattice hence compromising the transparency of the material. The Scanning electron microscopy, Transmission Scanning electron, Fourier transform infrared and Raman spectrometry are presented.
Abbrevations: ITO: Indium Tin oxide, TCOs: Transparent Conducting Oxide, GFs: Graphene flakes, FE-SEM: Field Emission Scanning Electron Microscope, TEM: Transmission Electron Microscope, GO: Graphene oxide, FTIR: Fourier Transform Infrared
Introduction
Indium Tin oxide (ITO) has been for so many years used as a transparent and conductive material on our mobile phones and television screens. However, since ITO is expensive and environmentally harsh it is therefore, critically important to come up with an alternative material that will replace it. This material should be environmentally friendly, cost effective and much more efficient and accessible. Graphene which is a competitive candidate is atomically thick, two-dimensional platelets featuring carbon atoms in a honeycomb arrangement. These sp2-hybridized sheets of carbon possess a host of desirable properties, including high mechanical stiffness (1 TPa) [1-2], good thermal conductivity (5000Wm_1 K_1) [3-6], and excellent charge carrier mobility (250 000cm2 V_1 s_1) [3]. As such, graphene has been studied for use in a variety of applications that exploit these properties [7-10] ranging from gas sensors [6] to lithium-ion battery electrodes [11- 14] as well as transparent conducting oxide (TCOs) type electrodes. Current reduction methods for producing colloidal graphene for graphene based electrodes from graphene oxide typically afford Nano sheets with high C/O ratios (∼10) [15] that exhibit good electrical conductivity and optical transparency.
Graphene flakes (GFs) and carbon nanotubes are very promising for molecular sensors, single-electron transistors, super capacitors, non-volatile memory devices, integrated circuits, atomic scale switches and other carbon based electronic and magneto-electronic devices [16-18]. Graphene in particular exhibits outstanding properties in various novel applications [19-23]. Specifically, sensing is arousing continuous interests due to the low background noise and the excellent surface activity [24,25], targeting to employ them in practical application. Various graphene Nano sensors have been fabricated in previous works [26-28]. The industrialization and commercialization of graphene Nano sensors require the preparation of graphene in quantity. Several methods have been used to synthesize graphene, among which, there is the reduction of graphene oxide which is a promising path toward high-yield production of graphene. It is however, known that the negative influence rendered by this method, that is the defective graphene structure, hinders the application in the field requiring excellent conductivity such as transparent conductive film [2].
Chemical reagents are fundamental to the reduction of GO. For instances, hydrazine hydrate (H2O4) which is used to reduce GO to r-GO is poisonous and toxic to human life. Taking sensing into consideration, the introduction of chemicals is a serious disadvantage because the intrinsic response of graphene to trace analyte may be masked by the signals caused by the impurities [29]. Therefore, a reduction method without impurities involved should be developed. Herein, we report on facile and environmentally friendly reduction method to synthesis a well-dispersed graphene from graphene oxide as a conductive and transparent dye solar cell electrode. This contribution reports on the synthesis of reduced graphene coatings for TCOs type applications in Gratzel dye solar cells and the description of some fundamental reactions taking place during the reduction phase.
Characterization
The surface measurements were recorded with a JEOL 7500F field emission Scanning electron microscope (FE-SEM). Transmission electron microscope (TEM) images were obtained on Fei Tecnai G2-20 operated at 200kV using an energy filter of 20eV. The Chemical and crystalline nature on the wings was analysed with the Perkin Elmer spectrum 100 (FT-IR) in the transmission mode operating with the wave number range of 400-4000 cm-1 at a scan speed of 0.20cm/s and a resolution of 4cm-1. Raman spectra were carried out using Horiba Jobin Yvon HR 800 model DU 420AOE with power of 20m Watts at an excitation wavelength of 514.5 nm with an argon ion laser from 100 to 4000 cm-1. Gamma ray with Co60 source type GIK-9-4, S/N 08398 and 56 TBq was used.
Experimental Methods & Results
Raw Materials
Natural graphite flakes (Bay carbon) were bought from Germany. 98 % Sulphuric acid (H2SO4), Potassium permanganate (KMnO4), Sodium nitrate (NaNO3), 30 % Hydrogen peroxide (H2O2) were locally purchased from Sigma Aldrich. All chemicals were of analytical grade reagents and were used without any further purification
One-Step Synthesis Of Graphene Oxide (Go)
5g of commercial graphite flakes (Bay Carbon) was added to 3.8g of sodium nitrate while 169 ml of sulphuric acid (H2SO4) was slowly added in agitated ice bath. 22.5g Potassium Permanganate (KMnO4) was also added while agitating for an hour maintaining the temperature below 20 oC. The solution was cooled for 2hrs, then removed from ice bath and allowed to stand for five days in a gentle stir at temperature below 20 oC. A highly viscous liquid was produced. As prepared solution was added with 498 ml distilled water and 1.4ml sulphuric acid was slowly added in this viscous liquid while agitating for 1 hour. Stirring continued for two hours and a liquid turned brown. 15ml of 30% Hydrogen Peroxide (H2O2) was slowly added and stirring continued for another two hours while effervescence was observed. This resulted in brownish solution of Graphene oxide (GO).
GO Reduction
The GO thin films on SiO2/Si glass substrates were directly irradiated using a Co60 γ-ray source at dose rate of 6 Gy min-1 at ambient conditions.
Results and Discussion
The short wavelength and high energy γ-ray interaction with deionized water (d-H2O) produces excited electrons, ions and molecules which reduce GO. The number of layers of exfoliated graphene oxide and the concentration of graphene sheets is not dependent on the γ-rays induced but rather on the quality of graphene oxide synthesized and the fabrication of the thin film. The GO is not totally reduced as this is a very difficult task hence reduced graphene oxide (r-GO).
Scanning Electron Microscope
The morphological properties of the fabricated GO thin films were investigated by Scanning electron microscopy. Figure 1 shows SEM images of a typical large area GO and r-GO film transferred onto SiO2/Si substrates. The SEM images show that the vacuum filtration method produces GO and r-GO thin films which are of uniform thickness and large surface area. When there is chemical conversion of GO to r-GO, holes and defects are easily produced on the carbon grid. This could be attributed to the fact that these holes are a result of removal of oxygen functional group species during the reduction process [30]. But for the γ-ray reduction, that does not seem to be the case because the γ-rays are short wavelengths that are only active and penetrate on the carbon bonds without causing any structural damage. This is demonstrated by ultrathin and homogenous graphene film. However, r-GO image shows rippled graphene layer instead of completely flat layer. This could be attributed to the removal of water from the graphitic gallery.
Figure 1: SEM images (with 80 000xmag) of a large surface area GO (a) and r-GO (b) thin films on a SiO2/Si substrate fabricated using vacuum filtration method.

Transmission Electron Microscope
The morphology and structure of the graphene oxide and reduced graphene oxide were also studied by transmission electron microscope (TEM) analysis. The transmission electron microscope spectra of graphene oxide and reduced graphene oxide are presented in Figure 2a- 2c shows large GO sheets which were observed on the top of the copper grid. The most transparent and featureless regions are likely to be layer of GO. Different from bulk GO sheets, the reduced graphene oxide, r-GO sheets, are no longer totally flat and smooth but always exhibit some corrugation, where they resemble crumpled silk veil waves. Especially, any particular area of the particle shows considerable folding Figure 2b.
Figure 2: Transmission electron micrograph GO (a) and r-GO (b) thin films on a SiO2/Si substrate fabricated using vacuum filtration method (c) SEM image of graphene scrolled layers.

Fourier Transform Infrared (FTIR)
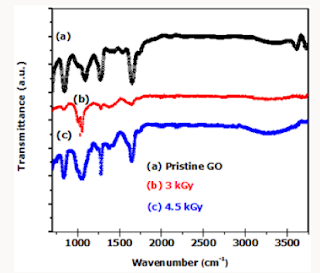
As reported in Figure 3, the FTIR spectra of the pristine GO shows the presence of oxygen species represented by the hydroxyl groups (3050-3800cm-1), ketones groups (1600-1650cm-1), carboxyl groups (1650–1750 cm-1) and contribution from C-O and C=O groups (1100-1280cm-1). The presence of the sp2-hybridized C=C (1500-1600cm-1) in Pristine GO shows that some parts of the GO material is not completely oxidized. Reduction of GO to r-GO is shown by a decrease or complete disappearance of the following oxygen species (peaks) represented by hydroxyl groups (3050- 3800cm-1), ketones groups (1600-1650cm-1, 1750-1850cm-1). Ketones groups (1600-1650cm-1), carboxyl groups (1650-1750 cm- 1) in the 3.0kGy irradiated GO films.
Figure 3: Typical ATR-FTIR spectra of of GO and r-GO irradiated at different γ-ray doses.

The γ-ray treatment was carried at ambient conditions. Continued irradiation of GO films resulted in the reappearance of the following oxygen species represented by the presence of hydroxyl groups (3050-3800 cm-1), ketones groups (1600-1650cm-1), carboxyl groups (1650-1750c) and contribution from C-O and C=O (1100-1280cm-1). This crystal clearly indicates that -radiation can be used to partially reduce GO thin films at ambient conditions but cannot be used to completely reduce GO films to r-GO because -radiation can also break C-C bonds. The breaking of C-C and C=C bonds at ambient conditions results in the formation of C-OH, C-O-C and, C=O bonds. This then explains why graphene undergoes what is termed self-healing process (reorganizing itself to the sp3 hybridized electronic configuration).
Micro-Raman Spectroscopy Investigation
Raman spectroscopy is a non-destructive technique used to obtain structural information about carbon-based materials [31]. Raman spectra have two characteristic peaks of graphitic carbon material that is the first order D and G peaks and their overtones. This first order peaks arise from the vibration of sp2-carbon corresponding to 1355cm-1 and 1585cm-1 respectively. The D peak which represents the breathing mode of aromatic ring arising from the defect in the sample [32] has intensity always used to measure the magnitude of the disorder [32]. The G peak corresponds to the optical E2g photons at the Brillouin zone center resulting from both stretching of sp2 and carbon atoms in both rings and chains while the D peak is due to the breathing modes of the six-atom rings and requires a defect for its activation [33,34]. Figure 4 reports the room temperature Raman spectra at various gamma irradiation doses. The changes in the G band peak positions and the ID/IG ratio of the GO films upon irradiation in Table 1. A slight downshift of the G Peak positions from 1591cm-1 in GO to 1592cm-1 in GO irradiated with 300Gy/min gamma radiation showing that indeed GO was reduced to partially reduced graphene oxide.
Figure 4: Raman spectra of GO and r-GO irradiated at different γ-ray doses.

Table 1: The Raman D, G, ratio intensities of samples at different γ-ray doses.

Conclusion
We have therefore, shown for the first time that γ-radiation can be used to reduce graphene oxide films using distilled water as aqueous media. We propose that the γ-rays break C-O bonds of the carbonyl, carboxylic and the hydroxyl group of the graphene oxide matrix leaving the graphene film intact. The SEM images demonstrate ultrathin and homogenous GO and r-GO films. TEM shows the thermodynamic stability of the 2D membrane as a result from microscopic crumbling via bending or buckling. This phenomenon also supports that the coarse aggregates have been exfoliated completely. FTIR analysis show reduction at 3kGy and reappearance of oxygen functional groups at 6kGy when carbon lattice undergoes self-healing process. The Raman shows the reduction of GO with a more ordered carbon structure at 3 and 4.5kGy irradiated samples.
Read More About Lupine Publishers Journal of Nanomedicine Please Click on Below Link: https://lupine-publishers-nano-science.blogspot.com/
No comments:
Post a Comment
Note: only a member of this blog may post a comment.