Lupine Publishers| Journal of Civil Engineering and its Architecture
Abstract
Agricultural is the largest employment sector of Bangladesh and most of the people earn their living from agricultural production. The magnitude of agricultural production varies spatially as agricultural production depends on topography, the fertility of the land, availability of river, availability of marketing place, input and so on. The intent of our study is to regionalize all the 64 districts of Bangladesh based on Boro production, fish production and the number of growth center and to analyze the impact of it on rural development. To do so, the data are collected from the Bangladesh Bureau of Statistics (BBS), the composite index method was employed to analyze the data. The data reliability is checked through statistical parameters named level of skewness, kurtosis and standard error of the mean. Then acquired data is classified by using the mean standard deviation method, equal class interval method and the arithmetic mean method. Comparing the three histograms it is found that equal class interval method has more symmetrical shape, hence more normally distributed. Results show that most of the areas are moderately producing the agricultural product. The findings of this study can be used to find out the location which can be best suited for the agricultural industry.
Introduction
Since 2000, agriculture became a powerful driver for alleviating poverty in the rural economy of Bangladesh [1]. Rice and Jute are the primary crops. By utilizing the benefits of fertile soil and ample water supply, rice can be grown and harvested three times a year in many areas. It contributes 29% of gross domestic product and 63% people are engaged with agriculture. There have been several types of rice Aus, Amon, Boro etc. Among all these Boro crops contribute more. Fish is the second main food of Bangladesh. Bengalis cannot do much without rice and fish. Bangladesh is the 4th largest fish producing country with a total production of around 3.26 Million Tones. In 2012, this sector contributed 4.4% of GDP and 23% of total agricultural production. So, it is clear that the agriculture of Bangladesh largely depends on Boro production and fish production which largely contribute to rural development. Growth center is the core of the trade of these agricultural products. In Bangladesh, the growth center basically refers to the rural markets which have been developed through the provision of infrastructure. In Bangladesh, there is total 3003 growth center [2]. So, the number of growth center largely contributes in rural trade. But agricultural production and distribution through growth center vary in different part of the country due to locational advantage or disadvantage, climate condition, and water availability. So, given that view, we explore formal regions based on Boro production, Fish production, and availability growth center. Thus, the level of rural development in the different region of Bangladesh. Because this type of formal regionalization is necessary to analyze the district from which we can get better feedback in terms of the agricultural industry. Agricultural industry gets influenced by several factors like prices of commodities, the farmers provide and are also associated with products obtained as a result of farming. Availability of growth center helps farmers to get adequate prices of their product. Through the establishment of agricultural industry, proper technology and training can be provided to further enrich the agricultural sector of those particular districts. Given that view, this study tries to identify the difference in agricultural production in the different district throughout the country.
Literature Review
Region means a large tract of land; a country; a more or less defined portion of earth’s surface, as distinguished by certain natural features, climatic conditions, a special fauna, and flora or the like [3]. The process of the delineating region is called regionalization. Regionalization can also be defined as a means of arranging the number of points on the earth surface and to observe the uniformities and regularities of phenomena upon it and to establish definite theories, models, systems, and structure. Before the industrial revolution, the purpose of delineation of the region was to find out the homogeneity of phenomena. The formal region is a geographical area which is uniform or homogeneous in terms of selected criteria such as topography, climate, industrial or agricultural-type [4]. Regions are treated as an important source of competition in economic geography [5]. According to J Glasson described “A formal region is a geographical area which is uniform or homogeneous in terms of selected criteria such as topography, climate, industrial or agricultural-type’’.
Regional development to some extent depends on the impact of the growth center. A center that contributes directly to the basic needs of agricultural producers, both in respect of economic and social services are termed as a growth center [6]. In rural areas, growth tends to concentrate in a center and influence the economy of surrounding areas. Also, growth center plays a significant role to spread growth in surrounding areas [7]. Smith used factor analysis method to identify areas of economic distress [8]. In his study, he divides the North West into several economic health, sub-regions using multiple socio-economic criteria. Flittie also observed the socioeconomic homogeneity using factor analysis method in Rocky Mountain West. The study shows that, physical regions which may or may not follow political boundaries-vary from the Western Hemisphere to the Great Plains to a river basin or watershed or to a national forest. Social and economic regions are equally diversefrom ethnic areas through Nob Hill and city ghetto and from the Common Market through national tariff barriers to regional and local trend centers.
(Mohiuddin & Bhuiya, 2013) has conducted a research on formal regionalization of Bangladesh and analyzes the dependencies of one region to another [9]. The intent of the study was to find out lack of the low productive regions. The study has divided the whole country into four regions which will be helpful for taking policy for the agricultural development on the basis of their production level. Crop productivity index and Moran-I statistics have been used in this study. Because of lack of all crops, they use different types of potato, Rice, jute, wheat etc. they consider four classes in data analysis. In this study, they found out that the south-east part of the country is low productive because of hilly terrain and natural disaster-prone area.
Methodology
The composite weighted index method has been used in this study to delineate formal region. The data for Boro production, Fish production and the number of growth center is collected from BBS 2011. These three variables have a positive correlation between them. That’s why these three variables are chosen for this study (Table 1).
After that, analyzing the selected three variables. From there, Log10 is calculated for every variable and (W1, W2, and W3) find out by the ratio of the mean and standard deviation of these variables.
Then calculating the composite weight of three variable by the given formula,

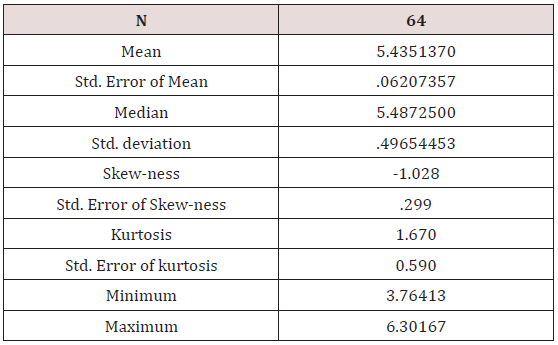
The composite weight of each district has been calculated by using this formula. The next step is to check out the reliability of W (Table 2). The table shows that the mean is 5.435 and std. the error of the mean is .06. Skew-ness can be quantified to define the extent to which a distribution differs from a normal distribution. Here, skewness is -1.028 which refers negatively skewed. That means the amount of higher value is higher and smaller value are fewer and the mean is less than the mode. Here, kurtosis is a measure of whether the data is heavy-tailed or light tail relative to a normal distribution. The value of kurtosis is 1.670, which refers data sets with low kurtosis tend to have light tails or lack of outliers. The next step is to determine the no of class by the formula (2^k = N). Where N=64 and no of class 6 is required. The 64 districts are divided into six classes based on the class interval method then, choose the best suits.
Equal Interval Method

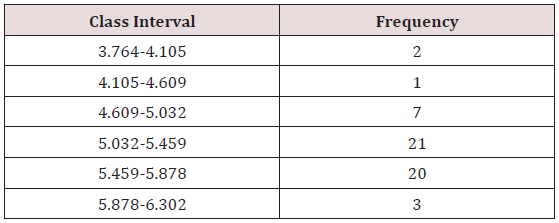
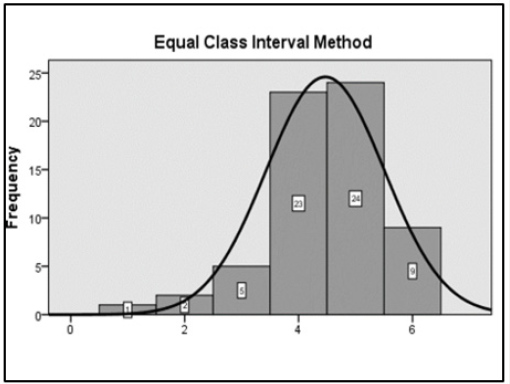
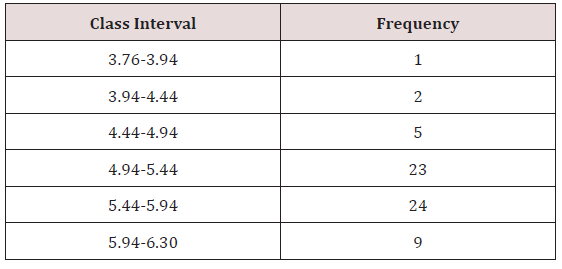
Where, Highest value = B, Lowest value= A, Number of class requirement=6 (Figure 1) and (Table 3).
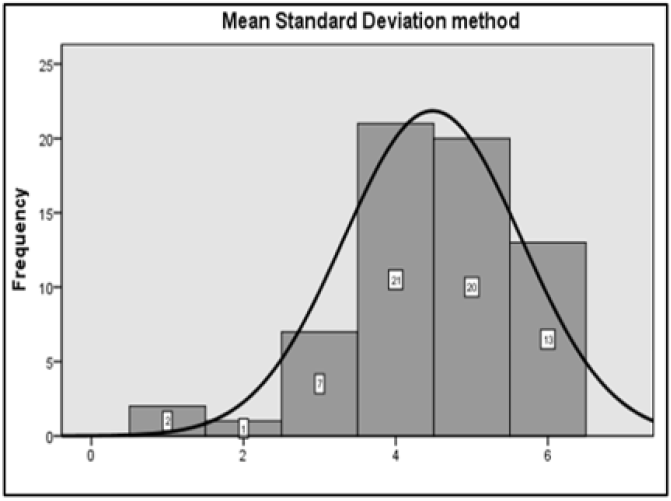
Mean SD Method: In this method using standard deviation and mean value in Figure 2. Here, mean is used as middle value and add 1SD, 2SD……Highest value and subtracting 1SD, 2SD……Lowest value (Figure 3) and (Table 4).
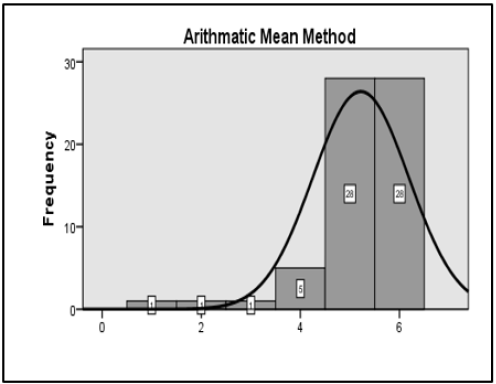
Arithmetic Method: A+X+2X…………...+NX=B
Where, A= lowest value, B=Highest value, X= class interval, K= No of Class
The class interval is calculated as,
[A-(A+X)], [(A+X)-(A+X+2X)]…………………………………
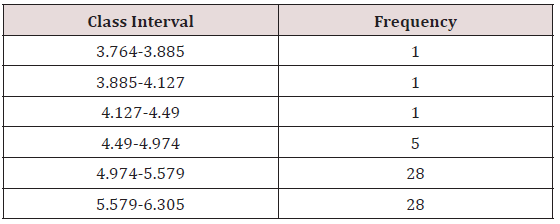
Comparing the three histograms equal class interval method has a more symmetrical shape (Figure 4 ) and (Table 5).
Data Interpretation and Results
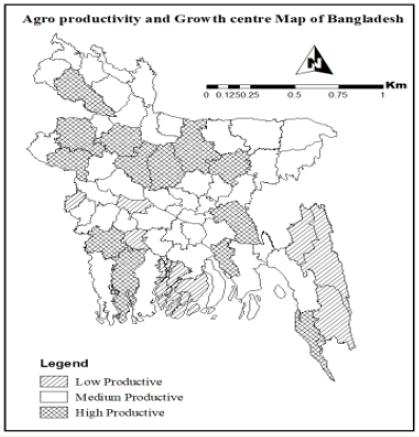
Total 64 districts of Bangladesh grouped into six categories on the basis of three factors (Boro production, fisheries production and a number of growth center). These six categories have been re-grouped into three categories; highly productive, moderately productive, and low productive regions (Figure 5 ) and ( Table 6).
Agriculturally Low Productive Region
Among 64 districts, 10 districts of Bangladesh show the lowest production of rice, fisheries production and capability of trading. There are several reasons that are why the regions show the lowest production. One of the main reason is the natural disasters (hurricane, typhoon, cyclone) etc. Due to the yearly natural disasters in Barguna, Patuakhali, and Jhalkhati, the productivity is very low than the other districts (Table 6). This natural disaster creates a negative impact on agriculture. Another reason is the hilly areas. Bandarban, Khagrachori, Rangamati are the hilly areas in Bangladesh. Area of this region is 13,295 sq. Km. the physical condition of this area consists of earthen and hills rocks, waterfalls, river valleys, and forests [10]. Biswas and his fellow author seek out 1, 52,436 ha of total cultivate land and single cropped is dominant in this region. They also explore that cropping intensity is only 140% and due to lack of irrigation facilities 67,191 ha area remains fallow. Comparing this three hilly region Bandarban is one of the most disadvantaged and vulnerable regions in terms of various development indicators (income, employment, poverty, health and water, environment and sanitation (WES), education, inter-community confidence, etc.). Here the main disaster risk is landslide (24.67%). People are facing this risk for several years. Besides this 44.67% flood, 18.67% cyclone and flash flood 10.66% [11]. Due to the probability of this type of disasters, people are often prevented from the cultivation of the hill slope. Therefore, hilly areas are not suitable for rice production. Furthermore, due to the lack of growth Centre, lack of infrastructure facilities, low investment rate, adverse geo-climate conditions and low levels of urbanization and industrialization in this area, these regions shows the lowest productivity.
Read More About Lupine Publishers Journal of Civil Engineering and its Architecture Please Click on Below Link: https://lupinepublishers-civilengineering.blogspot.com/




No comments:
Post a Comment
Note: only a member of this blog may post a comment.