Friday, 30 June 2023

Lupine Publishers | Electricity Generation using Fossil Fuel, Renewable and Nuclear Energy: A Review

 Lupine Publishers | Journal of Environmental & Soil Sciences


Abstract

Electricity makes our lives better, brighter, and cleaner. But before it is transmitted on high-voltage power lines and then distributed to our homes and businesses, it needs to be generated by a power plant. Electricity is vital to modern life. It powers our lights and appliances at home. It powers many industry processes. It is used to power trains and to charge electric vehicles. Globally, electricity use is rising rapidly as new major economies develop in giant countries in population. This need for electricity drives a growing demand for electricity generation, with thousands of new power plants needed across the world over the coming decades. The fundamentals of electricity generation haven’t changed much over time, but the associated technologies have radically changed over time and are constantly evolving. Politics also plays a large role and influences the types of fuels we use for electricity, and politics will continue to drive major changes in the future. Energy sources are either fossil fuels, nuclear, renewable energy. Electricity generation is a key contributor to global emissions of greenhouse gases (GHG), NOx and SO2 and their related environmental impact.

Keywords: Electricity; Electricity production; Fossil Fuel; Nuclear Power; Renewable energy

Abbreviations: AC: Alternating Current; CCGT: Combined Cycle Gas Turbines; CCS: Carbon dioxide Capture and Storage; CH4 : Methane; CO: Carbon Monoxide; CO2 : Carbon Dioxide; CSP: Concentrated Solar Power; GHG: Green House Gases; HVDC: High Voltage Direct Current; IGCC: Integrated Coal Gasification Combined Cycle; LCA: Life Cycle Assessment; LCI: Life Cycle Inventory; NH3 : Ammonia; N2 O: Nitrous Oxide; PV: Solar Photovoltaic; SO2 : Sulfur Dioxide; UF6 : Uranium Hexafluoride; UO2 :Uranium Dioxide

Introduction

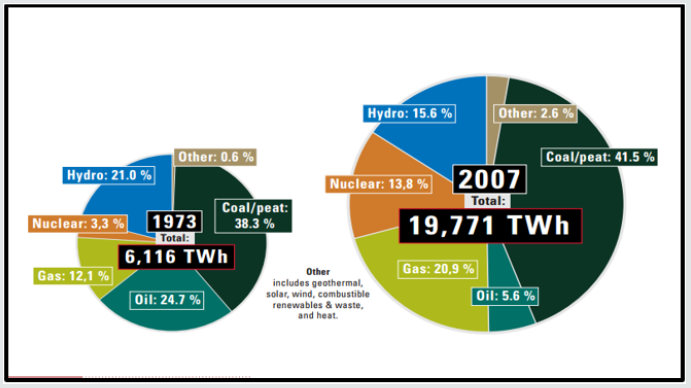
Electricity plays an important role, especially in developing economies because the efficient usage of different resources depends directly on the electricity. Almost all sectors, whether it is agriculture sector, industrial sector, or household, all depend directly on electricity [1]. But Electricity generation is a key contributor to global emissions of greenhouse gases (GHG), NOx and SO2 and their related environmental impact. There are a lot of case studies including the life cycle assessment (LCA) of electricity generation depending on hard coal, lignite, natural gas, oil, nuclear, biomass, hydroelectric, solar photovoltaic (PV) and wind was studied to know the ranges of emission data for GHG, NOx and SO2 related to individual technologies [2]. With the increase in energy demand and the expected shortage of the fossil fuel with time the need for sustainable resources increases. Hence, this is initially handled by using clean fuels [3], utilization of waste heat [4-8] and adopting different configurations [9-11], where resources and environment are conserved. Between 1990 and 2008, world energy consumption increased by 40%. nowadays 68% of the energy used in the world originates from fossil fuels, with electricity generation being responsible for 40% of global CO2 emissions [12]. Between 1973 and 2007 the worldwide electricity generation increased threefold as the world became more and more dependent on electricity to meet its energy needs as shown in Figure 1.

Currently, and in the past, the supply is almost entirely based on conventional fossil fuels: they amount to worldwide over 80 percent of the generated 19,771 TWh in 2007 [13-14]. Emissions of GHG, NOx and SO2 were selected depending on their contribution to many critical LCA influence categories and on their importance in decision making and strategic planning. in all the world, the energy sector contributes 19% and 56% of overall NOx and SO2 emissions [15], respectively, however contributions to GHG emissions amount to 40%. In addition to NH3 , emissions of NOx and SO2 are largely responsible for acidification. Because NH3 is primarily emitted from animal waste in agriculture [16], NOx and SO2 emissions provide a reasonable approximation for contributions to acidification due to electricity generation. The only technology available to mitigate GHG emissions from large-scale fossil fuel usage is carbon dioxide capture and storage (CCS). CCS is a process whereby CO2 shall be captured from gases that would otherwise be emitted via smokestacks into the atmosphere, and then be injected into deep geologic formations for permanent storage [17]. However, CCS already faces many challenges that are not only related to issues such as financing demonstration projects and integration of adequate infrastructures, but also to efficiency. For example, capturing and compressing CO2 would increase the fuel needs of a coal-fired power plant by 25 to 40 percent [18-20].

Figure 1: Worldwide Electricity Generation, Fuel Shares Comparison 1973 to 2007 [14].

lupinepublishers-openaccess-journal-environmental-soil-sciences

Electricity is a primary energy carrier, and the emission data that are related to electricity generation are utilized extensively for accounting and reporting purposes. Datasets and emission factors for electricity generation are utilized often when performing LCA and/or GHG accounting of products. However, even though the importance of data reliability and the large number of studies that value electricity generation, significant discrepancies can be found among LCI datasets for similar electricity technologies [21-23]. Policies to decrease climate change are driving the decarburization of electricity generation worldwide and may be tackled by a combination of technologies, from renewables like hydro, wind and solar, to fossil fuels with carbon capture and storage (CCS) and nuclear power [24-26]. For example, In the UK, 90% of electricity generation generated by thermoelectric power stations, whilst electricity sector abstractions make up approximately half of all water abstractions in England and Wales [27].

Figure 2: The UK Electricity Sector in 2010.

lupinepublishers-openaccess-journal-environmental-soil-sciences

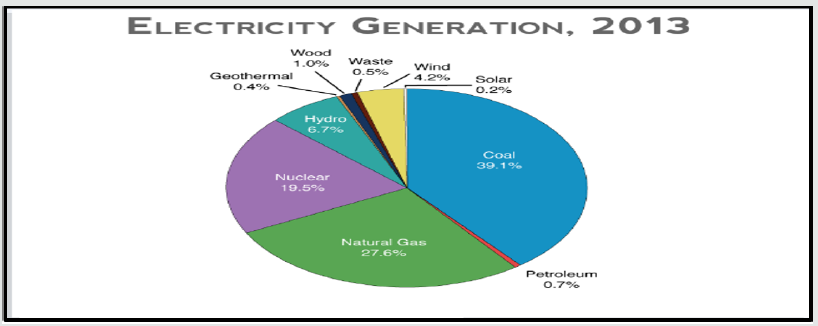
For UK the electricity mix is dominated by thermoelectric generation capacity which contributes to 90% of the roughly 380 TWh generated each year. Of electricity supplied to the grid, in 2010 conventional thermal contributed 124 TWh (34%), combined cycle gas turbines (CCGT) 168 TWh (46%), nuclear 56 TWh (15%) and the remaining 17 TWh (5%) was renewables as shown in Figure 2 [28-29]. Energy has become a crucial element for sustainable development and well-being of any country in modern era. Thermoelectric generation contributes to 80% of global electricity production. Cooling of thermoelectric plants is often achieved by water abstractions from the natural environment. Globally, 80% of electricity generation generated from thermoelectric power stations such as fossil fuels and nuclear, all of it requires cooling for efficient and safe operation [30]. Most of the power in the United States produced from thermal generation-using heat to create highpressure steam and drive turbines [31]. By this coal, nuclear, and most natural gas plants produce electricity. In 2013, coal, natural gas, and nuclear power accounted for a combined 86% of total electricity generation in the U.S. (39.1% coal, 27.4% natural gas, and 19.4% nuclear) as shown in Figure 3 [32]. There are 4 main types of cooling used by the electricity sector which use different amounts of water and energy as shown in Table 1 [33]. Along many decades almost all the consumed electricity in the world has been generated from three different forms of power plant - fossil, hydro and nuclear. Renewables currently generate a relatively small share of the world’s electricity, although that share is growing fast [34].

Figure 3: Electricity Generation in the U.S. for 2013.

lupinepublishers-openaccess-journal-environmental-soil-sciences

Table 1: Characteristics of different power generation cooling systems.

lupinepublishers-openaccess-journal-environmental-soil-sciences

Fossil Fuel Power Plants

Fossil fuels are an important part of global energy portfolio and play a significant role in current and future domestic energy security. A sustainable, low-carbon future will need to extract carbon dioxide from major coal and natural gas plants. However, carbon dioxide emissions from fossil fuel generation are usually very variable every day, with daily side variations between plants. We consider this change is critical to determining the appropriate carbon price as well as determining whether the CO2 power plant will capture [35-36]. Natural gas is playing an increasingly important role in the current and future world energy portfolio. For example, the ratio of the US’ electricity generated by natural gas increased from under 18% in 2002 to almost 25% in June 2012 [37], with increase of around 40% (coal use fell from 50% to 42% and non-hydro renewables rose from 2% to 5% in the same time period).More than 65% of the world’s electrical energy used today is generated by steam turbine generators burning fossil fuels as their source of energy and large scale fossil fueled plants provide most of the world’s base load generating capacity. Fossil fueled plants use either coal (60%), oil (10%) or gas (30%) in purpose designed combustion chambers to raise steam. These are all nonrenewable resources whose supply will ultimately be exhausted [38-40]. Figure 4 shows the fossil fuel powered steam turbine electricity generation.

Figure 4: The Fossil Fuel Powered Steam Turbine Electricity Generation.

lupinepublishers-openaccess-journal-environmental-soil-sciences

Fossil fuel power plants burn carbon fuels such coal, oil or gas to generate steam that drives large turbines that produce electricity. These plants can generate electricity reliably over long periods of time. However, by burning carbon fuels they produce large amounts carbon dioxide, which causes climate change. They can also produce other pollutants, such as sulfurous oxides, which cause acid rain [41,42]. Fossil fuel plants require huge quantities of coal, oil or gas. These fuels may need to be transported over long distances. The price of fuels can rise sharply at times of shortage, leading to unstable generation costs [43]. In fossil-fuel power plants, water is heated by burning fossil fuels in a furnace to produce steam which drives a turbine as shown in Figure 5. The turbine is attached to an electric generator that converts mechanical energy into electricity. During this process, about 60 percent of the energy input is “lost” irreversibly [44,45]. The losses occur within:

Figure 5: The Process of Electricity Generation [44].

lupinepublishers-openaccess-journal-environmental-soil-sciences

a. The burning process (flaring losses).

b. In the conversion of liquid water to steam.

c. In heat radiation.

d. The mechanical losses in the turbine and the generator and in cooling the steam after it has been used in the turbine.

Many Other Places

The electricity generated at the power plants is alternating current (AC)at relatively low voltage, because of insolation inside the generators. The electricity is then stepped up to high voltage using transformers, before being transmitted to substations located hundreds of kilometers away [46]. Finally, the electricity enters, again via transformers, the low voltage distribution system for its use in homes, offices and factories. As an unavoidable consequence, at least another 10 percent of the electricity vanishes in transmission losses. Moreover, many of today’s electric appliances are extremely inefficient, wasting much of the power they consume as heat. Approximately 95 percent of the energy consumed by an incandescent bulb is emitted as heat, only the remaining 5 percent are given off as light [47,48]. When the entire cycle of generating, transporting and using electricity is considered, the electricity is delivered to the user of the incandescent bulb with an overall efficiency of just 2 percent.

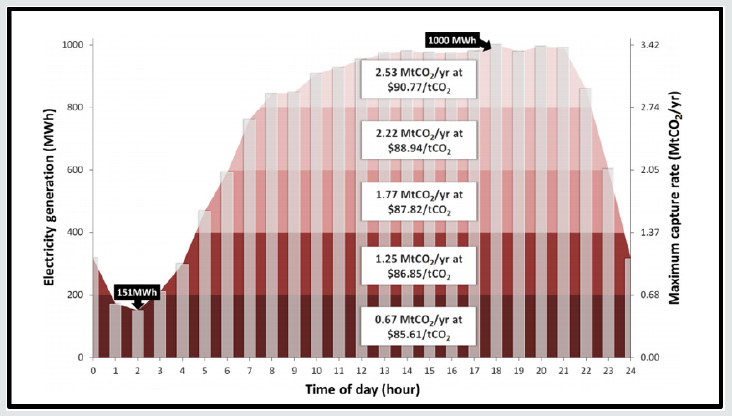
All these losses are simply accepted because the user, be it industry or households, are paying all the losses with their utility bills [49]. If the consumers were to be shown that they are not only paying the kWh logged by their meter, but in fact the fuel which is delivered into the power plants, they might start thinking about their energy-consuming behavior [50]. Coal-fired power plants are also by far the largest source of the carbon dioxide (CO2 ) and other global-warming pollutants such as methane (CH4 ) and nitrous oxide (N2 O). The efficiency of fossil fired power plants range from 30 to 38 percent depending on the age of the plant and the technologies used [51,52]. Electricity generation from natural gas power plants changes depending on an hourly basis. Usually this is because it is easy to ramp generation up and down and send natural gas power at short notice for changing demand throughout the day unlike, say, nuclear power that tends to fulfill steady base load requirements. Figure 6 shows electricity generation (columns, primary y-axis) and capturable CO2 (solid areas, secondary y-axis) over a 24 h period for the average (median) natural gas power plant peaking at 1000 MW h [53,54].

Figure 6: Electricity generation (columns, primary y-axis) and capturable CO2 (solid areas, secondary y-axis) over a 24 h period for the average (median) natural gas power plant peaking at 1000 MW h [53].
lupinepublishers-openaccess-journal-environmental-soil-sciences

New technologies like the (ultra-) supercritical pulverized coal combustion or the process of integrated coal gasification combined cycle (IGCC) can raise the efficiency for electricity generation to 45 percent and to more than 50 percent respectively. However, the environmental damage remains the same, inducing further even unknown changes in the global climate system [55]. Fossil fuel power will continue to play an important role in local energy policy. This will be driven by relatively low-cost and abundant gas supply and demand for a clean, reliable fuel that can respond quickly to changes in the electric grid. In addition to increased use, renewable energy integration will require natural gas to generate electricity to balance fluctuating supply, increasing gas trend to be used in an uneven and peaking fashion [56].

Nuclear Power Plants

The future of nuclear power will depend on whether it can meet several objectives simultaneously economics, operating safety, proliferation safeguards and effective solutions to waste disposal. Nuclear power plants use the heat produced by nuclear fission to generate steam that drives turbines, like what happens in fossil fuel plants. However, no greenhouse gases are produced in this fission process, and only small amounts of greenhouse gases are produced across the whole fuel cycle. Nuclear power plants can run for many months without interruption, providing reliable and predictable supplies of electricity [57-60]. Some consider nuclear power plants to be a “clean” electricity source, since the plants themselves do not directly emit CO2 and other GHGs. Nevertheless, the operation of nuclear power plants results in the immense environmental impacts which are displayed in Figure 7. After a cost intensive exploration process, uranium ore is recovered from the earth’s crust under quite difficult conditions [61]. Nuclear power generation is an effective GHG mitigation option, especially by way of investments to extend the lifetime of existing plants. Whether or not building more nuclear power plants will be accepted depending on new designs becoming economically competitive, and on the industry’s ability to restore public confidence in its safe use [62].

Figure 7: Electricity from Nuclear Energy

lupinepublishers-openaccess-journal-environmental-soil-sciences

It must be extracted from the mined ore using strong acids and bases, and then be converted into either uranium dioxide (UO2 ) for heavy water reactors or gaseous uranium hexafluoride (UF6 ) for light water reactors. Most reactors require uranium fuel to have a U-235 (an isotope of uranium) content of 3 to 5 percent. For this step, large amounts of electricity, mostly provided by fossil fuel plants, are needed to increase the actual concentration of 0.7 percent to 3 to 5 percent [63]. Afterwards, the uranium is manufactured into fuel pellets by pressing powdered UO2 or UF6 into cylindrical shapes and baking them at high temperatures, usually between 1,600 and 1,700⁰C. Finally, energy is released in a reactor by controlled nuclear fission reactions just to:

a. boil water.

b. produce steam.

c. drive a turbine that generates electricity.

This process alone has an efficiency of only 35 percent [64]. For steam production and for cooling, approximately 2.5 times more water is needed for nuclear than is required for fossil fuel plants. This is the reason why nuclear power plants are located at rivers or lakes. After the nuclear fuel is consumed in the reaction process, it is removed from the reactor and stored on site in large water-filled pools for about five years. Later, the radioactive waste is transferred to underground caverns for medium-term storage [65]. Nuclear fuel can be used in a reactor for several years. The used fuel that remains after this time must be stored and then either recycled to make new fuel or carefully disposed of. However, because the amount of fuel used to generate electricity is so much less than that used in fossil fuel plants it is much more practical to do this with used nuclear fuel than with the wastes and emissions from fossil fuels [66].

At present, there are no safe disposal facilities in operation anywhere in the world which can accept radioactive waste for permanent storage. A radioactive waste disposal facility since the seventies, its storage has recently been found to be unstable. According to World Nuclear News, roughly 126,000 barrels filled with low-level radioactive waste including contaminated clothes, paper and equipment need to be brought to the surface for alternative storage [67-69]. A challenge involves approximately Euro 3.7 billion, and a rather gracious heritage for future generation(s). Can a process like this that poses health risks exceeding that of any other process of electricity generation be called “clean”? We always need to keep in mind that already a minor failure in a nuclear power plant can create severe consequences for all forms of life on earth [70].

Renewable Energy

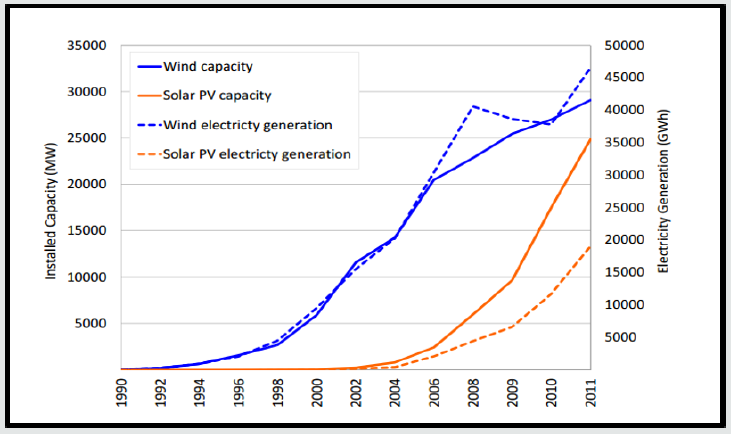
The negative influences of fossil fuels forced scientists to call attention to cleaner energy sources that are both friendly and renewable most suitable environment [71]. The fast depleting conventional energy sources and today’s continuously increasing energy demand in the context of environmental issues, have encouraged intensive research for new, more efficient, and green power plants with advanced technology. Since environmental protection concerns are increasing in the whole world today, both new energy and clean fuel technologies are being intensively pursued and investigated. Most of the renewable energy from wind, micro-hydro, tidal, geothermal, biomass, and solar are converted into electrical energy to be delivered either to the utility grid directly or isolated loads [72-75]. Natural energy flows vary from location to location and make the techno-economic performance of renewable energy conversion highly site specific. Intermittent sources such as wind, solar, tidal and wave energy, require backup if not grid connected, while high penetration into grids may eventually require storage and/or back-up to guarantee reliable power supply [76]. Renewable electricity has come to dominate the debate over the development of the European electricity market. Among European countries. Most wind turbines and solar panels are installed in Germany where renewable electricity has become even more important since the March 2011 decision regarding the nuclear phase-out [77]. In 2011, wind electricity accounted for 8 per cent of gross electricity production in Germany, whereas solar PV for 3 per cent. All renewable sources combined made up 20 per cent of gross electricity production in 2011 and are Germany’s second most important source of electricity generation after lignite [78]. Renewables such as wind, solar and small-scale hydro produce electricity with no greenhouse gas emissions at the point of generation and very low amounts of greenhouse gas emissions across their entire lifecycle [79]. Figure 8 shows the installed capacity and generated electricity in Germany.

Figure 8: Installed Capacity and Generated Electricity in Germany [80].

lupinepublishers-openaccess-journal-environmental-soil-sciences

Many renewables do not produce electricity predictably or consistently. Electricity generation from wind turbines varies with the wind speed. The output of solar panels is reliant on the strength of the sunshine, which depends on the time of day and the amount of cloud cover. This means that renewables have to be backed up by other forms of electricity generation, often fossil fuel generation with their resultant greenhouse gas emissions [81-83]. System and market operators in the world face two main challenges as more renewable power generation is added:

a. Electricity generated by wind turbines and photovoltaic panels is intermittent and hardly adjustable to electricity demand. Therefore, variable electricity generation is not a perfect substitute for conventional energy sources.

a. World’s renewable energy policy grants priority dispatch and fixed feed-in tariffs for renewable electricity generation. Renewable electricity can be fed into the grid whenever it is produced, regardless of energy demand, and in-feed can be switched off only if grid stability is at risk [84-85].

b. The cost of electricity generation from many renewables tends to be higher than other forms of generation. Often requiring subsidies to compete with other forms of generation, although these costs are coming down.

Wind

The global market for renewable energy sources including wind energy is growing rapidly, especially during the last two decades. The turbine has a power source fuel-free and does not cause any inexhaustible amount of pollution during the production of electricity. In addition, it can produce wind turbine energy close to load centers eliminated a transmission loss in the lines in rural and urban landscapes [86]. Wind energy is the most efficient renewable energy source for electricity generation in modern power systems. In the past decades, wind power has experienced a rapid growth worldwide. Wind power can supply up to 20% of the electricity consumption in many countries. Wind power brings many more uncertainties than conventional generation. Accurate and reliable wind power forecasting becomes extremely important to optimize the operation cost and improve the reliability of the power system with increased wind penetration [87].

While it is true that renewable energy sources are environmentally friendly, or “green”, one has also to consider their feedstock. Solar, wind, hydro and geothermal energies are “free” at first glance, although they require huge land-use investments with environmental unfriendly footprints especially biomass [88]. It is also obvious that electricity from renewable energies has considerable disadvantages in the way they are deployed today. First, and foremost, they are dependent on certain conditions (availability of wind, water and sunshine) [89]. Due to their intermitted nature, this deployment method is overstraining the grid, which is additionally rather inefficient. This fact is used by the grid operators as an argument to ask for governmental help to not only improve the grid, but to make it “smart”. At the end of 2008, the worldwide nameplate capacity of wind-powered generators added up to 121 GW, a mere of 1.5 percent of the world’s electricity usage. But the rapid growth continues, with China doubling its wind power capacity for the fifth consecutive year since 2004 [90-91].

In 2016, wind turbines in the United States were the source of nearly 6% of total U.S. utility-scale electricity generation. The amount of electricity generated from wind has grown significantly since 2000. Electricity generation from wind in the United States increased from about 6 billion (kWh) in 2000 to about 226 billion kWh in 2016. This turns out to be a big problem for the gridoperating utilities, because electricity must be used as soon as it is produced. But how easily can you forecast when and where the wind will blow? You can’t simply start a wind mill up when you need it most [92]. Thus, at least as the electricity grids are operated today, the intermittency of wind always requires backup systems with an equal amount of dispatch able generation capacity. Unfortunately, now these back-up systems are mostly conventional power plants that do not have short run-up times [93].

In addition to the unpredictability of wind, wind farms usually need high investments to be built, and are also very expensive to properly maintain. At least 20 percent of the windmills are shut off for maintenance or repairs. What is even worse, they are often taken off the grid, because their electricity is not needed at that given moment. What a system, what a waste of resources. There are no commercially viable ways to store wind energy at this time, other than pumping up water electrically in water reservoirs, but this only makes sense when wind farm and water reservoir are close to each other [94,95].

Solar

The various forms of solar energy, solar heat, solar photovoltaic, solar thermal electricity, and solar fuels offer a clean, climatefriendly, very abundant and in-exhaustive energy resource to mankind. Solar power is the conversion of sunlight into electricity, either directly using photovoltaic (PV), or indirectly using concentrated solar power (CSP) [96]. The amount of energy that comes from the sun is phenomenal: If we could somehow gather all the energy that reaches the earth on one day and store it, it would supply the energy needs of the whole world for almost 30 years [97]. Moreover, solar radiation is the sole source for fossil or renewable energy that we use today. Electricity from sunlight can be generated directly using photovoltaic, solar cells, or indirectly as with concentrating solar power. Photovoltaic systems and some other renewable energy systems are, therefore, an excellent choice in remote areas for low to medium power levels, because of easy scaling of the input power source [98,99].

Consider the interesting aspect: PV solar cells convert the sun’s radiation into DC power on which most of our appliances actually run. But this power is converted into AC power by inverters and fed into the inefficient grid, only to be inverted again to DC [100]. The efficiency of energy conversion depends mainly on the PV panels that generate power. The practical systems have low overall efficiency. This is the result of the cascaded product of several efficiencies, as the energy is converted from the sun through the PV array, the regulators, the battery, cabling and through an inverter to supply the ac load [101,102]. At this point, the most cost-effective and efficient technology for converting solar power into electricity are huge solar-thermal power plants (Figure 9). Here, sunlight is gathered by a large solar-collecting field with parabolic mirrors, so called troughs [103]. These collectors track the sun over the course of the day and concentrate the sunlight onto absorber pipes where the radiation is converted into heat. A heat transfer fluid which is circulating through the pipes is heated up to temperatures of almost 400o C [104].

Figure 9: Scheme of a Solar Thermal Power Plant (STPP).

lupinepublishers-openaccess-journal-environmental-soil-sciences

The heat is used to generate steam with which electricity is then produced by conventional steam turbines. The process water is then cooled and returned to the cycle. The surplus heat could be used for heating, desalination, cooling, air conditioning, and other applications, but in most cases, it is currently rejected to the atmosphere. Solar-thermal power plants have been in commercial use for several decades since (1982). Thermal molten salt storage enables electricity production even during the night, or on cloudy days. The storage time, however, is calculated to be seven hours [105]. Water is mainly used for cooling the steam circuit, i.e. from the vaporization of water in the cooling towers. So, the plant operators not only have to capture the power of the sun, but also need immense amounts of water for cooling of the heat transfer media. As most solar power plants today is located in deserts, this physical necessity may be an obstacle to development on the long run [106].

Biomass Gasification

Gasification is a thermochemical partial oxidation process in which carbonaceous substances (biomass, coal, and plastics) are converted into gas in the presence of a gasifying agent (air, steam, oxygen, CO2 or a mixture of these). The gas generated, commonly referred to as syngas (synthesis gas), consists mainly of H2 , CO, CO2 , N2 , small particles of char (solid carbonaceous residue), ashes, tars and oils [107,108]. Gasification technology has been investigated to effectively and economically convert low value and highly distributed solid biomass to a uniform gaseous mixture mainly including hydrogen (H2 ), carbon monoxide (CO), methane (CH4 ) and carbon dioxide (CO2 ) [109]. The main target from biomass gasification process is the best possible conversion of solid biomass fuels into a high calorific product gas. Thereby, biomass reacts with air, oxygen, steam or CO2 , which provide oxygen for the process. Due to the thermal cracking and the partial oxidation a product gas is formed. The composition of the product gas depends on the biomass fuel, the reaction conditions and the fumigator and consists of different concentrations of hydrogen (H2 ), carbon monoxide (CO), steam (H2 O) and methane (CH4 ). In case of air the product gas includes nitrogen (N2 ) as well. Char coal, ash with varying carbon contents and condensable low molecular hydrocarbons are produced besides the product gas.

The char coal and the hydrocarbons (summarized as tar) are the products of an incomplete gasification [110]. Biomass is any material which once was living, and which can be utilized for energy production. The use of biomass for energy production is on rise worldwide [111]. Biomass like forest, agricultural and organic processing residues can be converted to commercial products by either biological or thermochemical processes [112,113]:

a. Biological conversion of low-value lignocellulosic biomass is facing challenges in low economy and efficiency till now [114].

b. Combustion, pyrolysis and gasification are three main thermochemical conversion methods. Biomass is traditionally burnt to supply heat and power in the process industry. The net efficiency for electricity generation from biomass combustion is usually very low, ranging from 20% to 40% [115]. Gasification provides a competitive way to convert diverse, highly distributed and low-value lignocellulosic biomass to syngas for combined heat and power generation, synthesis of liquid fuels and production of hydrogen (H2) [116-119]. But gasification is a complicated technology that’s not flexible, less competitive than others, and till now not mature so it’s exposed to certain risks plus It is not a perfect alternative for generating electricity [120].

The reasons of that:

a. It is complicated to choose the right gasifier for a given plant size, and one that is suitable for the biomass to be used.

b. There is a very wide range of designs and set-ups, many of which are still at the research stage, and biomass does not have the same steady behavior as fossil fuels.

c. Plant operation is more complex than with combustion, and it is sensitive to numerous parameters, which means that it may incur unwanted operating instabilities. Furthermore, a plant’s operating regime depends on variables that cannot always be controlled, mainly the uniformity and availability of the biomass [121-123].

Conclusion

The usage of alternating current (AC) was mainly used because AC was, at least with the technology of that time, easier to transform up to high voltage and down again. This was done in order to reduce the energy losses during transportation, especially over long distances. The latest trend is to implement high voltage direct current long distance lines (HVDC). Some of them are in daily use in India, China and Europe already, and are planned for the DESERTEC project between North Africa and Europe in 2015 or later. Daily energy losses take place in external chargers for batteries in cellular phones, laptops, cameras, navigation devices, game consoles, and electronic weather stations. In the year 2009, for example, more than 1.21 billion new mobile phones were sold worldwide and ALL of them were equipped with a new AC/DC converter to charge their batteries.

That means there are 1.21 billion of them around, only from the new cellular phones, sold in only one year. Existing AC/DC chargers are wasting our limited resources because they have to rely on an old-fashioned process of electricity production and transformation, and, in most cases also rely on an antique grid network. It seems not to be of much interest how much AC power these devices ultimate use. In fact, most of them will only deliver efficiencies in the 80 to 85 percent range. A better alternative may be to substitute DC power as a replacement for conventional AC power and thus skipping the whole power conversion process. It seems that as long as electricity remains cheap, the inefficiency of every AC/DC converter can be easily afforded. Fuel cells powered by hydrogen have the potential to do this job and thus end our reliance on global oil companies and utilities.

Acknowledgement

The author likes to acknowledge the help offered from Engineer Duaa MH Kharouf for the help during the work.

Read More About Lupine Publishers Journal of Environmental and Soil Sciences Please Click on Below Link:
https://lupine-environmental-soil-sciences.blogspot.com/

Thursday, 29 June 2023

Lupine Publishers | Bitter Gourd Relish and Blood Group Relationship

 Lupine Publishers | Journal of Research & Reviews Health Care


Abstract

The topic of our project was to explore the “Bitter gourd relish and blood group relationship.” The number of subjects to examine were 176. The process we adopted before examining the subjects was acquiring their consent before the collection of related information. We checked blood group of the subjects by using lancing device along with anti-sera A, B and D solutions and then noted the precipitate formation. In the meanwhile we asked whether they liked bitter gourd as a dish or not. We gathered the basic information about bitter gourd composition and its merits for the subjects that used it as a dish or juice. Then we organized the random data presented in a table and observed the relationship of bitter gourd liking to blood type and made a comparative analysis of blood groups. At the end, we defined the results.

Keywords:Bitter Gourd; Blood Grouping; Bitter Melon; Karela; Fondness; Relish; Liking

Introduction

Human beings has a fluid inside their bodies known as blood. Blood comprises leukocytes, erythrocytes, and platelets. ABO Blood Group system was first discovered in 1901 by Karl Landsteiner. The classification of human blood group is based on antigens and antibodies present in blood. Antibodies are the natural immune system proteins that act as a defense mechanism. ABO system is encoded by gene I located on chromosome 9. This gene is polymorphic having three alleles represented as Iᵃ, Iᵇ and i. If a subject has blood group A, then it means it has antigen A present on its red blood cells and antibody B is present. So, genotype IᵃIᵃ or Iᵃi, will produce phenotype A. Subject having genotype IᵇIᵇ or Iᵇi will produce phenotype B. Subject having AB blood, no antibody is present, and genotype is IᵃIᵇ. If blood group is O, this subject has no antigens and both antibodies are present in the blood plasma. So, the homozygous recessive genotype ii produces the phenotype O. The universal donor is O blood group and can donate blood to group A and group B types. The universal recipient is AB group, means it can take blood from any donor like from group A, B and O [1]. There is another protein known as Rh protein or Rh factor present on erythrocytes. A subject is Rh positive when the Rh protein is present and Rh negative if Rh protein is absent. So, blood group of a subject may be A⁻, A⁺, B⁻, B⁺, AB⁻, AB⁺, O⁺ and O⁻ [2].

Bitter gourd a vegetable, also known as bitter melon, bitter squash, balsam pear, and simply as karela (in Urdu). The scientific name of bitter gourd is Momordica chianti. Bitter gourd a vine of the family Cucurbitaceae, grown mostly in Asia and Africa [3]. Bitter gourd juice consists of nutrients like iron, magnesium, potassium and vitamin C. It is rich in dietary fiber. It contains two- fold of calcium of spinach, potassium of banana and beta-carotene. The compound momordicines and increased levels of calcium is the cause of characteristic bitterness of bitter gourd. Bitter gourd contains diabetic control compounds naturally. Also, bitter squash juice is anti-inflammatory and lowers bad cholesterol levels in human body and acid lessons the risk of heart of stroke and heart attack due to enrichment in iron and folic acid. It maintains the blood pressure of body. Anti-oxidants along with vitamins like C and A in bitter gourd retards premature skin ageing and minimizes wrinkles. Momordica charantia, a compound strengthens the anti-oxidant activity of liver enzyme and provides defense against liver failure and removes intoxication caused by frequent alcohol uptakes that settled down in liver. It also boosts functioning of bladder. Bitter melon contains less amount of carbohydrates, calories and fat, that play role in removal of already present fat cells and inhibits the generation of new fat cells. Anti-oxidants in bitter melon reduces the risk of cervical, prostate and breast cancer in humans. Bitter gourd decreases the sight-related problems such as cataract as being rich in vitamin A and beta-carotene and strengthens eyesight [4]. Objective of present study was correlating blood groupings with bitter gourd.

Materials and Method

Blood Grouping

The materials required to test blood group were the required quantity of blood from specific groups (three drops) was taken for testing with a prick of sterilized needle (blood lancet) on a fingertip (any), slides and solutions of anti-sera A (antigen A with B antibody), anti-sera B (contains antigens B with A antibodies) and anti-sera D (Rh +ve factor). Anti-sera means the solution contains opposite antibody with respect to antigen. First, label the slide with A, B, and D so that anti-sera drops can be identified. Then placed three drops of blood on the slide. Afterwards, add a or few drop of anti- sera A, anti-sera B, anti-sera D according to the labeling on the slide. In the end, leave the slide for two to three minutes or mix each drop with needle wire and observe the changes in drop solution. Precipitate formation of blood drop shows that blood group presence in subject. Precipitate formation in anti-sera D, meant positive. Precipitate formation in any anti-sera A, B and D, then A⁺, B⁺ blood group. If precipitates were formed in all three anti-sera A, B and D, then blood group was AB⁺. If precipitates were formed in only anti-sera D blood group was O⁺ and no precipitate in any anti-sera, meant that blood group was O⁻. If precipitates were formed in either anti-sera A or B, or both then blood group was A⁻, B⁻ and AB⁻ respectively.

Project Designing

The topic we selected was bitter gourd relish. We asked subjects whether they like bitter gourd as a dish or not because of its bitter taste. Subjects also gave their consent to check their blood group. Then we organized the random data and did the statistical analysis. The subjects which we chose for our project, were the 176 students of Bahauddin Zakariya University, Multan Pakistan.

Statistical analysis

We did Statistical analysis by using MS Excel

Results and Dicussion

Studies based on questionnaire have given an important advancement in science [5-12]. No linkage or research work was found that correlated my topic (Table 1).

Table 1:

Lupinepublishers-openaccess-Research-Reviews

Conclusion

The present study concluded in figure (A) that bitter gourd fondness was shown mostly by B⁺ subjects. B⁺ blood group subjects liked the bitter melon most. The frequent occurrence of similar blood group of my subjects were B⁺. All the subjects of our research having O⁻ blood group were females and they all liked the bitter melon. The likeliness percentage of subjects with blood group O⁺ and B⁺ were same, (11%). All blood group AB⁻ and B⁻ subjects liked bitter squash. Out of 46 male subjects, bitter melon was liked by 30 males. Total 92 female subjects liked the taste of bitter squash as a dish out of 130.

Read More About Lupine Publishers Journal of Research and Reviews Health Care Please Click on Below Link:
https://lupine-publishers-research.blogspot.com/

Wednesday, 28 June 2023

Lupine Publishers | Effectiveness, Safety and Therapeutic Adherence of Weekly Subcutaneous Semaglutide for Weight Management in Real Practice: An Observational Study

 Lupine Publishers | Archives of Diabetes & Obesity


Abstract

Aims: To evaluate in a real practice setting effectiveness, safety and adherence to weekly subcutaneous semaglutide for weight reduction, along with diet and lifestyle modifications in obese/overweighted patients attending an Obesity Unit.
Materials and Methods: In a retrospective study, 367 patients (mean age 50.25 years, 78.36% female, mean baseline body mass index 32.39 kg/m2) were followed for 10.7 months (median) after initiation of semaglutide. Up to 24.25% of patients were previously on GLP-1 analogue therapy (mostly liraglutide) and 36.26% used background oral medication for weight loss.
Results: At final office visit patients averaged a weight loss of 7.97±3.42 kg (9.13±3.86% baseline body weight) and 88.07% and 30.27% of patients had achieved a≥5% and ≥10% weight loss, respectively, as compared to baseline body weight. Up to 61.19% and 33.46% of patients maintained 0.5 and 1.0 mg dose, respectively and 86.18% of patients persisted on sc semaglutide by last office visit. Nausea and abdominal pain were reported by 12.53% of patients with no severe adverse events. Background antiobesity medication did not affect weight loss and patients on previous GLP-1 analogue therapy lost 1.43 kg less than naïve patients (p<0.001).
Conclusions: Out-of-label weekly administration of sc semaglutide 0.5 to 1.0 mg resulted in a significant, safe and affordable weight loss in a pragmatic setting without reimbursement of treatment cost. Magnitude of weight loss and safety profile was in line with preliminary data from a phase 2 trial, although this will need to be confirmed by an ongoing phase 3 development programme.

Keywords: Observational Study; Obesity Therapy; GLP-1 Analogue; Semaglutide; Appetite Control Antiobesity Drug

Introduction

Obesity has become a major public health issue worldwide, and its prevalence is growing so uncontrolled that over the past 20 years, the rate of obesity has risen three-fold and is affecting more than 30% of population in some European countries [1]. Major health institutions recognize now obesity as a complex, multifactorial condition [2,3], associated to a number of comorbidities, including metabolic, mechanical and mental health complications that significantly impact both quality of life [4,5] and life expectancy of affected population [6]. On the other side, treatment cost of complications derived from obesity represents a formidable burden for health public systems in many countries [7,8]. Conversely, a weight loss of 5-10% of body mass reduces obesity-related complications and improves quality of life [9,10], although this goal is difficult to achieve and maintain only with diet and lifestyle interventions [11,12]. Few safe and effective drugs are currently available for the treatment of obesity. Among them, glucagon-like peptide 1 (GLP-1) receptor agonists have proven a combined effect on glucose metabolism and reduction in body weight associated to favourable outcomes in patients with type 2 Diabetes and coexisting obesity, including reduction of cardiovascular events for some of them [13-15].
Liraglutide, a once daily administered GLP-1 analogue was initially approved for treatment of patients with type 2 Diabetes at a dose of 1.2 to 1.8 mg, and subsequently gained approval for weight reduction in many countries, at a maximum daily dose of 3.0 mg, in combination with diet and lifestyle modifications [16-17]. Subcutaneous (sc) semaglutide, a longer-acting GLP-1 analogue was approved in Spain in 2019 for treatment of type 2 Diabetes with a weekly administration of 0.5 or 1.0 mg, and conditions for reimbursement by Spanish public health system include coexistence of obesity. Both drugs have proven clinically significant weight reductions in obese patients without type 2 Diabetes and a clinical development program is currently undergoing aiming to gain indication for sc semaglutide in weight management [18-19]. In this observational retrospective study, performed under real practice conditions, we aimed to evaluate effectiveness, safety and adherence to weekly administration of sc semaglutide in a nonreimbursed setting in patients with obesity or overweight attending an Obesity Unit in a private institution in Mallorca (Spain), along with dietary and lifestyle recommendations.

Patients and Methods

In this retrospective study, patients attending our Obesity Unit who started on sc semaglutide since May 2019 were consecutively invited to take part in the study and after giving written informed consent, were included for analysis. Inclusion criteria were patients 18-year-old or older, with a body mass index (BMI) >25 kg/m2, and at least one follow-up office visit after initiation of sc semaglutide. A total of four follow-up visits after baseline visit were included in this study, to ensure for at least a 6-month follow-up period. Patients with a previous diagnosis of type 2 Diabetes Mellitus were excluded from participation in this study. The study protocol was approved by the reference Hospital Ethics Committee (University Hospital Son Espases).
A total of 372 patients were consecutively included in the study. All patients were prescribed sc semaglutide with an out-of-label indication for weight reduction, as part of a structured program for the management of overweight and/or obesity that included diet and exercise counselling. A number of patients had been previously or currently prescribed drugs with an approved indication for weight management (GLP-1 analogue liraglutide and lipase inhibitor orlistat) or a clinical indication for weight management yet out of label, as other GLP-1 analogues (dulaglutide, exenatide LAR), selective serotonin reuptake inhibitors (SSRI), and topiramate. Diet counselling included a structured quantitative dietary recommendation with an average 500 kcal/day reduction from calculated baseline metabolic rate. Standardized Harris-Benedict’s equations corrected for Lang’s daily activity coefficient were used to calculate baseline metabolic rate. In line with Spanish Health Authorities policy, sc semaglutide prescription for overweight or obesity management is not reimbursed, and all patients paid for this out-of-pocket prescription accordingly.
Height, weight, and BMI were recorded as baseline variables at initial visit. Also, concomitant use of drugs with a potential to reduce weight including topiramate, orlistat, SSRIs and current or previous use of other GLP-1 analogues in the last 6 months previous to index date was also registered. At initial visit, sc semaglutide was started at a dose of 0.25 mg once weekly according to label instructions, but subsequent dose titration was left to physician’s judgement based upon effectiveness and Gastrointestinal (GI) intolerance (namely, incidence of nausea, vomiting or abdominal pain). Patients in this unit are regularly followed-up with office visits every 4-12 weeks, and weight, current sc semaglutide dose, use of background medications for weight loss, incidence of adverse events and persistence on sc semaglutide were systematically recorded at each visit and included for analysis. Safety data included serious adverse events, incidence of GI intolerance and incidence of other adverse events.
Primary effectiveness outcome in this study was absolute and percentage weight loss from baseline after initiation of sc semaglutide until last follow-up visit. Secondary objectives included persistence on sc semaglutide and drug dose, evaluated at each follow-up visit, incidence of non-serious/serious adverse events and/or GI adverse events, proactively requested to patients, and change in background use of drugs for weight loss. Subgroup analysis evaluated influence of previous GLP-1 analogues therapy and background use of anti-obesity drugs in weight loss.

Statistical Analysis

Primary and secondary outcomes analysis was performed for patients attending the last office visit. Subgroup analysis for previous use of GLP-1 analogues and use of anti-obesity medication included all patients with at least one follow-up office visit (last observation carried forward). All data are expressed as mean ± Standard Deviation (SD) for continuous variables and as percentage for categorical variables. Normally distributed variables were compared using two-sided T-Student test and categorical variables were compared using Chi-square test. A p value <0.05 was assumed as statistically significant for all comparisons (Statplus statistical package 2016©, AnalystSoft, Walnut, CA).

Results

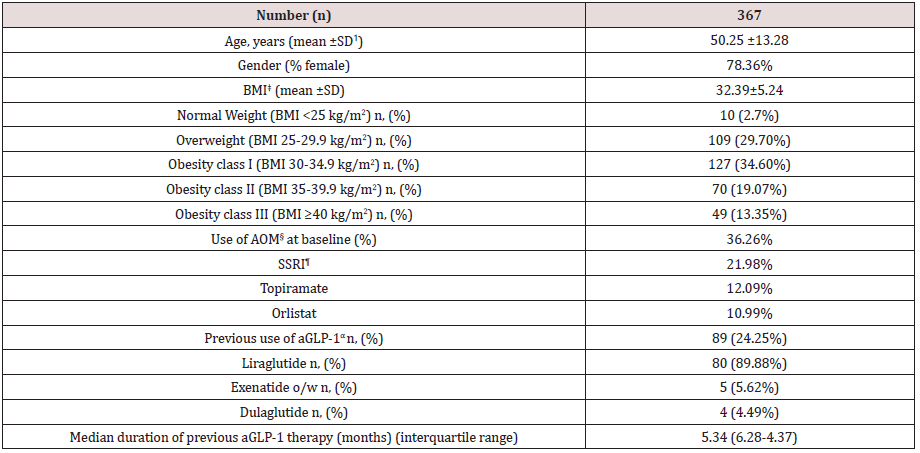
Table 1 shows baseline characteristics of patients included in this study. A total of 367 patients completed a first follow-up visit. On average, patients had a mean age of 50.25 years and a wide majority of them were females (78.36%). Mean BMI was 32.39±5.24 kg/ m2, with a balanced distribution among patients with overweight (29.7%), class I obesity (37.32%) class II and III obesity (together, 32.42%). Up to 36.26% patients were on previous pharmacological treatment for obesity, mostly SSRI agents, topiramate and orlistat, and up to 24.25% of this population initiated sc semaglutide switching from a previous GLP-1 analogue therapy, either currently in use or in the previous 6 months. In most cases (89.88%) previous GLP-1 analogue was liraglutide with an average daily dose of 1.48 mg. Median duration of previous aGLP-1 therapy was 5.34 months and mean (±SD) weight reduction achieved was 3.25 ±5.32 Kg (Table 2). Up to 32.01% of patients in this subgroup had achieved a ≥5% weight loss with previous aGLP-1 therapy.

Table 1: Baseline characteristics of patients.

lupinepublishers-openaccess-journal-diabetes-obesity

ꝉSD: Standard Deviation ‡BMI: Body Mass Index §AOM: Anti-obesity Medication ¶SSRI: Selective Serotonine Re-uptake Inhibitor αaGLP-1: Glucagon-like Peptide 1 against.

Table 2: Weight reduction throughout follow-up.

lupinepublishers-openaccess-journal-diabetes-obesity

ꝉSD: Standard Deviation §AOM: Anti-obesity Medication *p<0.05 vs. baseline (Chi-square test)

Weight Reduction

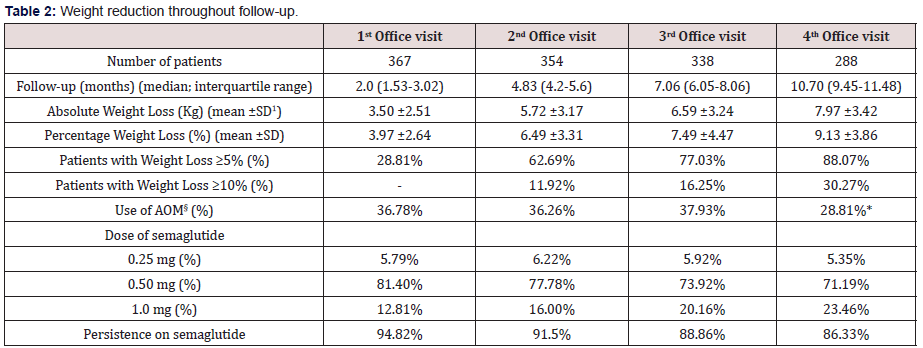
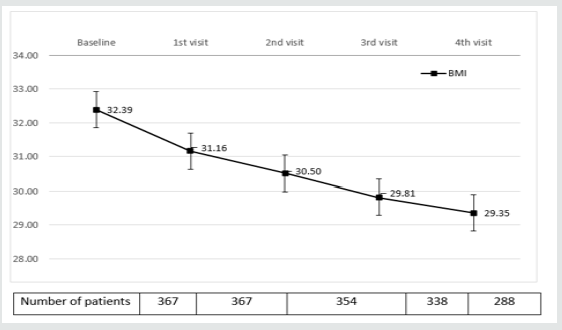
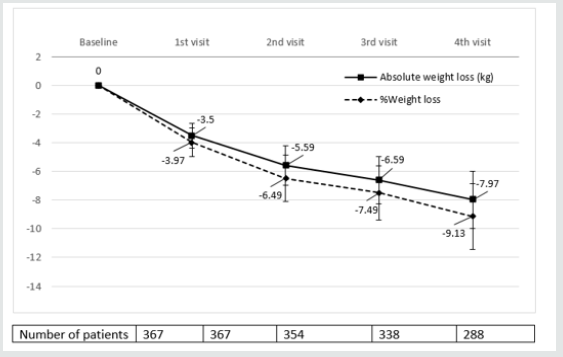
Table 3 and (Figures 1&2) show changes in BMI and body weight throughout consecutive office visits. After a median followup of 10.7 months up to 311 patients attending the last office visit, achieved a weight loss of 7.97±3.42 kg (9.13±3.86% of baseline body weight), and weight loss was achieved gradually in a timedependent fashion. By the end of study observation period, 88.07% and 30.27% of patients had achieved a ≥5% and ≥10% weight loss, respectively, as compared to baseline body weight.

Table 3: Weight reduction (LOCF)* according to previous use of GLP-1 analogues

lupinepublishers-openaccess-journal-diabetes-obesity

*LOCF: Last observation carried forward ꝉSD: Standard Deviation ‡BMI: Body Mass Index §AOM: Anti-obesity Medication

Figure 1: Evolution of BMIα after initiation of sc Semaglutide*. αBMI: Body mass index expressed in Kg/m2 *Expressed as median values. Bars represent ± standard deviation.

lupinepublishers-openaccess-journal-diabetes-obesity

Figure 2: Absolute and Percentage weight loss after initiation of sc semaglutide*. *Expressed as median values. Bars represent ± standard deviation.

lupinepublishers-openaccess-journal-diabetes-obesity

Tables 3 and 4 show changes in body weight according to previous use of GLP-1 analogue therapy and concomitant use of anti-obesity drugs, respectively. As stated before, up to 24.25% patients had switched to sc semaglutide from treatment with a GLP-1 analogue in the previous six months, mostly liraglutide. This subgroup of patients had achieved a previous weight reduction of 3.25 ±5.32 Kg after a median follow-up of 5.34 months (interquartile range, 4.12-6.57 months). Patients without previous use of a GLP-1 analogue, reduced significantly more weight than patients switching from a previous GLP-1 analogue to sc semaglutide, after a similar follow-up period (last observation carried forward); 6.51±2.79 kg (7.42% of baseline body weight) vs. 5.08±2.52 kg (5.58%), respectively (p<0.001). No differences were found for concomitant use of other anti-obesity medications and persistence on sc semaglutide was quite similar between both groups (Table 3). Conversely, sub analysis of weight reduction according to concomitant use of any anti-obesity medication did not yield any significant differences between both subgroups, neither in baseline BMI, nor in the magnitude of weight loss (last observation carried forward), or in the persistence on sc semaglutide (Table 4).

Table 4: Weight reduction (LOCF)* according to previous use of anti-obesity medication

lupinepublishers-openaccess-journal-diabetes-obesity

*LOCF: Last observation carried forward ꝉSD: Standard Deviation ‡BMI: Body Mass Index

Table 5: Safety and tolerability of sc semaglutide

lupinepublishers-openaccess-journal-diabetes-obesity

*GI (Gastrointestinal) intolerance included nausea, vomiting, abdominal pain or diarrhoea. ꝉOne patient admitted to hospital for urinary sepsis, one patient diagnosed of gross bowel cancer and one patient with myocardial infarction.

Therapeutic Persistence, Drug Dose and Background Anti-Obesity Medication Use

A total of 311 patients did attend the fourth and last office visit included in this study (84.74%). Persistence on sc semaglutide was high throughout consecutive office visits, with up to 268 patients out of 311 (86.18%) attending the last office visit being persistent to the drug. Up to 61.19% of patients remained on an initially prescribed semaglutide dose of 0.5 mg (after initial up titration) throughout consecutive office visits and 33.46% of patients were on the 1.0 mg dose by the last office visit. Concomitant use of other anti-obesity drugs remained unchanged throughout follow-up visits, and only in the last office visit a statistically significant 7.45% reduction in use of other agents was detected, mostly affecting orlistat use.

Safety and Tolerability

Regarding safety, few severe adverse events were reported throughout the follow-up period. A 66 year-old female was admitted to hospital due to urinary sepsis, a morbid obese 54 year-old male patient was diagnosed of gross bowel cancer requiring surgery and a 61 year-old patient suffered a non-lethal myocardial infarction. Additionally, a patient accidentally administered 5 consecutive daily doses of 0.25 mg of sc semaglutide and reported on nausea and vomiting during two days, but her condition improved after stopping the medication, and after two weeks, the patient resumed correctly weekly administration of sc semaglutide. A total of 66 patients (17.98%) complained on GI symptoms at initial follow-up visit, and this percentage did reduce significantly in subsequent follow-up visits (Table 5). Most of these patients complained of nausea and abdominal pain, that in some cases deserved transient interruption of medication or use of omeprazole, and in 14 patients led to definitive interruption of medication. Other reasons for treatment abandonment included lack of effectiveness or inability to afford for treatment costs, as reported by up to 19 patients. A patient with a baseline BMI of 42.3 kg/m2 was derived to bariatric surgery after 3 months of sc semaglutide 1.0 mg, with a weight loss of 5.3 kg from baseline.

Discussion

In this observational study we evaluated weight reduction associated to out-of-label use of sc semaglutide in a patient population with overweight or obesity as part of a pragmatic strategy for weight management including diet and physical activity counselling, and in selected cases prescription of drugs with a potential for weight loss. Patients included in this study represent an average profile of patients typically attending an obesity clinic in a private setting; middle aged patients with a high proportion of women and an average baseline BMI >30 kg/m2. Conversely, we found a lower percentage of patients with morbid obesity, as compared to Spanish public health system obesity units, were most patients are morbid obese and referred to for consideration of bariatric surgery [20]. A substantial proportion of patients included in this study were previously on pharmacological therapy for weight loss. In Spain, according to the 2016 official position statement by the Spanish Society for the Study of Obesity (SEEDO) [21], only lipase inhibitor orlistat, combination of opioid receptor antagonist/antidepressant naltrexone/bupropion and GLP-1 agonist liraglutide are approved drugs for medium and longterm obesity management in patients with a BMI >30 kg/m2 or >27 kg/m2 with major comorbidities, when a structured program including diet and lifestyle changes fails to promote a weight loss >5% after 3 to 6 months of follow-up. Conversely, the 2016 clinical practice guidelines for medical care of patients with obesity issued by the American Association of Clinical Endocrinologists and the American College of Endocrinology (AACE/ACE) [22] include lorcaserin, phentermine/topiramate ER (extended release) combination and SSRI therapy for selected patients as medications for chronic weight management.

Taking in mind the strong correlation between obesity and depressive mood disorder [23,24], it is not surprising that up to 21.98% of our patients were on SSRI (mostly fluoxetine) and in some cases with a coexisting indication for binge eating disorder or night eating syndrome. Eighty-nine patients in this study were using or had used in the past six months a GLP-1 analogue for weight reduction. Liraglutide was by far the most frequently used drug with an average daily dose of 1.48 mg which is lower than the approved dose of 3.0 mg od for weight reduction. Lack of reimbursement by Spanish public health system for liraglutide in obese subjects plays probably an important role in this low average dose used by patients, as treatment cost is directly dose-dependent. This issue has been acknowledged as a mayor limitation for treatment accessibility in our country, as stated by SEEDO guidelines [21]. Nevertheless, despite this low dose, patients on liraglutide achieved an average weight loss of 3.25 kg, accounting for >3% of baseline weight, after a median period of 5.34 months. Interestingly, the clinical development program for liraglutide LEAD (Liraglutide Effect and Action in Diabetes) included 4,456 patients with type 2 Diabetes with an average baseline BMI of 31.83 kg/m2, and age 55.87 years old. Weight loss associated to liraglutide 1.2 and 1.8 mg ranged 2.3 to 2.8 kg, respectively, after 26 to 52 weeks [25-30]. A similar baseline BMI in an older population was associated to a lower weight loss as compared to patients in our study. A possible explanation for this could be differences in age, as Mezquita et al., demonstrated in their liraglutide survey Diabetes Monitor [31]. In this real-world web-based survey, patients with type 2 Diabetes under 50 years old lost significantly more weight as compared to patients over 60 years old. Nevertheless, potential differences in the response to GLP-1 analogues in a population without Diabetes cannot be excluded, as clear differences in GLP-1 biology in patients with type 2 Diabetes as compared to normal individuals have been detected [33], namely reduction of GLP-1 secretion in response to oral intake and reduction of insulinotropic potency of GLP-1 [34,35].

Patients in our study gradually achieved a clinically significant weight loss of 7.97 kg by the last office visit, accounting for 9.13% of initial body weight, after a median follow-up of 10.7 months. By the end of the study, 88.07% and 30.27% of patients attending the last office visit included in the observation period had achieved a ≥5% and ≥10% weight loss, respectively. According to SEEDO guidelines [21], a sustained weight loss of 3-5% of body weight is associated to clinically significant improvements in metabolic factors like blood glucose and plasma lipid concentrations, and reduces risk for development of Diabetes, with higher weight loss having the potential to reduce long-term cardiovascular complications. Conversely, AACE/ACE guidelines for obesity management recommend a weight-loss goal of 5-10% (≥15% in some circumstances) to induce improvements of comorbidities associated to overweight or obesity [22].

Interestingly, most patients included in the study remained in the 0.5 mg ow dose, and only 33.46% of patients increased to the 1.0 mg ow dose at any office visit. Again, rather than GI intolerance or perceived effectiveness, we believe that economic constraints play a major role in the capability of patients to afford for higher doses of sc semaglutide. Throughout follow-up, use of other medications with a potential to reduce weight did not experience a substantial change except for last office visit, in which a 7.45% reduction was observed, affecting mostly to orlistat use. A reduction in meal size and fat content to avoid nausea, which is a common advice given to patients on GLP-1 analogues [17,36] could explain this observed reduction in orlistat use.

Persistence on sc semaglutide was high throughout study observation period, with more than 86.33% of patients using the drug by the last office visit after a median of 10.70 months. This persistence is comparable to that observed in a recent publication by our group [37] in patients with type 2 Diabetes in a real-world setting using sc semaglutide under approved indication for glucose management, with a full reimbursement by public health system. As opposed to patients in our study, with an out-of-pocket indication for weight loss, this high persistence is reflecting in our opinion, a high degree of patient’s perceived effectiveness of sc semaglutide for weight reduction. Patients’ satisfaction was not specifically measured in this study but indeed a perception of successful weight management was frequently referred by patients to treating physicians. Additionally, a low percentage of patients complained of GI intolerance, mostly nausea and abdominal pain, and in most cases, these symptoms were mild to moderate in intensity and transient, thus allowing for treatment continuation. Up to 19 patients attending office visits declared inability to afford for treatment cost, despite good tolerance and significant weight loss. Few serious adverse events were seen in this study, none of them with a potential direct relationship to the use of sc semaglutide. Furthermore, overall persistence on sc semaglutide in this study was higher than that reported for other GLP-1 analogues in patients with type 2 diabetes in other real-world setting studies [38,39].

In 2010, Astrup and colleagues published the results of a trial evaluating for the first time, efficacy and tolerability of liraglutide in adult obese patients without diabetes [16]. Patients randomized to 1.2 to 3.0 mg of liraglutide lost 4.8 to 7.2 kg compared with 2.8 kg with placebo after a 20-week follow-up period, setting the evidence for use of liraglutide in obesity. These results represent a deeper weight reduction in obese patients without diabetes, as compared to patients with type 2 diabetes in the LEAD program, and are closer to those observed in the subgroup of patients with a previous treatment with liraglutide in our observational study, despite differences in study design and observation period.

In 2018, O’Neil et al. published the results of a phase 2 trial evaluating efficacy and safety of daily sc semaglutide compared to liraglutide and placebo in 957 obese individuals with a baseline BMI of 39.3 kg/m2 and age 47 years-old [18]. Patients randomized to 0.05 to 0.4 mg of sc semaglutide od lost -6·0% (0·05 mg), -8·6% (0·1 mg), -11·6% (0·2 mg), -11·2% (0·3 mg), and -13·8% (0·4 mg) as compared to -7.8% of initial body weight in patients randomized to liraglutide 3.0 mg od, throughout 52 weeks of treatment. In this study, proportion of patients with ≥5% and ≥10% weight loss vs baseline body weight ranged 54-90% and 19-72%, respectively, across different sc semaglutide doses. In our study, calculated average weekly sc semaglutide dose was 0.59 mg, which results in an estimated daily dose of 0.084 mg, close to the 0.1 mg od dose arm in the study by O’Neil et al., and with similar results in terms of weight loss (9.13% vs 8.6%) and proportion of patients with ≥5% and ≥10% weight loss (88% and 30% vs 67% and 37%, respectively). All sc semaglutide doses were generally well tolerated, with no new safety concerns. The most common adverse events were dose-related gastrointestinal symptoms, primarily nausea, as seen previously with GLP-1 agonists in patients with type 2 Diabetes and rarely led to discontinuation of treatment. No patient complained on symptoms suggesting hypoglycaemic episodes, reassuring the safe use of the drug in a population with normal glucose metabolism. A comprehensive clinical development program, the Semaglutide Treatment Effect in People with Obesity (STEP) program is now undergoing, aiming to investigate the effect of sc semaglutide on weight loss, safety, and tolerability in adults with obesity or overweight. The program comprises 5 randomized clinical trials for which results will be available through 2020- 2021[19]. For all trials, the primary end point is change from baseline to end of treatment in body weight. Participants have a mean age of 46.2 to 55.3 years, are mostly female (mean 74.1%- 81.0%), and have a mean BMI of 35.7 to 38.5 kg/m2.

Our study represents the first published evidence for effectiveness and safety of sc semaglutide with a weekly administration in the management of overweight and obesity in adults without diabetes in a real-world setting. An important point in this study, derived from its observational nature in real practice conditions, is that patients paid for sc semaglutide treatment and still a high percentage of them remained persistent to the therapy. Treatment adherence is one of the major drivers for the gap between efficacy observed in clinical trials and effectiveness found in real practice in chronic conditions like type 2 Diabetes [40], and obesity shares similarities with it, both in their chronic nature and in their pathophysiology. Weight reduction is a strong signal for patients’ perception of effectiveness that reinforces treatment adherence and this is probably one of the reasons for the high treatment adherence found in our study. Undoubtedly, treatment cost and treatment adherence will significantly impact effectiveness of antiobesity drugs in future real-world studies.

Our study has several limitations derived from its real-world descriptive nature. First, the lack of a control group does not allow to assign achieved weight loss to the solely effect of sc semaglutide, although previous evidence from randomized trials shows a similar degree of weight loss associated to the drug. Second, a number of patients were missed from follow-up for weight evolution, so again a selection bias overestimating treatment effect cannot be excluded, being this is a typical limitation of real-world studies. Third, a number of patients were included in this study with current use of other drugs with a potential for weight loss, both oral medications and GLP-1 analogues, so a potential confounding effect of these treatments cannot be completely excluded. Nevertheless, we performed a subgroup analysis where oral anti-obesity medications were not found to impact significantly on weight reduction and conversely, previous use of GLP-1 analogues was associated to a significantly lower weight loss, assuming that part of the potential for weight reduction associated to GLP-1 agonist therapy had already been achieved in those patients. Finally, it is not usual that an observational study reporting on effectiveness and safety of a drug in real practice conditions is published before gaining regulatory approval for the specific indication, as efficacy and mostly safety are important issues that must be first addressed by randomized clinical trials, and the authors deeply acknowledge this fact. Nevertheless, several important questions must be kept in mind in this regard; first, sc semaglutide has been approved by regulatory agencies in most developed countries for use in patients with type 2 diabetes and conditions for reimbursement in Spain include coexisting obesity, which virtually affects most patients with type 2 Diabetes. Second, liraglutide, a GLP-1 analogue with a similar molecular design and pharmacological properties has been approved for weight reduction in patients with obesity and third, given the shortage of effective treatments to treat obesity and the barriers that treatment cost may represent for patients’ accessibility to such therapies, the authors believe that evidence provided by this study is timely, and of scientific interest.

Conclusion

In conclusion, in this observational study in real practice conditions, we have demonstrated that sc semaglutide at a weekly dose of 0.5 to 1.0 mg administered to patients with overweight or obesity in the pragmatic context of a structured program along with diet and lifestyle recommendations resulted in a sustained, safe and affordable clinically significant weight reduction. Given the limitations of a retrospective observational study, we will need to confirm these results with the forthcoming results of the STEP program and contrast them with results from other groups in a real practice setting which for sure will be coming up in future. Until then, we consider that weekly sc semaglutide represents a useful tool for helping patients in their long-term struggle, along with diet and lifestyle changes, to increase their chances to arrive to and maintain a healthy body weight.

Acknowledgements

The authors wish to deeply thank to all patients for their participation in the study.


Read more about Lupine Publishers Journal of Diabetes & Obesity click on the below link:

https://diabetes-obesity-lupine-publishers.blogspot.com/


Tuesday, 27 June 2023

Lupine Publishers | Scanning Electron Microscopic Investigations to Clarify the Role Played by the Endocardium in the Origin of Dilated Cardiomyopathy(DCM)

 Lupine Publishers | Journal of Advancements in Cardiology Research & Reports


Abstract

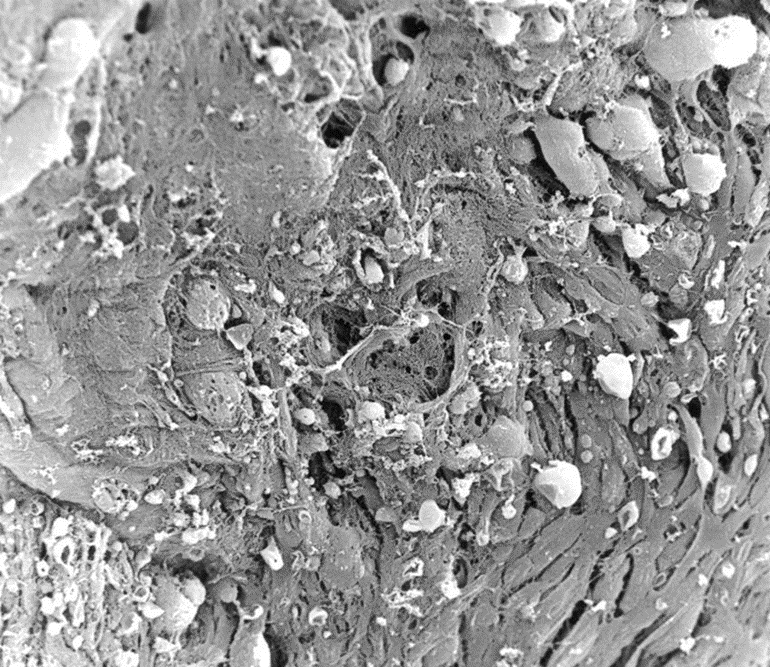
Dilated cardiomyopathy (DCM) is a cardiac disease characterized by dilatation and impaired systolic function of the left or both ventricles. The etiology of DCM is multifactorial, and many different clinical conditions can lead to the phenotype of DCM. During recent years, the pathophysiology of DCM has been under intensive investigation, and, thereby, the knowledge of DCM has increased rapidly. However, the pathophysiological mechanisms, by which morphological modifications eventually result in clinical heart failure, are complex and not yet totally resolved. Better knowledge of the morphological background and disease-originating mechanisms would probably help us to focus early treatment on the right subjects and potentially also develop new treatment options in the affected patients. This study aimed to investigate the pathophysiological origin of DCM from a morphological point of view. Therefore, scanning electron and polarised light microscopic investigations on explanted hearts from DCM patients were carried out to determine the morphology of the endocardium. Tissue samples were taken from 4 male (average age; 72.21/years) and 2 female DCM patients (63.14years). The study population included patients suffering from DCM who were listed on transplant waiting lists while being clinically categorized as stage NYHA III-IV. Patients‘ hearts were explanted for cardiac transplantation and the explanted hearts were examined by scanning electron microscopy and polarised light microscopic investigations. The endocardial layer was partially desquamated from the basement membrane and showed isolated island-like cell formations. Areas of loosened cells connected to each other and to the basement membrane, abrasion of the endothelial cells, formation of filiform and lamellar Lambl’s excrescences, locally well-defined elevations above the intact endothelium, calcium deposits and hyperplasia of collagen fibers were detected. There were also formations resembling fungal micelles.

Keywords: DCM; Electron Microscopy; Thoracic aortic aneurysm; Electron microscopy

Introduction

Dilated cardiomyopathy (DCM) is a cardiac disease characterized by dilatation and impaired systolic function of the left or both ventricles. DCM causes considerable morbidity and mortality. The etiology of DCM is multifactorial, and many different clinical conditions can lead to the phenotype of DCM. During recent years it has become evident that genetic factors play an important role in the etiology and pathogenesis of idiopathic DCM [1]. The pathophysiology of DCM has been under intensive investigation, and, thereby, the knowledge of DCM has increased rapidly. The genetic background of the disease seems to be relatively heterogeneous, and the disease-associated mutations affect mostly whole families and only a few separate patients. Disease-associated mutations have been detected for example, in genes encoding sarcomere, cytoskeletal, and nuclear proteins, as well as proteins involved with regulation of Ca2+ metabolism. However, the pathophysiological mechanism, by which morphological mutations eventually result in clinical heart failure, are complex and not yet totally resolved [2-5]. Better knowledge of the pathophysiological background and disease-originating mechanisms would probably help us to focus early treatment on the the most acute subjects and potentially also develop new treatment modalities and improve cardiac outcome in the affected patients.

Most of the trials investigating the origin of DCM are focused on genetic disorders. However, in addition to genetic and pathophysiological investigations, morphological analyses of the internal structure of the heart are becoming increasingly important and may contribute to an explanation of the origin of the occurrence of DCM [6,7]. It is well known that genetic factors play an important role in the etiology and pathogenesis of idiopathic DCM [2, 8-10]. The origin of DCM as an endocardium-based disease has, so far, never been described. For this study, we investigated and now describe the morphology of the endocardium of DCM patients using polarised light microscopy in addition to conventional scanning electron microscopical techniques. Especially, we were interested in identifying a potential origin of DCM.

Materials and Methods Tissue Samples

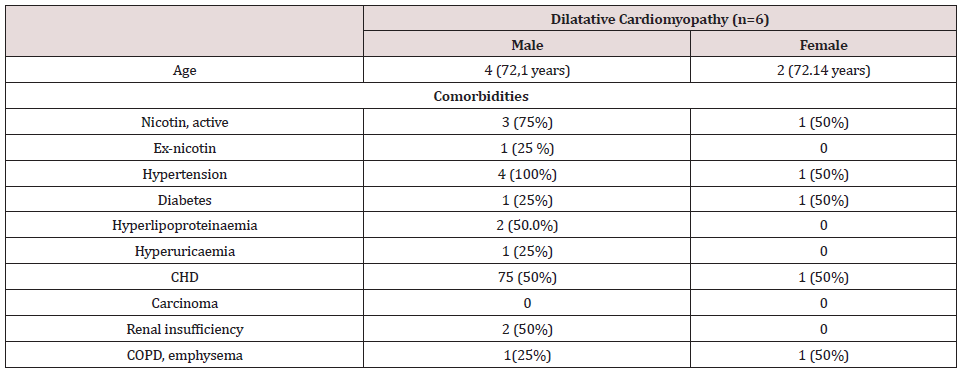
Tissue samples from explanted hearts were taken from DCM patients undergoing routine cardiac surgery (cardiac transplantation) at the Department of Thoracic, Heart and Vascular Surgery, University Hospital of Goettingen, Germany. The biopsies were taken from 4 male (average age; 72+2 years) and 2 female DCM patients (63+1 years). The study population included cardiac transplant patients suffering from endstage DCM (NYHA III-IV). Table 1 presents summarized data of the basic patient characteristics.

Table 1:Baseline characteristics of the study population.

Lupinepublishers-openaccess-cardiology

Continuous variables are presented as mean + standard deviation. Categorical variables are presented as an absolute percentage. Abbreviations: CHD: Coronary Heart Disease, COPD: Chronic obstructive pulmonary disease

Scanning electron microscopy

In order to reveal the morphology of the explanted hearts, scanning electron microscopy was performed in all tissue samples. Specimens taken from the endocardium were fixed for 6 hours in a solution containing 2.5% glutaraldehyde and 0.2m Mol cacodylate. Afterwards, samples were dehydrated in a series of increasing concentrations of alcohol. After critical point drying, all samples were sputtered with gold-palladium. Samples were visualized using the digital scanning microscope (Zeiss DSM 960, Germany).

Results

Scanning electron microscopical findings

In all the tissue materials investigated, the endothelial cells were mostly desquamated. The remaining endothelial cells showed a loose binding to each other. At higher magnification, the endothelial cells appeared swollen and took on a foamlike appearance. The endothelial cells also showed similar metaplasia and loose binding to each other as in other endocardium parts. In addition, we found diffusely distributed sites of columnar endothelial cell formations in all tissues, some of which had lost their intercellular junction (Figures. 1,2). In such islets the endothelial cells had, in places, agglomerated to form columnar structures (Figure 3). These structures obviously represent a transitional form to Lambl’s excrescences. The Lambl excrescences occurred in a filiform and a lamellar form. Often the excrescences did not have an endothelial coating (Figure 4). Hyperplasia of the collagen fibers was clearly visible in such excrescences in different layers. The ratio of filiform to lamellar forms was approximately 80% in all specimens. Very often, crater-like „punched“ defects were visible on the surface of the myocardium, which showed an endothelial coating at higher magnification (Figure 5). On such altered endothelial cells, micellelike structures were visible (Figure 6). At higher magnification the micelle-like structures are better visible (Figure 7).

Figure 1: Electron microscopical view of endocardium of explanted hearts with DCM, 500 x magnification: desquamation of the endothelial cells with a loose binding to each other.

Lupinepublishers-openaccess-cardiology

Figure 2: Electron microscopical view of endocardium of Hearts with DCM, 1000 x magnification: at higher magnification, the endothelial cells appeared swollen with a foamlike appearance.

Lupinepublishers-openaccess-cardiology

Figure 3: Electron microscopical view of endocardium of heart with DCM, 200 x magnification: filiform Lambl’s excrescences.

Lupinepublishers-openaccess-cardiology

Figure 4: Electron microscopical view of endocardium of heart with DCM, 3000 x magnification: dendothelial desquamation on Lambl’s excrescences.

Lupinepublishers-openaccess-cardiology

Figure 5: Electron microscopical view of endocardium of heart with DCM, 330 x magnification: crater-like„ punched“ defects.

Lupinepublishers-openaccess-cardiology

Figure 6: Electron microscopical view of endocardium of heart with DCM, 200 x magnification: micelle-like structures.

Lupinepublishers-openaccess-cardiology

Figure 7: Electron microscopical view of endocardium of heart with DCM, 1000 x magnification: higher magnification of micelle-like structures.

Lupinepublishers-openaccess-cardiology

Discussion

Multiple etiologies of DCM, including ischemic, genetic, toxic, viral, inflammatory, autoimmune, and, last but not least, idiopathic causes are known? [11-17]. In developed countries, the incidence of DCM is 5- 10patients/100,000 (15-17) with a prevalence of 36 patients/100,000 people [18,19]. Future demographic changes such as an aging population and greater life expectancy are expected to increase the incidence of DCM even more. Thus, DCM will likely play a growing economic and medical role in the coming years. [20,21]. Pathophysiologically, DCM is characterized by dilatation and impaired systolic function of the left or both ventricles. So far, the origin of this disease is thought to be a disorder of the cardiac muscle in which myocyte weakness leads to ventricular dilatation and heart failure [22,23]. However, until now, it has not yet been considered that the origin of DCM may be endocardium-based. Therefore, we performed the presented study to investigate the morphological role of the endocardium and its role in the origin of the development of DCM. In the myocardium of DCM, we were able to detect two differing findings. On the one hand, there are changes in the endothelium and the extracellular matrix, which we know in a very similar form from aortic and mitral valves explanted due to degeneration [24]. On the one hand, there is a desquamation of the endothelial cells, which lose their junctions to each other. They are also swollen. The collagen fibers are hypertrophied and have lost their helical structure. In addition, lamellar Lambl` excrecences which we have been able to demonstrate in a similar form in degenerated aortic and mitral valves [24] are frequent, Craterlike defects of the endothelium have rarely been observed. On the other hand, we were able to detect fungal micelle-like strictures in all examined tissues, which mainly occurred at the edge of severely destroyed mycardium. The increased activation of matrix metalloproteinases in pathologically altered human endocardium emphasizes the crucial role of the extracellular matrix in the development of this disease [25-29]. The detection of involvement of the endocardium tissue in DCM suggests that pathophysiological processes similar to the degeneration of heart valves play a major etiological role in the development of DCM. Parallel to assumed pathophysiological processes of the heart valves, collagen substance transition disorders based on endothelial dysfunction could lead to pathologically increased stress on the extracellular matrix, which causes a similar response of the endothelium and the extracellular matrix as in the degeneration of aortic and mitral valve disease [30,31]. Further investigations are necessary to clarify the role of a possible infection aetiology.

Conclusion

In this study of explanted hearts of DCM patients, several morphological modifications of the endocardium and extracellular matrix are similarity of these alterations to the degeneration of aorta and mitral valves, which suggest that similar pathophysiological changes, such as possible disturbances in the synthesis of collagen fibres play an important etiological role in the development of DCM. The detection of micelle-like structures requires further clarification.

Conflict of Interest

I hereby declare that there were no financial or other interests in the execution and evaluation of this work.


Read more about Lupine Publishers Journal of Advancements in Cardiology Research & Reports Click on the below link: https://lupine-publishers-cardiovascular.blogspot.com/