Open Journal of Civil Engineering | Lupine Publishers
Abstract
Keywords: Passenger Car Unit; Level of service; Traffic Volume; peak hour factor; Intersection; Rajshahi
Abbreviations: LOS: Level of Service; RCC: Rajshahi city corporation; PHF: peak hour factor; PCU: Passenger car unit
Introduction
In Rajshahi city, the increment of traffic volume and congestions are two quickly developing problems. Nowadays, it is common to see traffic congestions at intersections at peak hours in the morning and evening. According to a report, traffic volume is increasing in last few decades and was 19397 in 2015 with annual growth rate 6.1% in this city [12]. This may be due to Poor road planning and sub-standard geometric conditions of selected intersections [13]. Intersections become very congested if traffic volume are high, make inefficiency as a result peoples suffer delay and frustration [14]. A rapid escalation in the number of motor vehicles, greater availability of used vehicles, the relative reduction in prices result traffic congestions [15]. Due to traffic congestion, air pollution, fuel usage, and travel time [16,17]. Therefore, it is a significant issue to investigate traffic volume and to monitor the quality of transport supply in terms of level of service for major intersections of Rajshahi city corporation (RCC). Traffic volume count of this study will be helpful for planning, accident analysis [18], design and operation, for roadway of Rajshahi city [19] as well as future traffic demand forecasting.
To estimate traffic volume at selected intersections, a case study was made at 4 major intersections during morning (8am10am), noon (12pm-2pm) and evening (4pm-6pm). To analyze mixed or heterogeneous traffic, a simplification is developed by (add authors name) to convert the different types of vehicles into equivalent number of passenger cars named Passenger car unit or PCU [6]. Finally estimated PCU value are used to determine LOS on three or four legs divided intersections. Level of service (LOS) was determined by volume capacity ratio and peak hour factor method.
Literature Review
Related Works in Foreign Countries
A concept was first developed in 1965 for highway named highway capacity manual (HCM) to define level of service and classify it by a range from A to F for highway [20]. It is very important to analyze the traffic performance for design, maintenance, rehabilitation, and planning of roads. Performance evaluation of traffic in a highway is expressed by a term Level of service. It is a method which can explain traffic conditions for an existing or proposed transportation facility operating based upon current or projected traffic demand [21]. Capacity and level of service are analyzed to get the delay of the analyzed facilities. This Analysis is two types. One is empirical, another is analytical. The empirical model is established on the basis of regression analysis on the other hand the analytical model is based on the gap-acceptance theory [22]. An attempt is made by Ankit N Mahidadiya and Prof. Jayesh Juremalani to estimate passenger Car unit (PCU) in an urban intersection [23]. A study was made in malaysia by jamil et al. using aaSIDRA (full abbreviate of aaSIDRA) intersection version 5.1 software to analyze capacity, level of service at unsignalized intersection. Main purpose was to analyze factors affecting level of service at a junction [24]. Rao et al. followed HCM (highway capacity manual) 2000 to evaluate the capacity, control delay and Level of service of vehicular streams and traffic parameters were abstracted by the videography for 3 uncontrolled intersections in India [25]. Mithun Mohan and Satish Chandra proposed three methods for the estimation of PCU at UI under highly heterogeneous traffic conditions. First one is PCU based on occupancy time, second one is PCU based on potential capacity, and last one is PCU based on queue clearance rate [26].Related Works in Bangladesh
Several research programs have been developed in foreign countries, but very limited studies have been made in this selected topic in Bangladesh. A case study like physical feature s survey, delay time survey, parking survey, traffic volume survey was done to find out the condition of traffic and transportation at Central Business Area of Rangpur city [27]. A study was developed by chisty, islam and mishuk to identify the existing level of service of agrabad to CEPZ Road in Chittagong city. To calculate LOS, a traffic survey was carried out to determine traffic volume, capacity, and speed of that existing road [28].Related Works in Study Area
During the literature review, there are no studies were found about estimation of traffic volume at intersections to calculate level of service at intersections in Rajshahi city.Materials and Methods
Description of Study Area
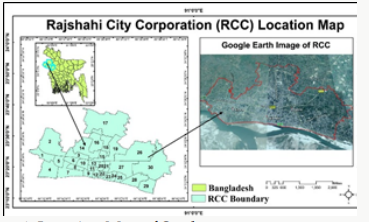
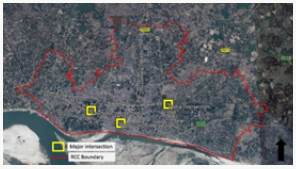
Rajshahi is a metropolitan city in Bangladesh and a major urban, commercial and educational Centre of North Bengal [29]. The study is carried out in Rajshahi City Corporation, located in Northwest part of Bangladesh. There are 4 thanas (Administrative Unit) in Rajshahi City Corporation which include 30 wards Figure 1. There are 10 city corporations in Bangladesh and Rajshahi is one of the oldest city corporations, which is established in 1991[29]. In the previous decade Rajshahi is called a city of rickshaw but now it is called a city of both rickshaw and auto-rickshaw and easy bike [2]. In Rajshahi city, 63% commercial vehicles transport passenger and carry freight [12]. The nature of all intersections is Non-signalized. Most busy intersections were selected named Vodra, Laxmipur, Monicottor.Road Geometry of Intersections
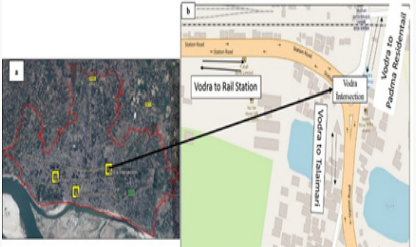
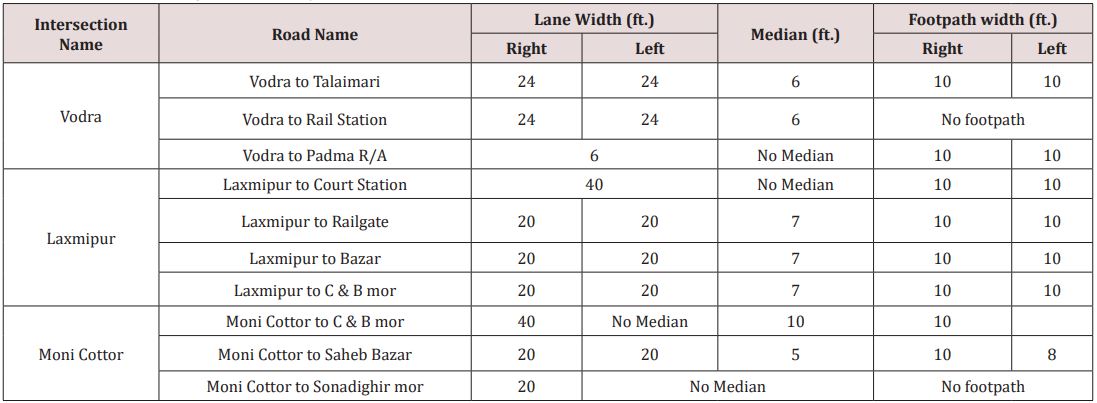
Three roads intersected at Vodra intersection are TalaimariVodra, Railway Station-Vodra & Padma Residential area- Vodra. A sculpture is situated named “Smriti Amlan” in the center of intersection which radius is 40 feet. The Talaimari-Vodra road has four lanes. The “Railway station-Vodra” road has four lanes with two sided footpath. The Padma residential-Vodra road has two lanes with two-sided footpath Figure 1. Laxmipur intersection consists of four roads named Bazar to Laxmipur, Railgate to Laxmipur, C&B to Laxmipur & court station road to Laxmipur. In the Centre of intersection, a sculpture is situated named Mintu mia chottor and its radious is of the center is 29ft. Court station road is two lanes and other road is four lanes Figure 2.
Figure 3: Road Connectivity of Intersection
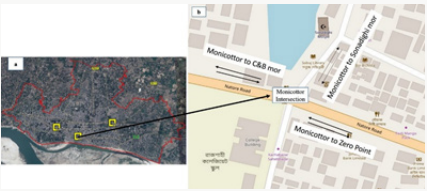

- Location of Monicottor intersection.
- Road Connectivity of Monicottor Intersection.
Figure 4: Road Connectivity of Intersection
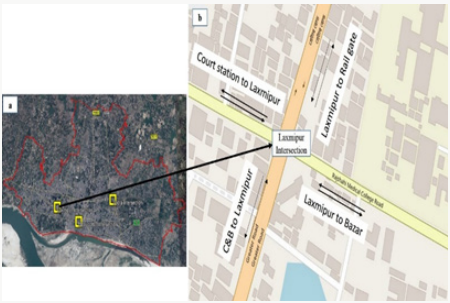

- Location of Laxmipur intersection.
- Road Connectivity of Laxmipur Intersection.
Figure 5: Road Connectivity of Intersection
The busiest intersection is Monicottor which consists of 3
roads. In east, west and north direction are Zero point, CNB area,
Sonadighi mor. Vehicles type are Auto rickshaw, Rickshaw, CNG, Microbus,
Truck, Cycle, Motor cycle, bus (Figures 3-5) (Tables 1 & 2). 
- Location of Vodra intersection.
- Road Connectivity of Vodra Intersection.
Table 2: Traffic performance measurement by V/C ratio (HCM 2010) (Mathew & Bombay, 2017; Wikipedia, 2017).


Methodology
The main objective of this research is to identify the LOS of different intersections. LOS is related with Modal composition of various transport, Road capacity and Road geometry. Modal composition describes the key operational, commercial advantages and properties of any transport in terms of cost, speed, accessibility, frequency, safety, comfort, etc. In this research to achieve the LOS, traffic volume survey was carried out to count mixed vehicles, geometric feature survey. All traffic data were collected into three phases like morning peak (8-10am), afternoon off peak (12-2pm) and evening peak (4-6pm) and each peak was continued for 2 hours duration (Transport, 2004). Geometric feature survey is needed to identify the existing road capacity. To identify the existing supply and capacity conditions of various intersections road length, width of carriageway, footpath, median, shoulder, number of legs and control system etc. data has been collected by conducting field survey. The calculation of Passenger car unit or PCU is very important to analyze the mixed or heterogeneous traffic and PCU is a simplification which convert the different types of vehicles into equivalent number of passenger cars [26]. By conducting a private survey in 2014, 11,000 battery operated auto-rickshaws, 35,000 rickshaws, 800 CNG-rickshaws and auto-tempos, 1,500 human hauler, 1,200 rickshaw vans and 1,500 cars and micro-buses are investigated [3] (Table 3).To estimate the LOS two useful methods have been applied. The volume-capacity ratio is 1st of them. Volume capacity ratio (V/C) is one of the most used index to assess traffic status in cities, in which V is the total number of vehicles passing a point in one hour and C for the maximum number of vehicles that can pass a certain point at the reasonable traffic condition, “Volume -Capacity Ratio (V/C) is a measure that reflects mobility and quality of travel of a facility or a section of a facility. It compares roadway demand (vehicle volumes) with roadway supply (carrying capacity) [18]. The V/C method is associated with LOS and determining how well a roadway is performing. This measure can alert transportation providers to areas where traffic mitigation measures should be considered. V/C ratio was calculated by following formula [30,31].


Results and Discussions
Monicottor Intersection
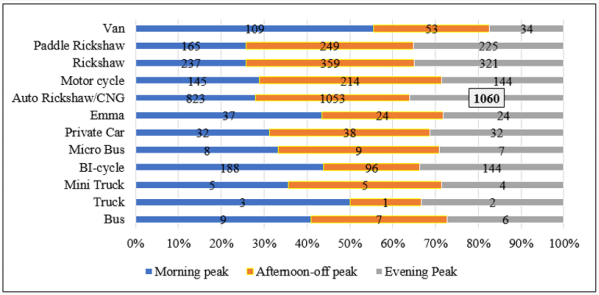
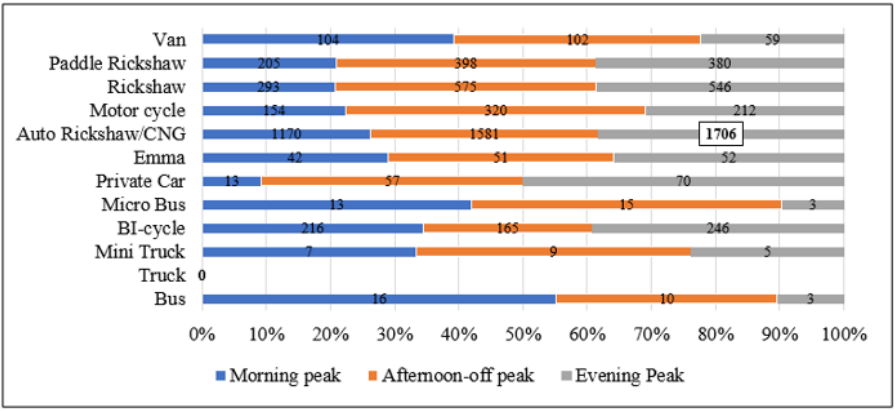
Moni- Cottor to C & B lane: It is noticed that most vehicles about 1060/hour used by public than other vehicles are autorickshaw at evening hour. There is no separate lane constructed for such type of vehicles. Second dominated vehicle is rickshaw and paddle rickshaw and their peak value 359 vehicles/hour and 249vehicles/hour respectively were found both at afternoon off peak. Afternoon off peak contains maximum number of vehicles in most of the case. Less dominant vehicles are bus, truck, private car, Emma. Moderate dominant vehicles are motor cycle, rickshaw, paddle rickshaw and bi cycle. Their peak value fluctuates at any peak hour (either morning or afternoon peak or evening peak) Figure 6.Monicottor to Zero-point lane: In this lane majority of vehicle is auto-rickshaw about 1706/hour at evening peak. Negligible number of vehicles like bus, mini truck, micro-bus is existing in road. Moderate number of vehicles are paddle rickshaw, motor cycle, rickshaw, van and bi cycle. No truck found in this lane at any peak hour. During evening from 4-6pm maximum amount of traffic is obvious. In this lane traffic volume is so high because traffic flow from three different direction mix here Figure 7.
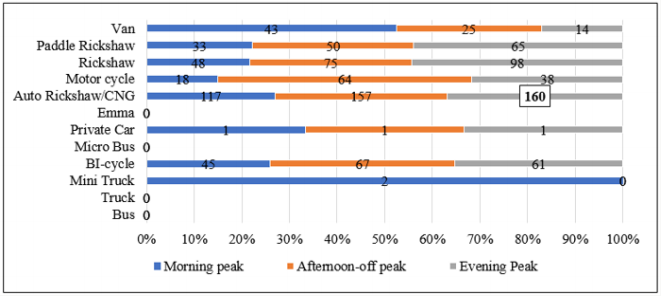
Moni-Cottor to Sonadighi lane: Traffic volume in Sonadighi lane is less than the other lanes. For less carriage width heavy vehicle cannot enter in this lane. Higher amount of Auto-rickshaw or CNG about 160/hour were found at evening peak. Mainly autorickshaw is dominant vehicle at 3 peaks. No Emma, microbus, truck, bus influence in that lane. Moderate dominant vehicles are motor cycle, rickshaw, paddle rickshaw, bi cycle and van which fluctuate at every peak hours. Vehicles like private car, mini truck are existing in road in less amount Figure 8.
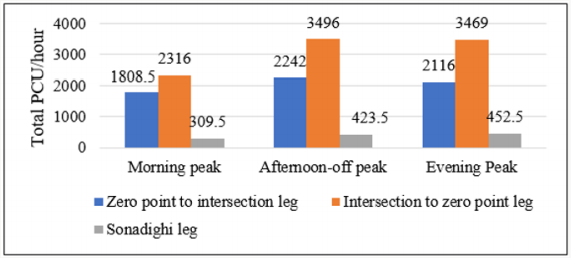
Temporal Variation of Three legs of Moni-chottor Intersection: Intersection to zero-point leg has 3496 PCU/hour which contains the highest PCU/hour among the three legs at afternoon-off peak. Second one is intersection to zero-point leg and last one is sonadighi leg contain 2242pcu/hour and 452.5pcu/hour at afternoon off peak and evening peak respectively Figure 9.
Level of Service in Monicottor Intersection
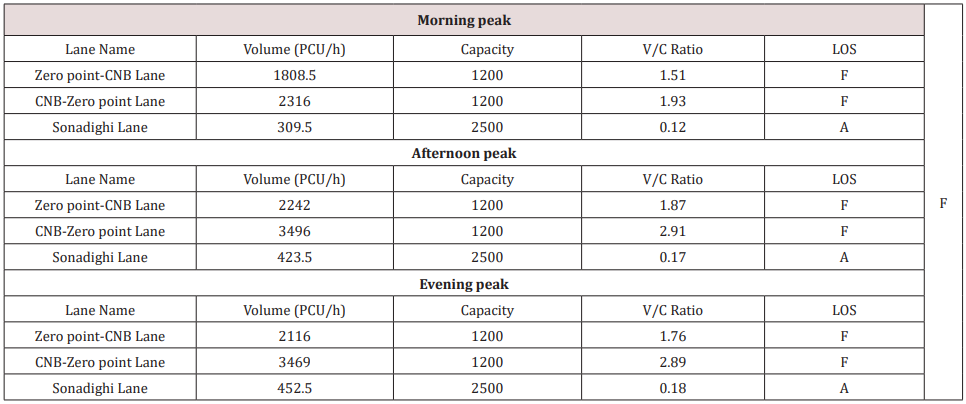
V/C Ratio MethodAnalysis shows that in Zero Point to CNB lane & CNB to Zero Point lane traffic volume is more than its capacity in three periods of time. Only sonadighi lane fell within A category in 3 peaks. Rest of the lanes satisfy level of service of F category. By following V/C ratio method LOS of Monicottor intersection is F category in three periods of time Table 4.
Peak Hour Factor Method
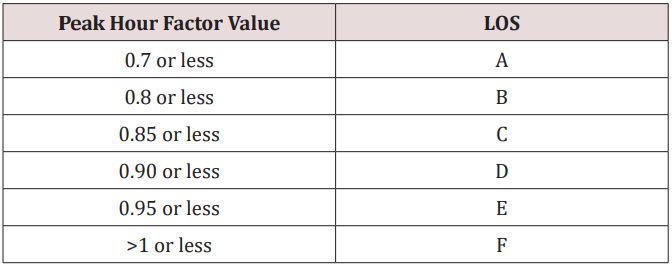
Monicottor intersection LOS of Sonadighi lane in morning is E category, in noon LOS of Zero Point to CNB lane & CNB to Zero Point lane is of D category and in evening peak LOS of the three lanes are category B. As we can see that, among these three periods lowest LOS of Sonadighi lane is category E Table 5. By analyzing two methods level of service of Moni-cottor intersection is F which indicates worse condition exist in this intersection.
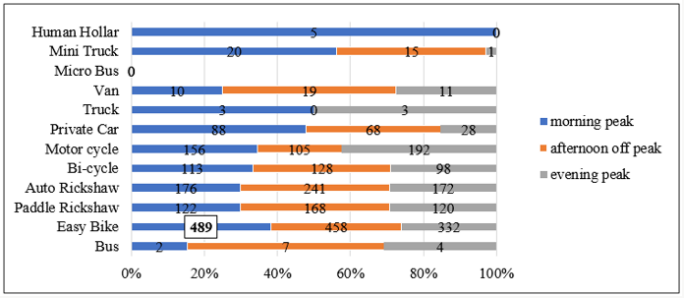
Laxmipur Intersection
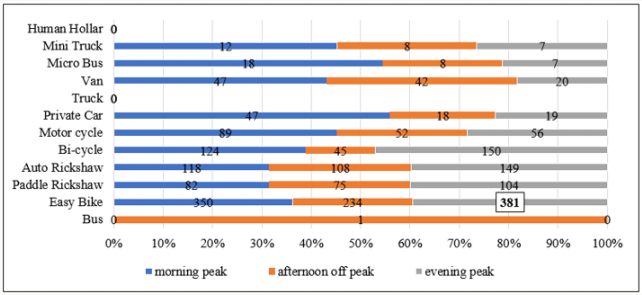
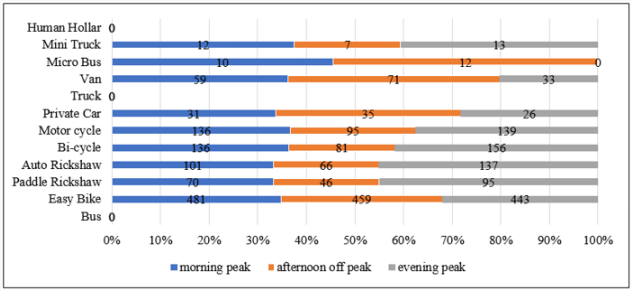
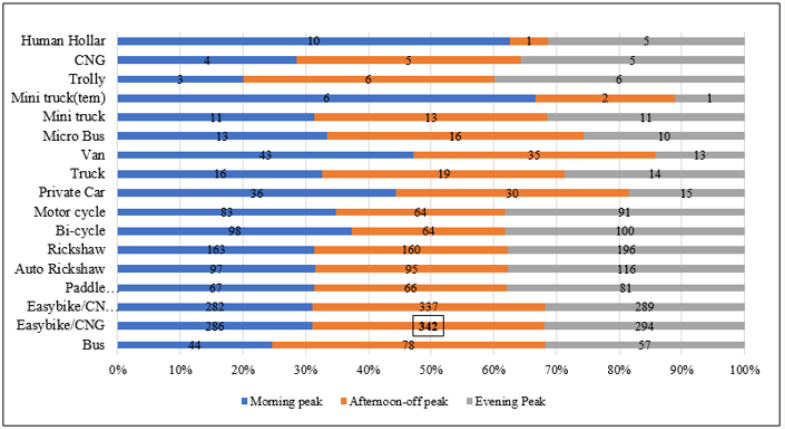
C & B to Laxmipur: Easy bike is the most dominated vehicle about 489 found in the morning. Rest of the peaks also contain highest amount of easy bike and its amount is 458 and 332 at noon and evening hour respectively. Paddle rickshaw and auto-rickshaw are maximum in afternoon peak period. The maximum volume of motor cycle is found in the evening period whereas maximum private car volume is found in the morning period. Moderate number of vehicles are paddle rickshaw, auto rickshaw, bi cycle. There is no microbus influence in this lane. Less dominant vehicles are truck, van, Mini truck, human holler and also their effect are less at three peaks Figure 10.Laxmipur to C & B lane: High concentration of vehicle in Laxmipur to CNB lane is easy bike. Amount of such type vehicle is 381 was found in evening hour. No truck, human holler influence in this lane. Only one bus was found during afternoon off peak. At evening, morning, afternoon off peaks concentration of auto-rickshaw, paddle rickshaw and bi cycle were maximum. Concentration of van, micro bus, mini truck is limited, their percentages are about 45%, 55% and 47% at morning, about 43%, 38%. 40% at afternoon off peak and rest of the percentage exist at evening respectively Figure 11.
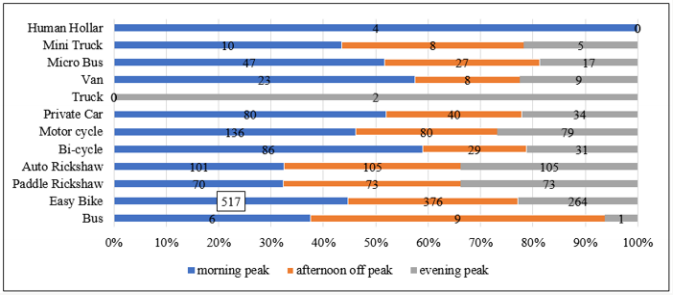
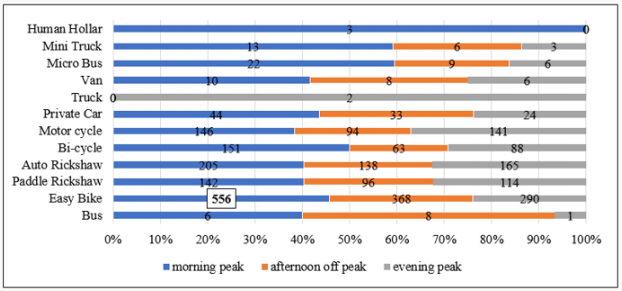
Rail Station to Laxmipur: In This lane, dominant vehicle is easy bike. At morning highest concentration of easy bike was found and its amount is 517. Second dominant vehicles are paddle rickshaw, auto rickshaw, bi cycle, motor cycle, private car and their percentage are about 33%, 35%, 59%, 45%, 53% at morning, 35%, 37%, 25%, 35%, 25% at afternoon off peak and rest of the percentage of vehicles found at evening respectively. Low volume of traffic like Truck, human holler was found in this lane. Less dominant vehicles were mini truck, micro bus, van and bus Figure 12.
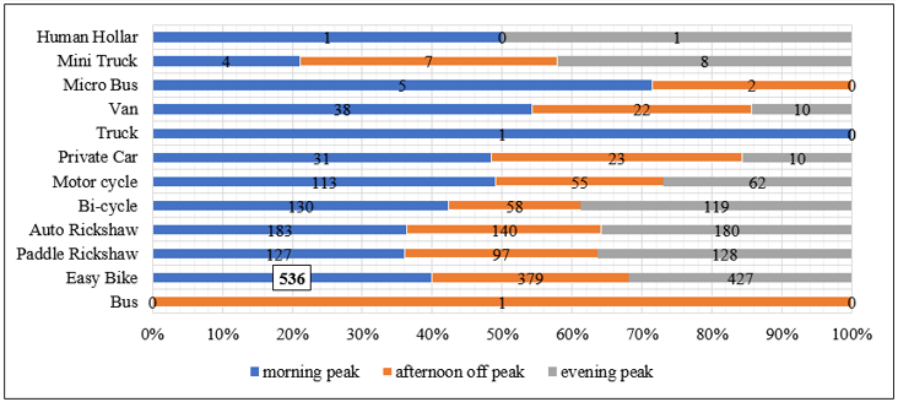
Laxmipur to Rail Station: This lane dominant vehicle is easy bike (536). Less influenced vehicles were truck, bus, van, micro bus, mini truck, and human holler. Concentration of paddle rickshaw, auto rickshaw, bi cycle, motor cycle, private car about 35%, 37%, 43%, 49%, 49% at morning, 32%, 35%, 39%, 28%, 15% at evening and rest of the percentage vehicles were found at afternoon off peak respectively Figure 13.
Bazar to Laxmipur: Easy bike dominant at this lane at morning, evening and afternoon off peak. Second dominant vehicles are paddle rickshaw, auto rickshaw, bi cycle, motor cycle, private car and their percentage are approximately 33%, 34%, 35%, 36%, 32% at morning, 33%, 45%, 45%, 43%, 38%, 28%. at evening peak and rest of percentage at afternoon off peak respectively. Truck, bus and human holler have no influence. Less volume of vehicles are van, micro bus, and mini truck Figure 14.
Laxmipur to Bazar: Easy bike is the dominant vehicle found at morning hour. Second dominant vehicles are paddle rickshaw, auto rickshaw, bi cycle, motor cycle, private car and their concentration percentage are 40%, 40%, 50%, 38%, & 42% at morning, 28%, 30%, 22%, 26%, 32% at afternoon off peak and rest of the percentage at evening peak respectively. Less dominant vehicles are van, micro bus, mini truck, human holler and the concentration of these vehicles fluctuate during evening, morning, and afternoon off peak. Truck has less influence in this lane Figure 15.
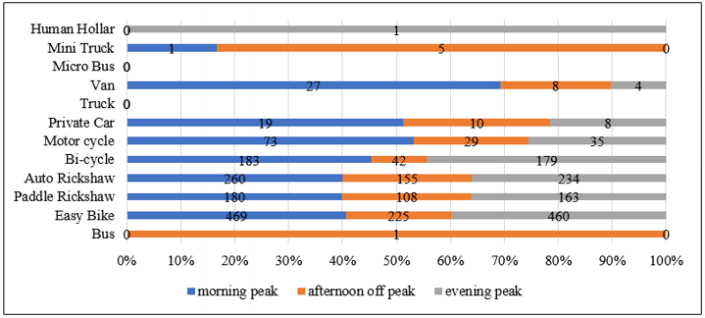
Court to Laxmipur lane: Large amount of vehicles is easy bike found at morning. There is no truck and microbus in this lane. Concentration of paddle rickshaw, auto-rickshaw, bi cycle, motor cycle are 40%, 40%, 43%, 53% at morning, 23%, 25%, 13%, 22% at afternoon off peak respectively. Low concentration of vehicles is mini truck, human, holler, private car Figure 16.
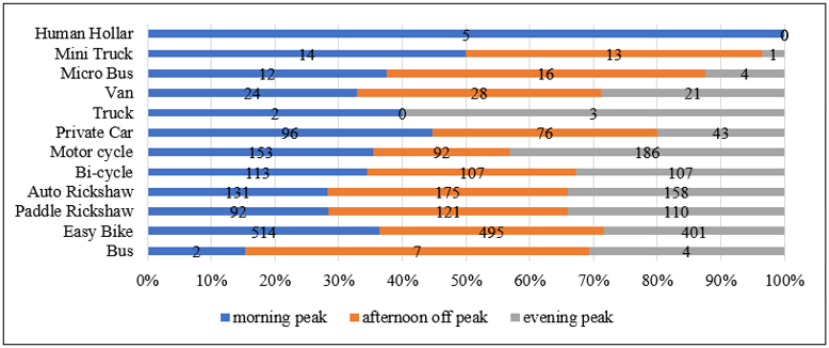
Laxmipur to Court lane: Large volume of vehicle is easy bike. Human holler was found only morning peak. Percentage of paddle rickshaw, auto rickshaw, bi cycle, motor cycle, and private car are 28%, 29%, 35%, 36%, 43%, at morning, 40%, 42%, 43%, 30%, 35%, at afternoon off peak respectively. Rest of the percentage was found in evening hour peak. Less influenced vehicles were van, micro bus, mini bus and bus Figure 17.
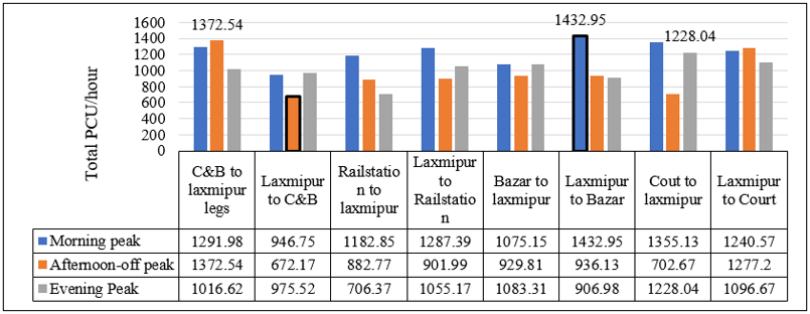
Temporal Variation of Different Legs of Laxmipur Intersection: Laxmipur intersection to bazar leg contain highest amount of PCU/hour at morning hour and this value is 1432.95 PCU/hour. Lowest PCU/hour looked through at Laxmipur intersection to CNB during afternoon off peak. The location of highest concentration of PCU/hour for afternoon off peak and evening were CNB to Laxmipur leg and court to Laxmipur leg respectively.
Level of Service
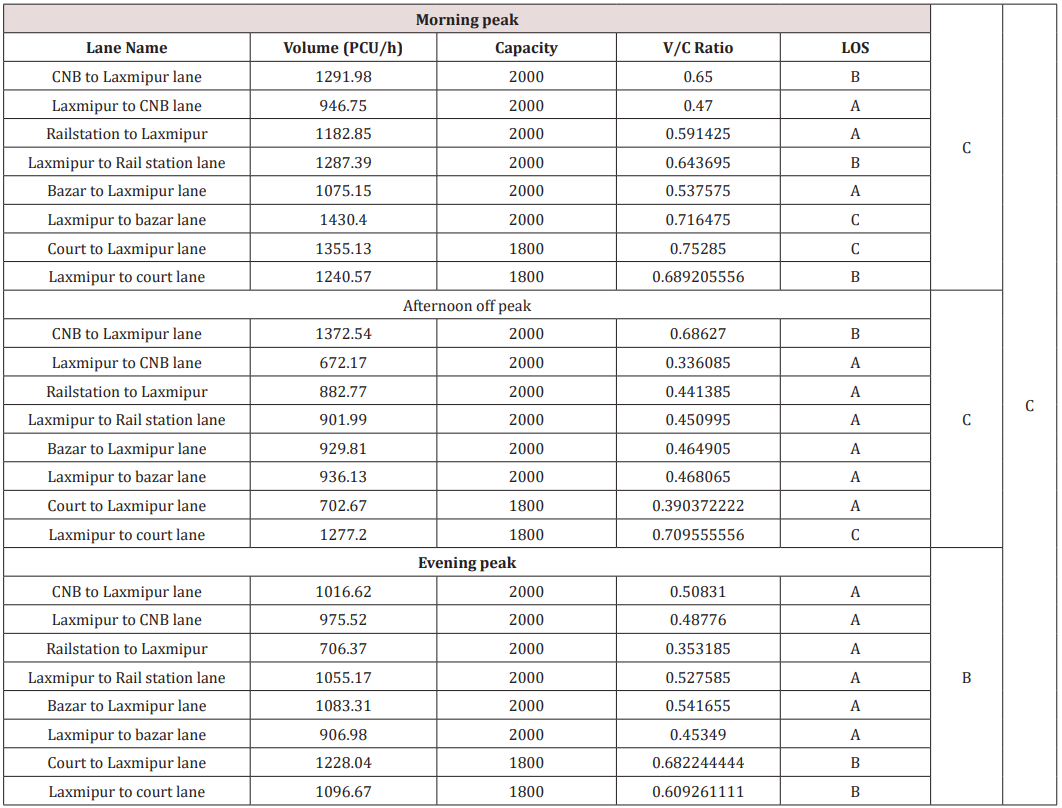
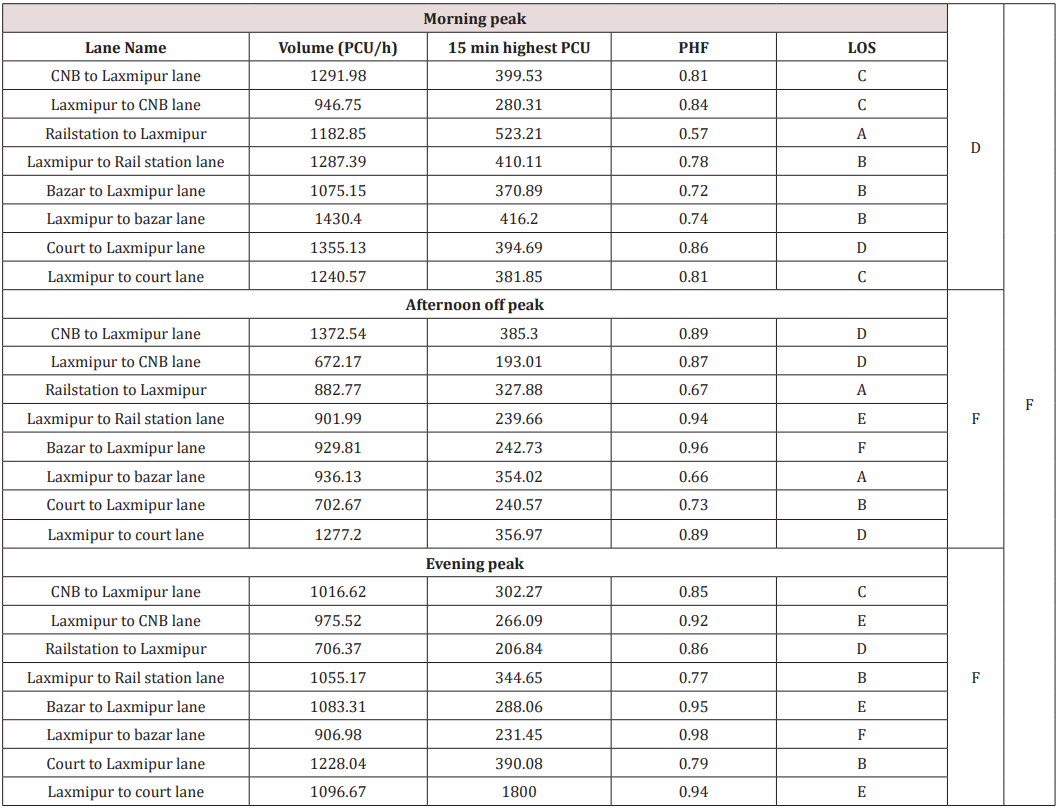
V/C Ratio Method: By comparing between given V/C ration and standard V/C ratio, the highest LOS in respect of V/C ratio at morning peak, afternoon off peak, evening peak are C, C and B and their respective locations are Laxmipur to bazar lane, court to Laxmipur lane and Laxmipur to court lane. According to V/C ratio, LOS of Laxmipur intersection is C by considering all lanes.Peak Hour Factor Method: According to PHF method the LOS of Laxmipur intersection is F compared to standard PHF. At morning highest PHF is C in CNB to Laxmipur lane, Laxmipur to CNB lane and Laxmipur to court lane. At afternoon off peak, evening peak the highest PHF is F in bazar to Laxmipur lane and Laxmipur to bazar respectively.
By considering and analyzing two methods the LOS of Laxmipur intersection is F which is worst among all category
Vodra Intersection
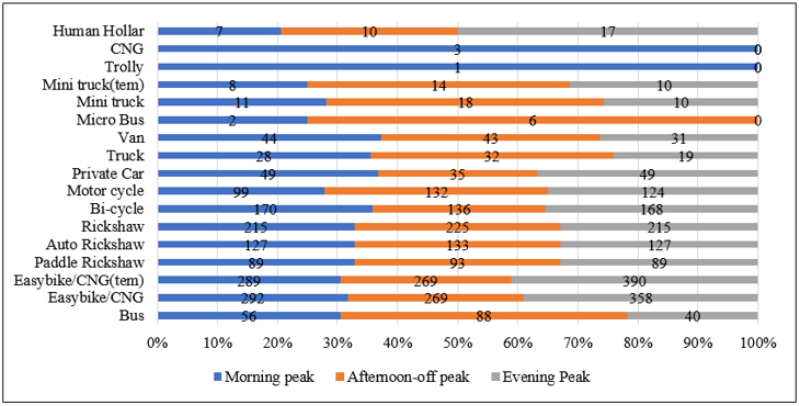
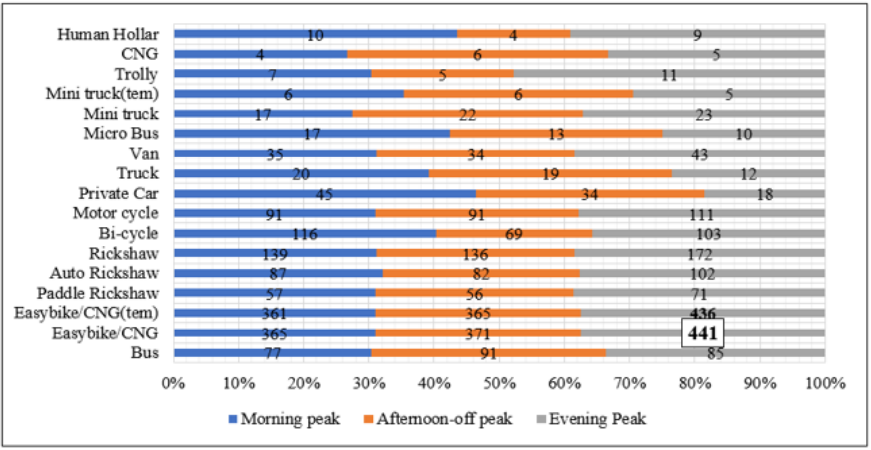
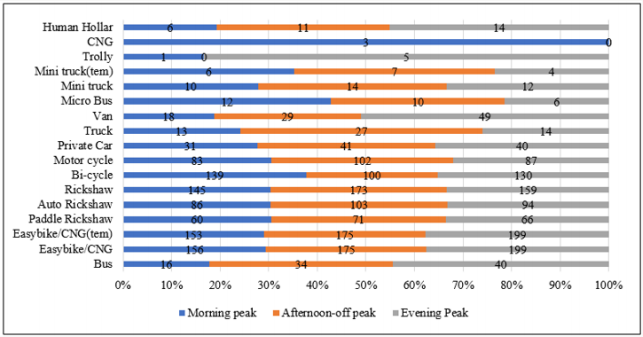
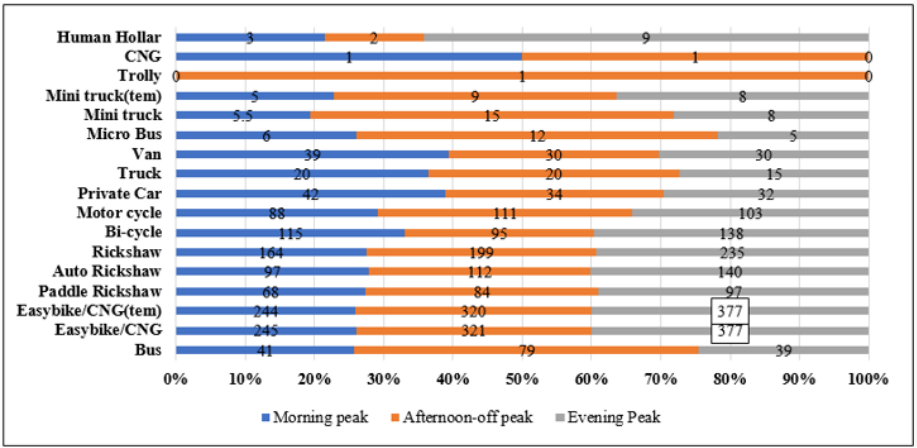
Talaimari to Vodra: Majority of vehicles in this lane congested during evening. Dominant vehicle is easy bike (temp) which amount is 390 vehicles/hour found at evening. Less influenced vehicles are micro bus, mini truck, mini truck (temp), trolley, CNG, human holler Figure 18,19.Vodra to Talaimari: Highest concentration of vehicle is 441 vehicle/hour found at evening. Second dominant vehicle is easybike/CNG (temp) which is nearer to first dominant vehicle. Moderate dominant vehicles are paddle rickshaw, auto rickshaw, rickshaw, bicycle, motor cycle, private car and their percentage as well as amounts are 31% & 57, 32% & 87, 31% & 139, 40% & 116, 31% & 91, 47% & 45 at morning, 30% & 56, 30% & 82, 30% & 136, 22% & 69, 31% & 91, 35% & 34 at afternoon off peak respectively. Rest of the percentage that is most vehicles congested during evening. Less influenced vehicles are micro bus, van, mini truck, mini truck (temp), trolley, CNG and human holler Figure 20.
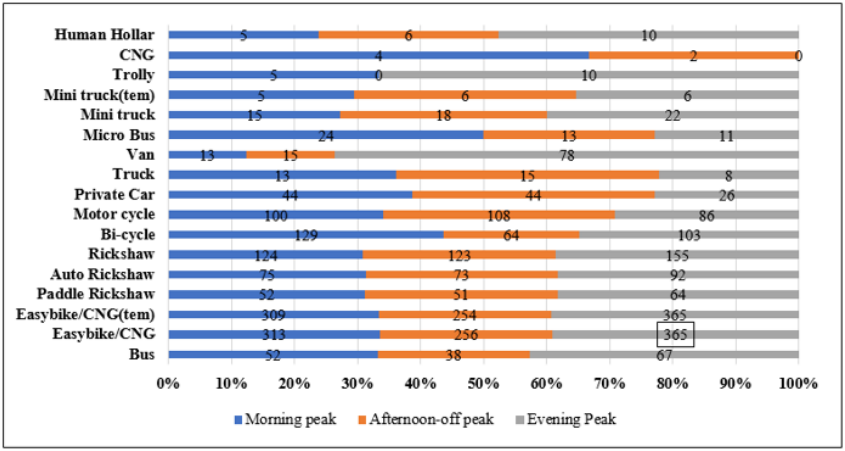
Padma R/A to Vodra: First dominant vehicle is easy bike/ CNG and its concentration is maximum at afternoon off peak. Second dominant vehicle is easy bike/CNG (temp). Concentration of vehicles those are exist in less amount in these lanes are human holler, CNG, trolley, mini truck(temp), micro bus, van, truck and private car. Moderate concentration of vehicles that occupied in this lane are paddle rickshaw, rickshaw, auto rickshaw, bi cycle, motor cycle Figure 21 (Tables 6 & 7).
Rail gate to Vodra: Highest concentration of vehicles in this lane are easy bike/CNG and easy bike/CNG (temp) and contained same amount. Concentration was maximum at evening in case of both types of vehicles. Less concentration of vehicles are human holler, CNG, trolley, mini truck, micro bus, van, truck, private car. Moderate concentration of vehicles are paddle rickshaw, auto rickshaw, rickshaw, bi cycle, motor cycle Figure 23.
Vodra to rail gate lane: This lane also follows previous two lanes Railgate to Vodra, Vodra to Padma R/A Figure 24.
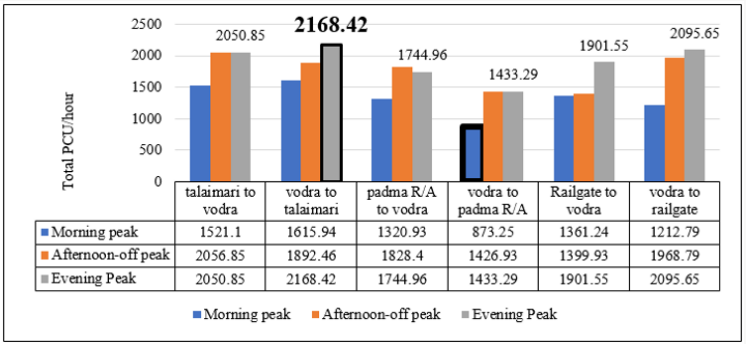
Temporal Variation of Different Legs: Concentration of volume in case of Vodra to Talaimari lane was high at evening peak. All lanes have highest PCU/hour at evening peak except Vodra to Talaimari lane. The lowest PCU/hour was 1426.93 found in Vodra to paddma R/A during morning peak Figure 25.
Level of Service
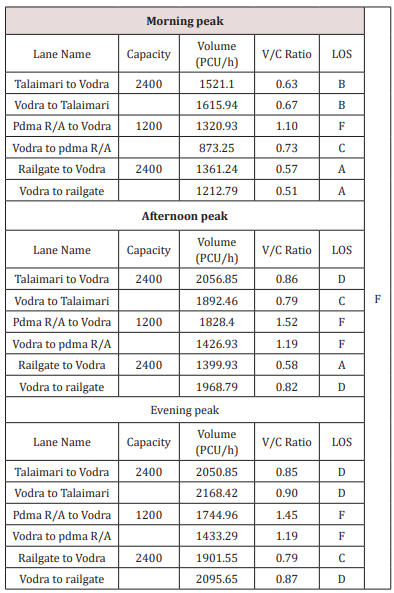
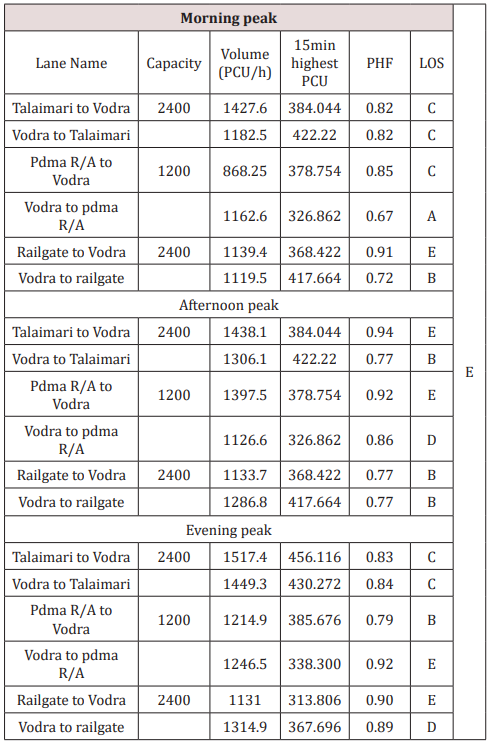
V/C Ratio Method: The volume of Vodra to Padma R/A lane, Padma R/A to Vodra, are higher thancapacity during three peaks. The highest LOS of Vodra intersection is F by following V/C ratio Table 8. LOS identified by PHF was E. Vodra to Padma R/A, Railgate to Vodra, Talaimari to Vodra contain highest LOS at evening, morning and afternoon off peak respectively. The final LOS in this intersection is F Table 9.
Dissuasion
Causes of Congestion in Intersection
Moni-chottor intersection plays as a main commercial hub of Rajshahi city. This is the main reason of rising auto-rickshaw volume in Moni-chottor intersection. Traffic flow in afternoon off-peak is higher than other two peak hours. This is may be due to Monichottor intersection is located near educational zone. The factors for greater traffic flow from Zero point to Intersection is the land use containing important establishments like Rajshahi Collegiate School and College, Rajshahi College, a large Kaccha Bazar, Janata Bank Corporate Bank, etc. As the effective carriageway width is only 12 feet, the LOS of these two lanes is F. Less rent and quickly reached in destination are one of the major reason to get the majority and popularity of increase amount of auto-rickshaw [3]. Some probable reasons behind the fascination of using CNG by operators as well as passengers were investigated. Attractive advantages like Reduction of maintenance cost, emissions of 20-30% fewer greenhouse gas, environmentally friendly behavior, superior to petroleum-based products diverted and motivated the operators to use such type of vehicles [33].Effect of Congestion in intersection
One of the major disadvantage is uncontrolled or non-signalized intersections. This is also known as priority-controlled intersection. It provides no indication to the driver’s concern when vehicle approaches to enter the intersection [34] Low priority movement on minor roads cause delay that influence the performance of such type intersection very strongly. As a result, vehicular conflict creates which is responsible for accident and congestion [35]. LOS of three intersections was F. Level of service F means in an intersection vehicle are forced to move and speed of vehicles are too low [36]. Commercial and educational activities around Monicottor intersection attract people so why LOS of Monicottor is very low. Again, all the vehicles pass this intersection very slowly. In recent time traffic jam happens in this intersection. Few lanes contain higher flow rate than their required capacity. If traffic flow equals or less than capacity Collision between vehicles, low mean speed, frequent unexpected stoppage will occur [37]. Congestion occurs due to excess traffic demand and inefficient road operations [38].Accidents Data Analysis in Rajshahi City due to congestion in intersection
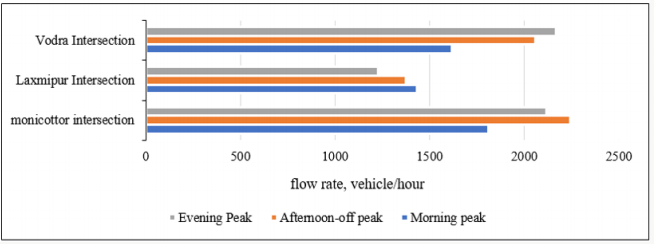
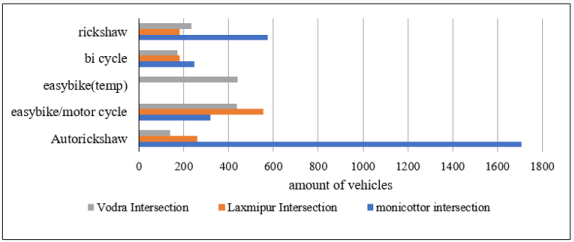
Several tremendous accidents occur in Rajshahi city due to non-signalized intersections. At Dayingpara intersection on Chapainawabganj-Rajshahi road, a truck ran over a truck helper [39]. At Northern intersection under Talaimary area, A truck and an auto-rickshaw collided and two peoples on spot [40]. A bus plunged into a roadside ditch at Kadirpur Jamadarni intersection in Godagari upazila of Rajshahi and result at least 25 peoples were injured [41]. One was killed and another other one was injured near Mohonpur police station intersection in Rajshahi [42]. By sandwiching between two trucks uncle and his nephew killed at at Talaimari intersection in Rajshahi city [43-45].Flow rate of vehicle is maximum at monicottor at three peaks. Second one is Vodra intersection. Lowest peak was observed at Laxmipur intersection among all Figure 26. By inspecting selected intersections, the major or dominant vehicle is auto rickshaw in monicottor. That’s why, this is the more congestive intersection. The influence of easybike (temp) only dominant in Vodra intersection. Second dominant vehicle is easy bike or motor cycle Figure 27.
Conclusion
For more Lupine Publishers Open Access Journals Please visit our website:
https://lupinepublishersgroup.com/
For more Open Journal of Civil Engineering go through the below link:
https://lupinepublishers.com/civil-engineering-journal/
To Know More About Open Access Publishers Please Click on Lupine Publishers


No comments:
Post a Comment
Note: only a member of this blog may post a comment.