Lupine Publishers- Environmental and Soil Science
Abstract
This study aims at assessing the subsurface soil properties of
contaminated sites in parts of the Niger Delta with a view to
providing basic data that would guide not only future development and
construction in the region but in choosing remediation
options for contaminated sites. Standard soil sampling and analytical
methods were employed in the study. Soil moisture content
values range from 5.2 to 97. 9 with spikes at Okrika OKR-CTRL and
BM-CTRL probably due to shallow water table encountered at
shallow depth of 2.0 m. While the average moisture level at contaminated
sites was 20.08 while that of the control sites was 17.
85. The variation also suggests higher water retention potential of
contaminated soils against normal clean soil which in essence
will enhance contaminant persistence in the soil. The soil pH value for
control sites tends to normal range i.e towards 7.0, while
the values for impacted sites are slightly lower. Most samples had
normal soil pH ranges except BM-SS1 which indicated acidic soil
conditions with ranges of 4.5-5.8. Liquid Limit is higher for control
samples than contaminated sites at Okrika, Ogu-Bolo, Bomu
manifold and Norkpo while Liquid Limit value for impacted site at Sime
is higher than the control site and similar for Nonwa sites.
This variation could be as a result of the impact of the contamination
on the soil. The plastic limit is highest at BM-SS, OGB-SSOKRSSNOR-
SS and lowest at SIM-CTRL, NOW-CTRL, NOW-SS, OGB-CTRL and BM-CTRL.
Generally, hydrocarbon contamination decreases
liquid limit, plastic limit and Plasticity index of the soil. There is a
generally slight reduction in porosity values at the impacted sites
as compared with the control sites. The soil profile across the study
area grade from fine silty sands to fine gravel sand and the soil
profile up to depth of investigation were generally dominated by silts,
sands and sandy clay in different proportions. Following this,
stoppage of infiltration of liquid hydrocarbon product and movement of
contaminated water through it will continue unhindered.
Introduction
There has been extensive oil contamination of swamp, rivers,
creeks and groundwater in Ogoniland [1-3]. The contamination
levels were high enough to cause significantly severe effects on
human health and the ecosystem [4-6]. It is reported that surface
waters had extractable petroleum hydrocarbons (EPHs) (>10-C40)
concentration of up to 7420μg/l, found in drinking water wells and
9000 μg/l benzene in groundwater [7]. These values are 900 times
higher than the WHO guidelines of 2009. Sediments had as high
as 17, 900mg kg−1 EPH concentrations with Polycyclic aromatic
hydrocarbons concentrations values recording 8.0mg kg-1, in
most of the samples analysed. The UNEP [1] assessment reported
that the effects of the contamination have destroyed mangrove
areas. Climatic conditions are favourable for natural degradation
of petroleum hydrocarbon contaminants however continuous
re-pollution has prevented quick environmental regeneration
[8,9]. Effective determination of contaminated sites can only be
achieved with adequate knowledge of the interplay of site-specific
factors such as geology, nature of the contaminant, pathway
receptors linkages, toxicity levels and deployment of appropriate
contamination management techniques and legislation [10-13].
The challenge of development to poor soil conditions, a
situation which has escalated project cost and as a consequence
impeded development (NDES, 1995) [14]. The understanding
the interplay of the geomorphology, geology and the engineering
behavior of the soils in the region is critical [15-17]. The slow
physical development of the Niger delta region has been a major reason
for youth restiveness, with its ramified impacts on crude oil
production levels, security, employment, etc. This study therefore
investigates the geotechnical behavior of soils.
The Study Area
The Niger Delta has spread across a number of ecological zones
comprising sandy coastal barriers, brackish or saline mangrove,
freshwater and seasonal swamp forests. The Niger Delta consists of
three diachronous units, namely Akata (oldest), Agbada and Benin
(youngest) formations. The Benin Formation (Oligocene to Recent)
is about 2100m thick at the basin centre and consists of medium
to coarse grained sandstones, thin shales and gravels [18]. The
hydrogeology of the area at different times has described the Benin
Formation as a highest yeilding water bearing zone of the area [19].
Overlying the 40m-150m thick Quaternary deposits, the Benin
Formation consists of sequences of sands and silty clay alternating
which later become increasingly prominent seawards [20]. Based
on strata logs in the area, described the aquifer in the area as a stack
of alternating aquifers lying upon each other in a multiple fashion
such that the uppermost ones are mostly unconfined and underlain
by the confined aquifers [21].
The Niger Delta has two most important aquifers, Deltaic and
Benin Formations. With a typically dendritic drainage network,
this highly permeable sands of the Benin Formation allows easy
infiltration of water to recharge the shallow aquifers. Nwankwoala
et al. [22] described the aquifers in this area as a set of multiple
aquifer systems stacked on each other with the unconfined upper
aquifers occurring at the top. Recharge to aquifers is direct from
infiltration of rainfall, the annual total of which varies between
5000mm at the coast to about 2540mm landwards. Groundwater
in the area occurs in shallow aquifers of predominantly continental
deposits encountered at depths of between 45m and 60m. The
lithology comprises a mixture of sand in a fining up sequence,
gravel and clay. Well yield is excellent, with production rates of
20,000 litres/hour common and borehole success rate is usually
high [23]. Across the area, measures transmissivity varies from
59 to 6050m2/d, Hydraulic conductivity from 0.04 to 60m/d and
storage coefficient from 10-6 to 0.15 [24]. Surface water occurrence
includes numerous networks of streams, creeks and rivers.
Groundwater recharge system in the study area is sourced from
direct precipitation with an annual intensity of as high as 2000 –
2400mm. Water permeates the Benin formation sands to recharge
the aquifers. The multi-layer aquifer system has shallow unconfined
aquifers at the upper limit of the geologic units providing most of
the domestic water needs of the communities’ inhabitants [6]. The
water table in the area is between 0.7m to 3.5m depth and fluctuates
with the prevailing land profile and season [1,25]. These aquifers
are therefore vulnerable to pollution from a range of contaminants
ranging from, hydrocarbon contaminant plumes, solid wastes and
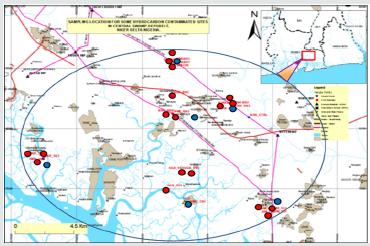
leachates [26,27] (USEPA, 2009) (Figure 1).
Materials and Methods
Location and sample point positions were gotten with use of
a hand held Global Positioning System device (GPS). Soil samples
were collected from hand augered holes at depths of 1m, 2m,
and 3m. Soil samples were duplicated while the National and
international standards and methods were used during sample
analyses using competent personnel and the right equipment
and materials. The geographical position of the sample point is
established and read off using a GPS device and recorded. Discrete
Soil Samples were collected using the grab method with aid of a
hand auger and water samples were also collected from boreholes
drilled using percussion drilling methods. The investigation
comprised drilling of 4 boreholes by cable percussion, recovered of
samples and borehole logging.
Cable Percussion Boreholes
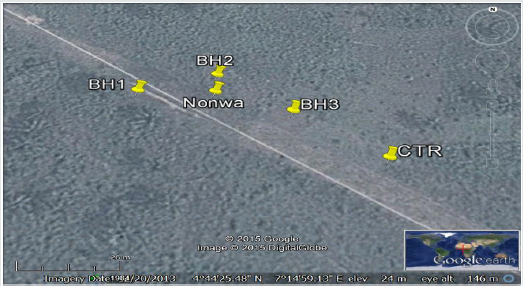
Four (4) Cable percussion boreholes were designed e.g NOWBH1,
NOW-BH2, NOW-BH3 and NOW-CTR for drilling at the 4
locations - Nonwa, Sime, Norkpo and Bomu sites respectively
to depths of 10m below existing ground level (bgl). Standard
cable percussion boring equipment was used to produce 150mm
diameter boreholes. Clean drilling techniques were employed
at the sites, including the use of casing made the ground and any
contaminated underlying strata in each borehole in order to avoid
cross-contamination. Detailed records of the cable percussion
boreholes have been produced in accordance with national and
international standards. Details of the borehole installations were
provided on the respective borehole records as appropriate.
Geotechnical Samples
Samples for geotechnical analysis were collected in aluminium
plates. This was done to ensure the integrity of the samples. The
device uses an exclusive two-probe measuring system which allows
both probes to be inserted into the same depth in the soil and allows
the metals to be exposed to the same amount of soil providing the most effective way to consistently and properly measure soil
pH. The pH was then read on the calibration and recorded. The pH
and moisture meters are made of sensitive tips with and sampling
devices were washed with sterilized water after each measurement.
The Moisture Meter is a Brass soil moisture probe with an eightinch
metal stem and Meter with 0 -10 calibrations mounted on
top. The probe has a sensor at the tip and penetrates to root level.
The moisture reading is then indicated is read off at the tip of the
pointer needle and recorded. The analytical procedures adopted for
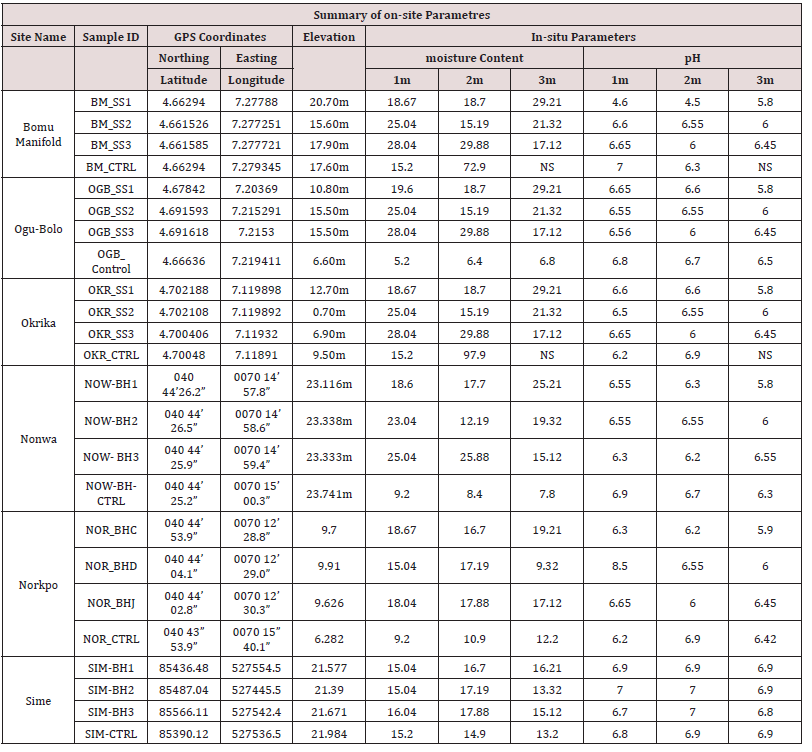
the various parameters are APHA methods (Figure 2) (Table 1).
Discussion and Results
Soil Geotechnical Analysis
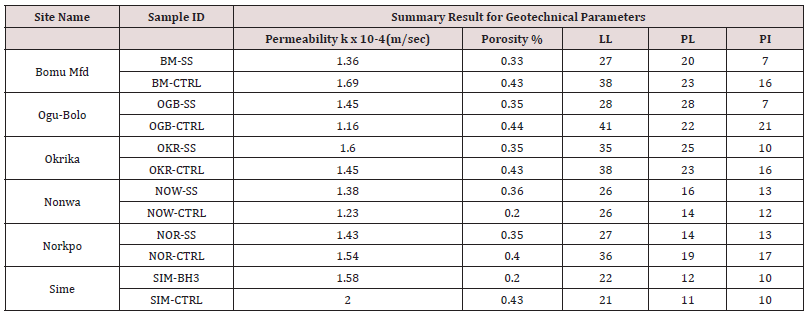
(Table 2) Hydrocarbon products when released to the
environment are hazardous to the ecosystems [7]. Although
it is naturally insoluble in water, it can infiltrate the soil and
contaminate the groundwater. Some of the trapped hydrocarbons
clog within the voids and pore spaces, making it difficult and costly
to remove. These chemicals degrade the soil engineering properties
and hence distort the soil behaviours. The controlling factors for
soil-water system behaviour is controlled by (i) the quantity and
type clay mineral (ii) nature of pore fluid, (iii) associated anions
and cations (iv) organic matter. Almost all soil Properties are
affected by Soil-waste interactions basically due to ion exchange
or nature of pore fluid. However, it is better to consider the effects
of the pollutants independently for better understanding owing to
the complex nature of the effects. The effects may differ based on
soil type. Pollutants have different effect on different clayey soils
and these pollutants are considered based on index properties
and Permeability. Atterberg limits, permeability and porosity will
be discussed based on their role in contaminant transport and
persistence in contaminated media (Table 3).
Soil Moisture Content
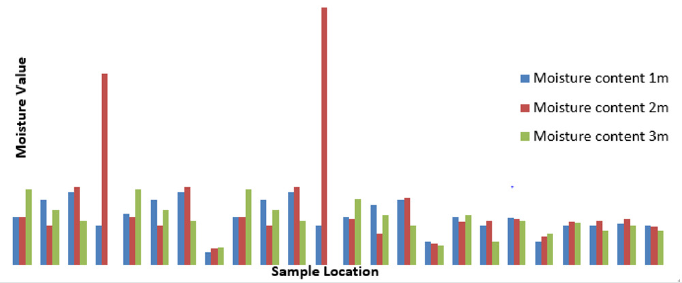
Soil moisture content values range from 5.2 to 97.9 with spikes
at Okrika OKR-CTRL and BM-CTRL probably due to shallow water
table encountered at shallow depth of 2.0 m. While the ave moisture level at contaminated sites was 20.08 while that of the
control sites was 17.85. This slight difference in moisture could
have resulted from the introduction of the fourth phase on the
soil structure which possible gave rise to more water molecules
adhering unto the soil grains and in effect creating an atmosphere
for chemical reactions to take place in the soil. The variation
also suggests higher water retention potential of contaminated
soils against normal clean soil which in essence will enhance
contaminant persistence in the soil. Table 2 and Figure 3 show the
variation of moisture across various sites and depths.
Soil pH
Soil acidity or alkalinity is measured using a pH scale. The device
is calibrated on 0 - 14 mangitude, with 7 as the midpoint or normal.
The smaller the values indicate higher levels of acidity while higher
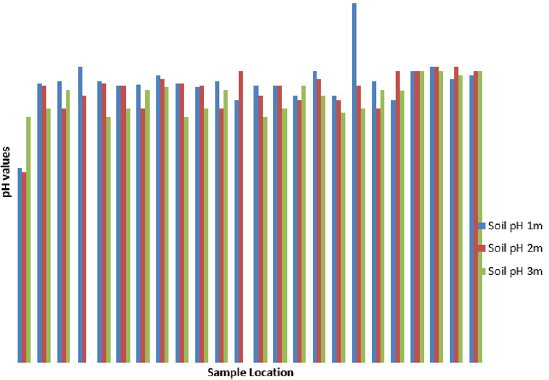
values i.e above 7, indicates increasing alkaline conditions (Table
4) (Figure 4). Bioremediation processes are significantly affected
by Soil pH levels just like soil properties (physical, biological
and chemical) and processes. Reduced microbial activities in
contaminated soil for instance imply persistence of hydrocarbon
contaminants in such soil [28]. Low pH leads to decrease in
nutrition, growth, and yields of most crops. These factors improve
as optimum pH levels are restored. Optimal pH range is between
5.5 and 7.0. Some plant however can adapt to pH ranges outside
of the normal range. As shown in Figure 4 the soil pH values for
control sites tends to normal range i.e towards 7.0 while the values
for impacted sites are slightly lower.
Most samples had normal soil pH ranges except BM-SS1 which
indicated acidic soil conditions with ranges of 4.5-5.8. Formation of
acid soils can be due to any of several processes which may include
use of fertilizer, activity of plant root, rainfall and the weathering
of soil minerals etc. At a petroleum impacted site as observed BHSS
(Figure 4), pH readings tend to strong acidity probably due to
history of prolonged hydrocarbon contamination (Zihms, et al.,
2013). Small changes in pH values can induce severe changes in the
sensitive biochemical environment thereby altering biological and
chemical processes.
Atterberg Limits
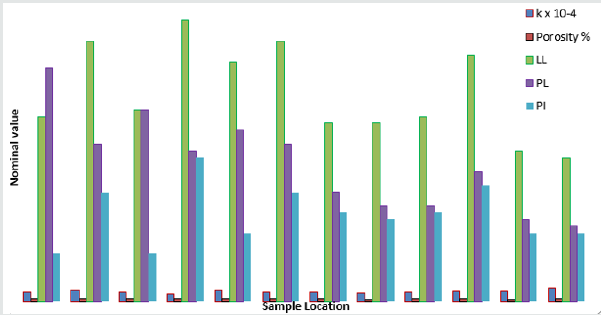
As shown in Figure 5, the general reduction in the Atterberg
Limits values for the contaminated sites compared with the values
at control sites. This is most likely the result of the soil degradation
due to contamination at the sites. Liquid Limit is higher for control
samples than contaminated sites at Okrika, Ogu-Bolo, Bomu
manifold and Norkpo while Liquid Limit value for impacted site at
Sime is higher than the control site and similar for Nonwa sites. This
variation could be as a result of the impact of the contamination
on the soil. It implies that the impacted soil has less ability to hold
water than the clean soil, the flow and movement of contaminants
in impacted soil will therefore be easier and faster than clean soil.
The plastic limit is highest at BM-SS, OGB-SSOKR-SSNOR-SS and
lowest at SIM-CTRL, NOW-CTRL, NOW-SS, OGB-CTRL and BMCTRL.
Generally, hydrocarbon contamination decreases liquid limit,
plastic limit and Plasticity index of the soil.
Porosity
From Figure 5, Porosities and permeability values at impacted
sites are generally lower than control sites. Permeability at BM-SS is
lower than BM-CTRL and may be as a result of the much soil agitation
due to ongoing remediation works at the time of the investigation.
The impacted sections of the site have suffered some distortions and
so is the soil profile. There is a generally slight reduction in porosity
values at the impacted sites as shown in Figure 5 compared with
the control sites. These reductions may be attributed the effects of
the crude oil contamination. The control sites BM-CTRL, OKR-CTRL,
NOR-CTRL and SIM-CTRL showed higher permeability values than impacted sites. These changes in soil characteristics have the
capability of determining the behaviour of contaminants in the soil.
Particle Size Distribution
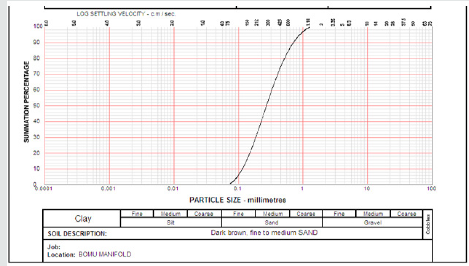
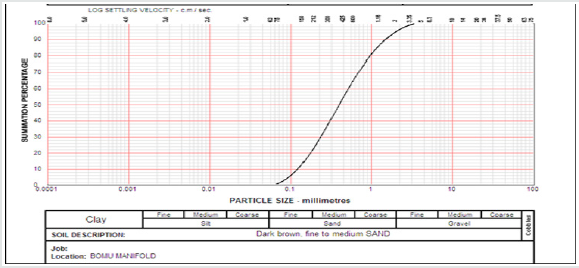
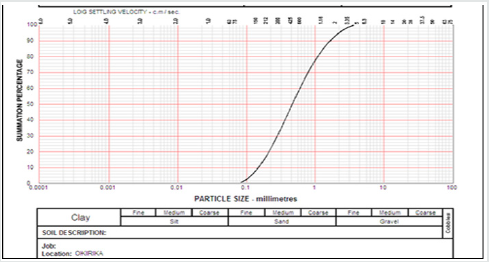
The grain sizes of soils in the area are poorly graded, from fine
sands of 0.07mm sieve sizes to fine gravel sizes of 4mm sieve sizes.
(Figures 6-8). This grading is typical of beach sands. The grain
distribution increases as one moves towards the sea from Norkpo to
Okrika indicating that the ease of contaminant infiltration into the
subsurface will as well increase in that order owing to increasing
permeability of the soil.
Atterberg (Consistency) Limits
The Atterberg Limits are generally lower in the impacted
samples as shown in Figure 5. Liquid limit values for impacted
soils range from 22-35 and control sites values fall between 21-41;
Plastic limit is 12-28 for impacted and 11- 23 for control, Plasticity
index is 7-13 for impacted and 10-16 for control sites. This is an
indication of alteration due to the presence of contaminants in the
impacted samples.
Soil Profile
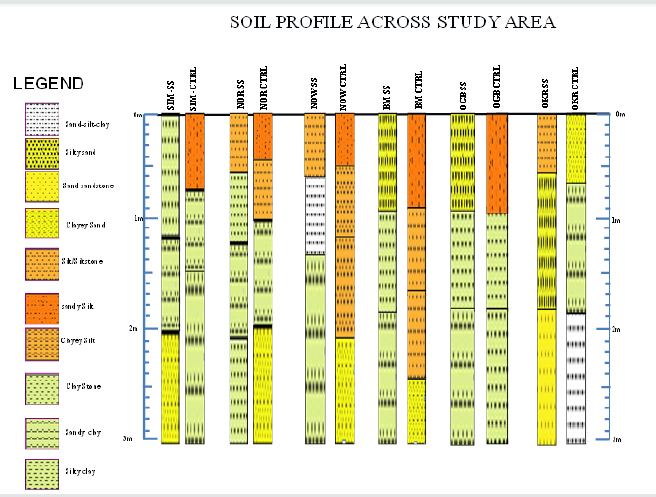
The soil profile across the study area grade from fine silty
sands to fine gravel sand. The soil mixtures were as varied across
the sites as shown in Figure 9. However, the soil profile up to depth
of investigation is generally dominated by silts, sands and sandy
clay in different proportions. This kind of soil will not be able to
stop infiltration of liquid hydrocarbon product and movement of
contaminated water through it will continue unhindered.
Conclusion
This study revealed that the soil moisture content values range
from 5.2 to 97. 9 with spikes at Okrika OKR-CTRL and BM-CTRL
probably due to shallow water table encountered at shallow depth
of 2.0 m. This slight difference in moisture could have resulted
from the introduction of the fourth phase on the soil structure
which possible gave rise to more water molecules adhering unto
the soil grains and in effect creating an atmosphere for chemical
reactions to take place in the soil. Most samples had normal soil
pH ranges except BM-SS1 which indicated acidic soil conditions
with ranges of 4.5-5.8. At a petroleum impacted site as observed
BH-SS, pH readings tend to strong acidity probably due to history
of prolonged hydrocarbon contamination at the site. Liquid Limit
is higher for control samples than contaminated sites at Okrika,
Ogu-Bolo, Bomu manifold and Norkpo while Liquid Limit value for
impacted site at Sime is higher than the control site and similar for
Nonwa sites. This variation could be as a result of the impact of the
contamination on the soil.
The plastic limit is highest at BM-SS, OGB-SSOKR-SSNORSS
and lowest at SIM-CTRL, NOW-CTRL, NOW-SS, OGB-CTRL
and BM-CTRL. Generally, hydrocarbon contamination decreases
liquid limit, plastic limit and Plasticity index of the soil. There is a
generally slight reduction in porosity values at the impacted sites
as compared with the control sites. The grain sizes of soils in the
area are poorly graded, from fine sands of 0.07mm sieve sizes to
fine gravel sizes of 4mm sieve sizes. The soil profile across the
study area grade from fine silty sands to fine gravel sand. The soil
mixtures were as varied across the sites. However, the soil profile up
to depth of investigation is generally dominated by silts, sands and
sandy clay in different proportions. This kind of soil will not be able
to stop infiltration of liquid hydrocarbon product and movement of
contaminated water through it will continue unhindered. Regular
soil monitoring is recommended.


No comments:
Post a Comment
Note: only a member of this blog may post a comment.