Thursday, 31 October 2019

Lupine Publishers | Response of Sandy Soil Stabilized by Polymer Additives


Lupine Publishers- Environmental and Soil Science Journal


Abstract

Traditional sandy soil stabilizers such as lime cement, fly ash and bituminous materials, etc., usually require long curing time. Hence now a day, polymer stabilizer is used more extensively because of its stable chemical property and shorter curing time. For the developing organization, it is important to judge the performance of stabilized soil during its developing stages only. This paper aims to highlight a quick and easy test to evaluate the mechanical performance of such polymer based stabilized soil. For this study, three different kinds of polymer stabilizers at developing stage were evaluated against a market ready product. The analysis of the test result include a comparison of the strength, moisture loss rate and strain energy under different curing time, polymer type, polymer additive amount and test conditions. This study shows that the strength of the stabilized sandy soil is significantly increased both under wet and dry conditions by using the polymer additives. With the procedure mentioned in the paper it was easier to identify the relative merits and demerits of each product.

Introduction

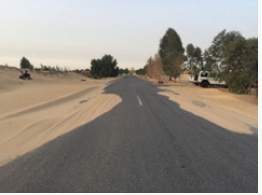
In the desert areas, large amount of soil is lifted by wind, the road is covered by the soil as shown in Figure 1, therefore, soil stabilization is important for road capacity. Soil stabilization is the alteration of one or more soil properties, by mechanical or chemical means, in order to maximize the suitability of soil for a given construction purpose by improving in-situ soil properties. Soils may be stabilized to increase engineering properties like strength and durability; or to diminish erosion and dust generation. The stabilized product should not only enhance desired soil properties, but they should also create a soil material/soil system which can sustain for the design life of the project, under designated load application. In the field application, the polymer dilution is sprayed normally into the loose soil. After polymer dilution penetrates into the soil, compaction of the “wet” soil is carried out. The stabilized soil gains strength after water evaporates from its soil mix. Traditional stabilization of soil relies on cement, lime, fly ash, and bituminous [1-3] material. As the scientists and researchers are developing new engineering materials, many non-traditional materials are available for soil stabilization, for examples polymer emulsion, acids, enzymes and tree resin emulsions [4-7]. As compared to the traditional stabilizers, these stabilizers have the following advantages:
Figure 1: Road covered by sand.
lupinepublishers-openaccess-journal-environmental-soil-sciences
a) Stable chemical properties;
b) They produce less swelling and heaving [8,9];
c) Produce less pollution; and
d) They save natural resources.
Apart from above mentioned benefits another advantage is that the liquid concentrate can be diluted with water and thus it is easy to achieve target additive amount by controlling dilution ratio. In many countries, large percentages of roads and parking lots are unpaved. The vehicles and wind together with the loose soil create dust that are known for adverse environmental and human health impact. Apart from increasing the strength of the soil these stabilizers can also be used as a way for controlling dust. For the ease of transportation and storage these Polymer emulsions can also be prepared in the form of powder. Before field application it is important for the industries to understand the mechanical properties of stabilized soil primarily during development phase of the product. Thus, the main objective of this paper is to highlight a quick and easy way to evaluate the mechanical performance of such stabilized soil before actual field application. Such assessment will quickly provide them a guide to modify their product if at all needed. For a comparison study, three in development products from the same company namely a) L13126; b) L13140; c) L13142 and one a market ready “Product A” is chosen, all as anonymous reference products. Overall, they constitute three polymer emulsions and one polymer powder type as described later in the paper. Goals within the scope of this paper include the following:
a) In detail description of sample preparation
b) To evaluate the property and suitability of the sandy soil before the addition of stabilizer developed by chemical polymerization techniques
c) To evaluate the property and suitability of the sandy soil after the addition of the stabilizer
d) To investigate the influence of the mechanical properties of the sandy soil with the polymer emulsion (in terms of mix proportion, percentage of stabilizing additive, water content and permeability of the stabilized soil matrix)
e) To demonstrate the influence of the emulsion types, curing time and wetting condition on the mechanical response of the stabilized soils
f) At last, present a relative ranking of various soil stabilizer products
The outcome of the tests is analyzed in terms of unconfined compressive (UC) tests. It is hereby noted that other tests such as California Bearing Ratio (CBR) [10,11], triaxial (confined and unconfined), resilient modulus, and cyclic wet dry tests are also valid tests to investigate the performance of the stabilized soils. However, for a rapid screening of stabilizers, the UC test was preferred. In this investigation, the compacted stabilized sandy soil samples were ‘cured’ under controlled temperature and humidity conditions before the soaked and un soaked unconfined compressive strength (UCS) tests were performed.

Material and Method

Materials Used

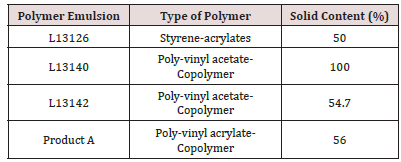
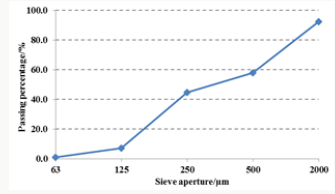
Four different kinds of stabilizers were used in this study, three polymer emulsion type namely: L13126, L13142 and Product A and one powder polymer type namely: L13140. Table 1 lists the polymer type and solid content of individual emulsion type, which was obtained by drying a known weight of emulsion in the oven at 1050C to a fixed weight. The sandy soil samples which contain 10% china clay and 90 % sand were considered which more or less represent a dust prone unpaved soil road. The sand used in this research is natural sand in Netherland, the gradation is showed in Figure 2.
Table 1: Polymer stabilizer type and polymer solid content
lupinepublishers-openaccess-journal-environmental-soil-sciences
Figure 2: Sieving test result of natural sand.
lupinepublishers-openaccess-journal-environmental-soil-sciences

Specimens Preparation

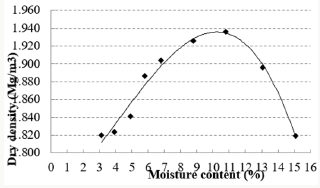
In order to perform compression tests, cylindrical specimens of 100 mm diameter and 150 mm height were prepared. The optimum moisture content of the sandy soil without stabilizer was measured by the modified proctor method (ASTM D1557). Figure 3 shows the result of modified proctor test. From the plot of the Figure 3, it can be observed that the optimum moisture content of this sandy soil is about 10.3%. With the known optimum moisture content and the known maximum dry density of the sandy soil, gyratory compactor was utilized (at 600kPa vertical stress, 30 gyrations/ min and 1.250 tilt angle) for the preparation of specimens. In order to mix the polymer stabilizer and soil uniformly, the stabilizer concentrate was diluted in the water before putting it into the sandy soil mixture. The dilution ratio was based upon the optimum moisture content and the amount of stabilizer used. For providing enough space for the polymer concentrate in the soil matrix, the stabilizer amount and the amount of water to be added is calculated on the basis of the optimum moisture content i.e. 10.3%. The actual density of polymer emulsion was assumed to be 1Kg/L. The preparation of sample was carried out in following six steps: soil preparation, additive preparation, soil-additive mixing, moulding, compaction, curing. The soil was mixed for five minutes before the addition of dilution. The amounts of added stabilizer were 14L/m3 (i.e. 1 m3 compacted soil contains 14L stabilizer concentrate), 19L/ m3 and 24L/m3 respectively. The dilution ratio was calculated by the following equation:
Figure 3: Modified proctor test result.
lupinepublishers-openaccess-journal-environmental-soil-sciences
where: R: dilution ratio
x: optimum water content (%)
y: maximum dry density of soil (Mg/m3)
z: amount of adding polymer (L/m3)
ρ: the density of stabilizer in the test temperature (Mg/L)
Assuming the depth of penetration in pavement to be 15 cm, the amount of addition of stabilizer i.e. 14L/m3, 19L/m3, 24L/m3 is equivalent to 2.1L/m2, 2.85L/m2, 3.6L/m2 respectively. After the soil and additive preparation steps, the dilution was mixed with sandy soil by using rotary mixer, until a uniform mixture was achieved. The specimen was prepared by using a gyratory compactor mould of 102 mm diameter and 254 mm height. The material was placed in three layers in the mold and each layer was compacted with rod for 25 times in order to get a uniform specimen. After molding step, the sample was placed in the gyratory device and compacted until the height of the sample was reduced to 150 mm. The compacted sample was then extruded from the gyratory mould by the hydraulic jack extrusion device mounted on the gyratory machine. The compacted sample was then placed in the curing room at 200C and 40 percent relative humidity. In order to simulate the field condition, air-dried curing process was used. Each sample was weighed after 3 days, 7 days, 14 days, 21 days, and 28 days to get the moisture loss rate.

Unconfined Compression Test

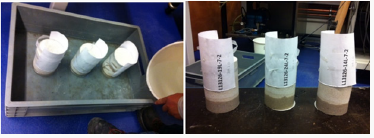
The sandy soil samples stabilized with the different type and number of additives were tested by using unconfined compression (UC) setup under soaked and un soaked conditions. In the soaked UC test, the dry sample was placed in the 25 mm deep water bath for 15 minutes and after removing it from the water it was drained for 5 minutes. Then the soaked samples, as shown in Figure 4, were tested. The soaked UC test reflects the influence of moisture on the strength reduction of the stabilized soil in the field condition.
Figure 4: Samples soaked in the water bath.
lupinepublishers-openaccess-journal-environmental-soil-sciences

Permeability Test

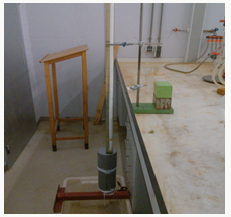
Permeability test was conducted to evaluate the capability of the stabilized soil samples to allow the water pass through it. The falling water head setup, see, is used for measuring permeability of the sandy soil samples with different types and amounts of the additives. In this test a sample is connected to a standpipe which provides both the water head and the means of measuring the quantity of water flowing through the sample. The permeability value is calculating by using the following formula:
Where: Kt: permeability(m/s)
a: cross section area of used manometer tube (cm2)
A: cross section area of sample in permeameter cell (cm2)
t: measured time interval (s)
L: length of sample (cm)
h1: start level manometer tube distance above overflow level (cm)
h2: end level manometer tube distance above overflow level (cm)
The parameters a, A, L were calculated on the basis of geometry of the samples and the manometer tube. The test was carried out after the sample was fully saturated. After that, the water tube is filled to a prescribed starting level h1. After t seconds, the water head level 2 in the manometer tube is recorded. By using the equation mentioned above the permeability Kt is calculated. The procedure is repeated at least three times interval until the Kt value is constant.

Results and Discussion

Optimal Polymer Adding Amount

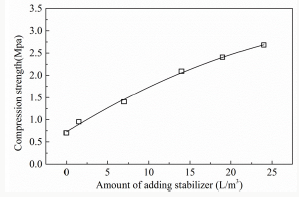
Preliminary test was conducted to get a reasonable amount of stabilizer quantity to be investigated, L13126 polymer was taken as an example, various additive amounts of 0L/m3 (pure water), 1.5L/ m3, 7L/m3, 14L/m3, 19L/m3 and 24L/m3 stabilizer quantity were examined. Figure 5 shows a plot of the additive amount versus UCS results after 28 days curing. As shown in Figure 5, the compression strength increases with stabilizer adding amount, it is expected that higher polymer content leads to thicker polymer matrix and more interaction between the soil particles, the compression strength increase almost linearly. It is hereby defined that “incremental strength” means the UCS of stabilized sample deducted by the UCS of samples with pure water. According to the Netherlands specification, the minimum UCS of bounded base layer shall be not less than 2MPa. Therefore, in this investigation, the incremental UCS value of 2 MPa was set as our minimum strength requirement. As can be seen from the prediction curve of Figure 5, the stabilized soil with 19L/m3 additive amount can reach 2 MPa. Therefore, the additive amount around 19L/m3 i.e. 14L/m3 and 24L/m3 and at 19L/m3 were investigated in the new test plan for all the polymer stabilizers.
Figure 5: Preliminary UCS test results.
lupinepublishers-openaccess-journal-environmental-soil-sciences

Polymer Adding Amount Effect

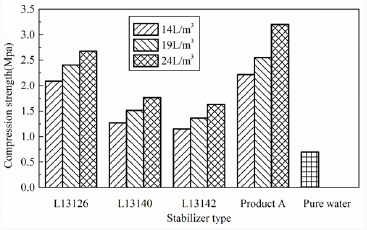
Figure 6 presents the UCS of sandy soil sample stabilized with different type and different adding amount after 28 days curing period. All the stabilized sandy soil demonstrated remarkable increase in UCS than the sample mixed with only pure water. The highest UCS value after 28 days curing period was found for Product A stabilized sandy soil which was higher than the sample stabilized by L13126. The L13140 and L13142 stabilized sandy soil show almost similar UCS values. However, as compared to the L13126 and Product A, these two stabilizers display lower UCS values. It is also noted hereby that UCS value increased with the increase in the stabilizer adding amount.
Figure 6: UCS values after 28 days curing.
lupinepublishers-openaccess-journal-environmental-soil-sciences

Wet and Dry Condition Effect

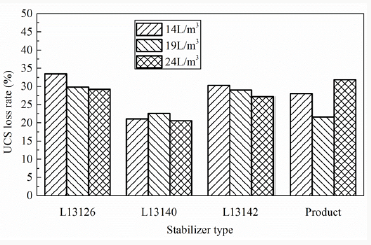
The soaked UCS of the sandy soil samples with pure water were not able to be tested because the samples disaggregated in the water bath. For comparison of moisture sensitivity of the samples, the strength loss rate of different stabilized samples was determined as Figure 7 In general, it can be observed that the strength loss rate decreases with the increase in the stabilizers amount, it indicates the thicker polymer coating will prevent moisture diffusion better. L13140 powder polymer specimens provide better water resistance to moisture deterioration and lose about 20% compression strength, the compression strength loss rate of others stabilizer specimens is about 30%. The specimens without stabilizer begin to disintegrate when they are placed in the water, and then lose load bearing capacity, the polymer can improve the water resistance of sandy soil.
Figure 7: UCS soaked loss rate after 28 curing days.
lupinepublishers-openaccess-journal-environmental-soil-sciences

Curing Time and moisture lose effect

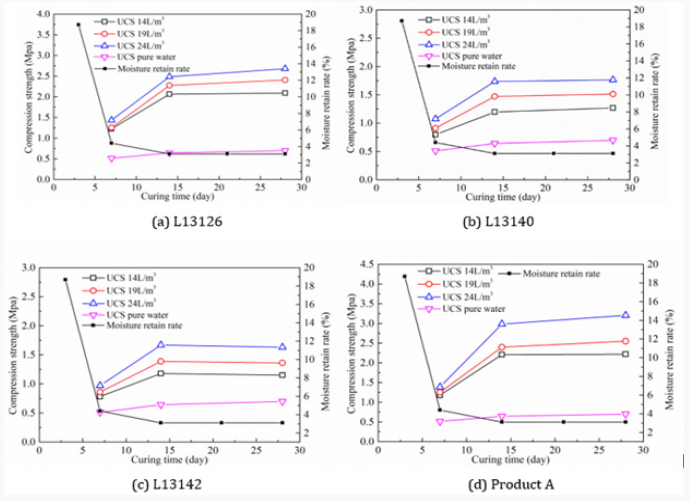
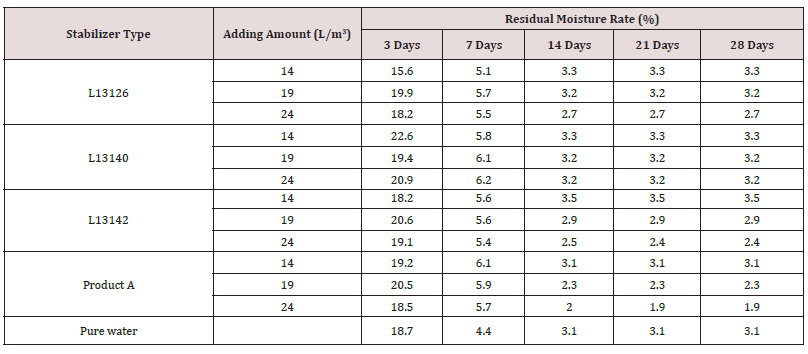
The effect of curing time on residual moisture rate is presented in Table 2, the value is based on the original water adding weight and the water loss weight. The samples were weighted after 3, 7, 14, 21 and 28 curing days, as shown in Table 2, the residual moisture rate became a constant, almost all the moisture has evaporated by the 14th day of curing for all the stabilizer specimens with different adding amount, the final value is not zero duo to the moisture loss in the mixture process. Comparing the values of specimens with stabilizer and pure water, the different is slight, it illustrates polymer do not affect the moisture evaporation. The moisture evaporates from the sample that will enhance the bonding between polymer and soil particles, the relation between compression strength and residual moisture rate are shown in Figure 8, duo to residual moisture rate decrease with curing time for all the specimens is similar, for brevity, the residual moisture rate result of pure water sample is taken as an example to compare with the compression strength variation. The sample with polymer stabilizers develop approximately 60% of the 28 days compression strength within the first 7 days of curing, however, the strength growth after 14 days curing period is not significant, the strength growth trend is similar to that of residual moisture rate decrease, this indicates that the gain in strength of the stabilized sample may only be related to the rate of moisture evaporation and not to any chemical reaction as normally observed in cementitious stabilized products.
Figure 8: Effect of curing time on compression strength.
lupinepublishers-openaccess-journal-environmental-soil-sciences
Table 2: Residual moisture rate.
lupinepublishers-openaccess-journal-environmental-soil-sciences
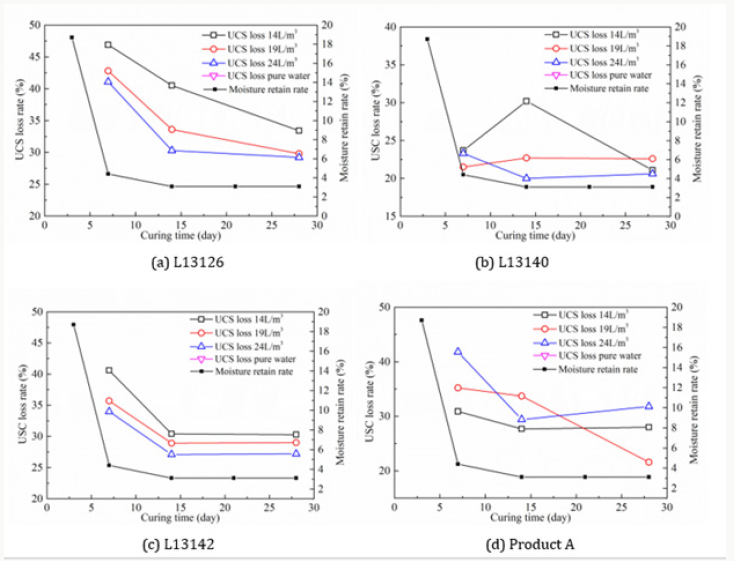
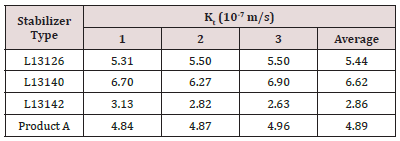
The moisture in the stabilized sample will influence the soaked UCS loss rate, the effect of curing time on USC loss rate is shown in Figure 9. In general, the USC loss rate decrease with the increase of curing time, the trend is similar to that of strength growth, it illustrates the sample with less moisture inside has a better moisture damage resistance. Samples utilized for permeability test were prepared in the same method as the ones used in the UC test (refer to “Specimens preparation” section). As shown in Figure 10, sample is kept inside the tube with no side flow allowed and the bottom 2 cm of the sample is utilized to apply silicon glue. After filling up the tube with water the test equipment is left for one day to be able to fully saturate the sample. The permeability test was carried out on the samples stabilized by L13126, L13140, L13142 and Product A with 19L/m3 additive amount, 3 replicates for each case, the permeability results are presented in the Table 3. It can be observed that all the sandy soil samples stabilized by the polymer stabilizers show lower permeability which is important for pavement surface layer to prevent rain water infiltration into the deeper part of the road foundation, soil stabilized by L13142 show highest permeability.
Figure 9: Effect of curing time on USC loss rate.
lupinepublishers-openaccess-journal-environmental-soil-sciences
Figure 10: Permeability test equipment.
lupinepublishers-openaccess-journal-environmental-soil-sciences
Table 3: Permeability test results.
lupinepublishers-openaccess-journal-environmental-soil-sciences

Implication and Discussion

Polymer is an environmental way for dust control and soil stabilization, as important as dust control, the mechanical and hydraulic property are also key points of polymer application, in this paper, mechanical and hydraulic property include three key indexes: UCS, soaked UCS loss rate and permeability, after 28 curing days, the moisture evaporate from the stabilized soil, the specimens become stronger and have a lower UCS loss rate. Unfortunately, there are no significant relation between the three indexes for all the polymers, the highest UCS is product A, the lowest UCS loss rate is L13140, and the lowest permeability is L13142, therefore it is hard to find a polymer with higher UCS, lower UCS loss rate and lower permeability, for the application, field condition, strength requirement and cost should be considered for stabilizer selection.

Conclusion

This paper in detail describes a quick and easy way, from sample preparation stage to experimental tests, to evaluate the performances of four kinds of stabilizers on sandy soil. With the results obtained from the tests one can examine the relative performances of various stabilizers. Such tests can be performed during product development phase itself. For example, from all the samples examined, tests results indicated that soil stabilized by L13126 has higher UCS both in soaked and un soaked conditions than the one stabilized by L13140 and L13142 and it is comparable to market ready Product A. The 28 days UCS of sandy soil samples stabilized by using 19L/m3 of L13126 and Product A can reach to a desired value of 2 Mpa (as per recommendation). Sandy soil stabilized by polymer powder L13140 is slightly stronger than the one stabilized by the polymer emulsion L13142. Such information can be used in the ranking of various products. Other findings that can be drawn from the results presented in this paper are summarized as follows.
a) This study shows that the strength of the stabilized sandy soil is significantly increased both under wet and dry conditions by using the polymer additives.
b) The UCS values of the sandy soil samples demonstrate that the polymer-stabilized soil properties improve with the curing conditions and the additive amount.
c) The increase in strength is observed due to the deposition of the solidified polymer components after water evaporates from the emulsion. The amount of polymer deposited on the surface of the soil particle depends on the concentration of the polymer and to the degree of mixing.
d) The compressive strength growth rate of the stabilized soil correlates with the moisture loss rate in the sample. There is no further strength increase when sample completely loses its moisture.
e) After 14 days, most stabilized soil samples reach the maximum compressive strength.
f) As compared to the cement & lime stabilized soil in literature, the stabilized soil sample shows higher deformability.
g) Sandy soil sample stabilized by the polymer stabilizers show lower permeability.

For more Lupine Publishers Open Access Journals Please visit our website:
For more Open Access Environment Journal articles Please Click Here:
To Know More About Open Access Publishers Please Click on Lupine Publishers

Follow on Twitter   :  https://twitter.com/lupine_online
Wednesday, 30 October 2019

Lupine Publishers-Environmental Issues and Disaster Management


Lupine Publishers- Environmental and Soil Science Journal


What is Environment and Why it is Important?


This is a vast subject encompassing the entire system of human activities. Simply, environment is defined as: all forms that surrounds us life forms [humans, animals, birds] & non-life forms moving [air, water] & non-moving [mountains, forests]. Human settlement interacts with the environment in a complex fashion involving many different scales. The survival of all life forms on the Earth is a function of healthy and balanced growth of environment in space and time. The new economic order must make it mandatory to protect the environment to have a balanced growth at present and in future. We should not think forests, trees, and croplands as carbon sinks, but we must look at them that provide clean air for our survival. We take oxygen from the surroundings and give out carbon dioxide; and at the same time plants take carbon dioxide and release oxygen. These two groups of ecosystems complement each other. Drastic changes in either of them leads to unsustainable environment. Today, population is the greatest problem facing the country. In the past, the nature used to keep the balance through natural disasters and epidemics. Now, with the advent of modern medicine we are in control of epidemics and with the advancements in science and technology we are in a position to reduce the impacts of natural disasters but at the same time increased the diseases and disease rate. Human societies’ impact on environment is a function of population growth, more particularly in urban areas with around 30% concentration which may reach 60% by 2050, their consumption pattern and their innovative technologies-based lifestyles. We consume resources from healthy ecosystems and make it unhealthy ecosystem over time.
Just before Paris Climate meet in 2015, Pope Francis released a provocative encyclical on the environment-Laudato Si. Again, later he emphasized that destroying the environment was a sin. He further noted that humans were turning the planet into wasteland of debris, desolation and filth, and called for urgent action. Pope Francis further emphasized that, “We must not be indifferent to the loss of biodiversity and destruction of ecosystems, often caused by our irresponsible and selfish behavior”. He called for consumers to modify their modern lifestyles by reducing waste, planting trees, etc. The same was emphasized by UN & US President just before Paris meet. But this was not reflected in the Paris Agreement Document. A report of UNDP [United Nations Environment Program] warns about the rising water pollution in three continents, namely Asia, Africa and Latin America, placing hundreds of millions of people at risk of contracting life-threatening diseases and putting aquatic flora and fauna under extinction threat. It observed that, “The increasing amount of wastewater being dumped into our surface waters is deeply troubling.

What is Disaster and how it Impacts Environment?

The major causes for unsustainable environmental growth in the modern world are the “disasters”. A disaster is a serious disruption of the functioning of a community or a society involving widespread human, material, economic or environmental loss and impacts, which exceeds the ability of the affected community or society to cope using its own resources. We are encountering with three types of hazards, namely natural, manmade and socio-natural hazards. The natural disasters are beyond human control and thus we need to adapt to them. The manmade disasters are though in the hands of man they rarely follow the precautionary principle - prevention is better than cure policy. Here human greed and poor governance play the pivotal role along with poor civic sense among poor to elite.

Natural hazards

Are hazards which are caused because of natural phenomena. They are of meteorological, geological or even biological origin. Examples of natural hazards are cyclones, tsunamis, earthquakes and volcanic eruptions which are exclusively of natural origin.

Manmade hazards

Are hazards which are due to human negligence. Manmade hazards are associated with industries or energy generation facilities and include explosions, leakage of toxic waste, pollution, dam failure, wars or civil strife, etc. Now a day modern festival also comes under this group. The list of hazards is very long. Many occur frequently while others take place occasionally.

Socio-natural hazards

Landslides, floods, drought, fires are socio-natural hazards since their causes are both natural and manmade. For example, flooding may be caused because of heavy rains, landslide or blocking of drains with human waste are human induced. However, the rapid growth of the world’s population and its increased concentration often in hazardous environments has escalated both the frequency and severity of disasters. With the tropical climate and unstable land forms, coupled with deforestation, unplanned growth proliferation, non-engineered constructions which make the disaster-prone areas more vulnerable, tardy communication, and poor or no budgetary allocation for disaster prevention, developing countries suffer more or less chronically from natural disasters. Asia tops the list of casualties caused by natural hazards.

Nature

Is being destroyed by both natural disasters such as cyclonic activity, earthquakes, volcanic activity, tsunamis, etc.; and activities to meet human greed such as wars, oil-gas-water extraction, physical destruction of ecologically sensitive zones and destruction of natural water flow systems, violation of acts or laws, etc. are often attributed to global warming. The flood disasters in Hyderabad in September 2000; Uttarakhand in June 2013; Jammu and Kashmir/ Srinagar in September 2014; November-December 2015 in Chennai & Nellore; August 2018 in Mumbai; etc. are the manifestations of human greed. Now governments are wrongly putting the blame on global warming. Indian Institutions are making even Prime Minister to make false statements like “Chennai floods are associated with the Global Warming”. We must realize the fact that “ignorance is terrible, but exaggeration is dangerous”. A classic example of state disaster is Kerala August 2018 floods. To tackle the problem in the right way we need the cause of the problem in the correct way. The impacts of manmade disasters have been increasing with the time.

What is the Impact of Pollution on Environment?

Access to quality water and air are essential for human health and human development. Both are at risk if we fail to stop the pollution. Stan Cox’s “Sick Planet: Corporate Food and Medicine”, argues that corporate food and medicine industries are destroying environments and ruining living conditions across the world. Unplanned urbanization, population explosion, agriculture and uncontrolled sewage discharge in to rivers and lakes/tanks are primary reason behind the rise in surface water pollution. We are using groundwater indiscriminately, but we are not taking any action on recharging the groundwater and thus causing water pollution. The surface polluted water also polluting groundwater. Industries, mining, transport, etc. have been the major contributors of pollution. Civilization developed on the banks of the rivers throughout the world, as water was the basic necessity for all living beings. In the last two centuries, with the industrialization primarily around urban centers the rural population started migrating to urban centers for greener pastures. All these in urban areas and modern agriculture practices in rural areas introduced the evil pollution. Thus, directly and indirectly affected the environment and living organisms on the Earth. Children and adults today carry an estimated 300 or more chemical residues that were not present in their grandparent’s body. These chemicals accumulate in the body with the time and are passed on to the next generation often at high concentrations. Water borne diseases caused by intake of chemicals and contaminated water affecting around 3.4 million people globally.

We rarely look at precautionary principle; instead of prevention measures, we try controlling measures with which we rarely achieve the stated goal. Also, with isolated control measures, the scenario will not change. Take for example: will the Supreme Court order really improve the industrial pollution? The court needs to look into ground realities such as excess production and zero pollution. Without that, there will not be any improvement in reducing the pollution levels. Water is a natural resource, fundamental to life, livelihood, food security and sustainable development; it is also s scarce resource. India has more than 17.11% of the world’s population but has only 4.6% of world’s water resources with 2.3% of world’s land area. Precipitation and snow melt provide the fresh water; though they are renewable, they are highly variable with space and time; climate change plays vital role in the year to year water availability over different parts of India. India crossed 130 crore population and wasting around 40-50% of food produced – it is around 30% for the world as reported by FAO and the resources used to produce that is also simultaneously wasted. This is basically because of unplanned agriculture driven by technology that looks at profit than over the environment. Modern agriculture is causing air, water, soil and food pollution. We look at production growth, but we rarely look at the impact on environment by such technologies, more particularly on water resources and health of life forms. Though the industry uses very little, when the pollutants generated by industries released in to potable water, it changes potable water in to polluted water. This very rarely we account as the water used by industry.

How do We Achieve the Disaster Risk Reduction?

Preparedness

It is a protective process that embraces measures which enable governments, communities and individuals to respond rapidly to disaster situations to cope with them effectively. It also includes the formulation of viable emergency plans, the development of warning systems, the maintenance of inventories and the training of personnel. It may also embrace search and rescue measures as well as evacuation plans for areas that may be at risk from a recurring disaster. Preparedness therefore encompasses those measures taken before a disaster event which are aimed at minimizing loss of life, disruption of critical services, and damage when the disaster occurs.

Mitigation

It embraces measures taken to reduce both the effect of the hazard and the vulnerable conditions to it in order to reduce the scale of a future disaster. Therefore, mitigation activities can be focused on the hazard itself or the elements exposed to the threat. Examples of mitigation measures which are hazard specific include water management in drought prone areas, relocating people away from the hazard prone areas and by strengthening structures to reduce damage when a hazard occurs. In addition to these physical measures, mitigation should also aim at reducing the economic and social vulnerabilities of potential disasters. However, with poor civic sense among poor to elite along with poor governance in some cases this is rarely achieved. Examples under this are the flood disasters mentioned earlier pages.

Industrial Pollution Related Disasters

In the case of pollution, some are point sources and some others are non-point source. Industrial pollution is point source pollution. There are rules and regulations to control the pollution through Water Act of 1974, Air Act of 1981, and Environmental Act of 1986, EIA Notification 2006, etc.; and for which pollution control boards were established to regulate them. However, the system is weak. A classic example to this is the Bhopal gas tragedy. This disaster would have been averted if the government departments followed the stipulated norms. Instead, they allowed residential houses all around the factory, which has been resulted the great tragedy. Another example is urban water [surface & groundwater] pollution that drastically reduced the potable water availability.

Agricultural pollution related disaster

Agricultural pollution is non-point source pollution and thus there are no rules and regulations. The only solution is change of technology. Though some farmers are attempting in this direction, the governments are not showing much interest in this direction. Gulf of Mexico turned in to a dead zone spreading over thousands of square kilometers with runoff that contains residues of chemical fertilizers & sprays from agricultural farms carried through Mississippi River in USA.

For more Lupine Publishers Open Access Journals Please visit our website:
For more Open Access Environment Journal articles Please Click Here:
To Know More About Open Access Publishers Please Click on Lupine Publishers

Follow on Twitter   :  https://twitter.com/lupine_online
Tuesday, 29 October 2019

Intellectual Irrigation Management in Mining Frozen Farming in Azerbaijan


Lupine Publishers- Environmental and Soil Science Journal


Abstract


This article examines the current state of soil and water resources, farmland t.ch.i Azerbaijan Republic , the problem of progressive water and wind soil degradation , the need for the organization of agriculture , taking into account the introduction of automated control systems for irrigation using water saving technology and hardware equipment in it, the study of the characteristics and analysis of experience implementing measures to stabilize ecological and drainage system of agriculture in conditions of insufficient moisture areas in the country , as well as basic aspects of development of environmental reclamation approach balanced, rational use of a particular system of crop rotation and crop taking into account the requirements of economic development and environmental management.

Introduction

The main directions of economic and social development of the Republic is the characteristic intensify agricultural production. A powerful tool for the intensification of agricultural production in the face of his specialization is irrigation. In areas of insufficient moistening (especially typical for mountainous areas) irrigation is one of the decisive factors of the cultivation of high and stable yields of agricultural crops. The purpose of the study: For this purpose, requires the development of new technical solutions and the introduction of automated systems of low irrigation of crops eligible for Ecology and environment Wednesday to improve their environmental condition of irrigated lands, reduce water consumption per unit products and increase the productivity of those or other crops on irrigated field.

Research Methods and Moves the Discussion

Irrigated soil in Azerbaijan covers 1.45 thousand hectares. It is believed that factors directly affecting the fascination with crop yields and productivity in this area per hectare of arable land and agricultural land at minimal cost, labor and funds also apply automation application. Automated irrigation increases the effectiveness of all factors intensifying: Chemistry, integrated mechanization, intensive technology upgrade, etc. It allows you to create a large zone of guaranteed crop production.

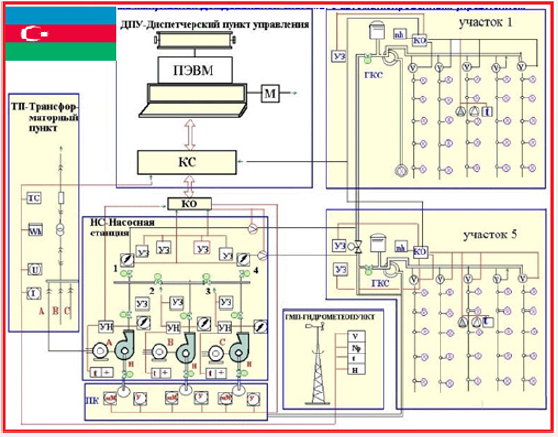
Objects of Study: The object of the study is to explore and create the correct methods for regulating water use and supply of plants by means of irrigation in regardless of weather conditions. To this end, we have developed and introduced into production design systems of automated management systems for irrigation of low- Micro-tailings of self-oscillating action, successfully passing the resource tested test on vydelochnyh soils under Orchard, Lip Hachmasskoj area on the foothills of the Mountain above level at an altitude of 600 meters sea with sloping terrain 0.02. (see the concept of impulse systems rain avtokolebatelnogo actions with automated controls Figure1. Construction and functional description of the CMO AY so for operational control of the weather conditions in the region needed to meet the challenges of planning and operational irrigation management crop fields at the local gidrometeopunkte are set measurement sensors with probes for telemetric measurement taking the readings the main parameters:
a) Wind speed-V analog signal (Titus) with period recording of parameter values in the cycle of 30 minutes
b) Air temperature-tv, analog signal (Titus) with period recording of parameter values in the cycle 30 min.
c) Air humidity-Wb, analog signal (Titus) with period recording of parameter values in the cycle of 30 minutes.
Figure 1: schematic diagram of impulse systems rain avtokolebatelnogo actions with automated controls.
lupinepublishers-openaccess-journal-environmental-soil-sciences
The reading parameter values in the telemetric heskom code is done smart object controller (to) established in paragraph transformer via a radio channel which communicates with sensorsconverters.
Ko otschitannye telemetry signals codes undergo preliminary processing, homogenization and written to main memory, which stores prior to their taking the readings the communications controller (CC) that is installed in the premises of the operational control technology process (ASMO)-operator. For monitoring and control of electricity supply facilities and power consumption accounting to ASMO transform point (TP) (see structural concept of APCS for irrigation) installed transmitters:
i. voltage measuring input) in TP-U (analog signal (Titus)
ii. measurement load consumers-I U (analog signal (Titus)
iii. electricity metering)-Wh (discrete signal integrated-TII
iv. control switch settings (enable-disable consumers)-SS (discrete signal position SHH).
Report parameter values in the telemetricheskom code is performed by intelligent object controller (KO) of local wire and after their initial processing and averaging is written into RAM. For monitoring and control technological process of abstraction, clarifiers (wastewater treatment plant) and pumping stations (devices increase the water pressure in the pipes) installed transmitters listed in structurally-functional schema:
a. water turbidity in the ponds-m (analog signal loop to read Titus, 30 min)
b. water level in chambers-ponds-n (analog signal TITUS, read in a loop 30 min); in water pressure-r installed on discharge pumps, modular and distribution reservoirs (analog signal TITUS, read in a loop 30 min)
c. load dimensions electric motors-I (analog signal TITUS, read in a loop 30 min)
d. provisions of valves-PZ (discrete signal SHH, readable in cycle 1)
e. power switches) Regulations-VP (discrete signal SHH, readable in cycle 1)
f. alarms-AU (discrete signal TCA, readable in cycle 1 with priority)
g. water metering pumps and supplied in the distribution pipeline-Q (integrated signal TII, processed in the cycle of 1:00).
Soil monitoring and process control of irrigation is carried out according to the specific fields of irrigation based on measurements of the agrophysical and technological parameter sensorsconverters:
I. soil moisture VLP-(analog signal TITUS with a 30 min cycle)
II. evaporation from soil surfaces-Exec (analog signal TITUS with a 30 min cycle);
III. soil temperature) t°-(analog signal TITUS with a 30 min cycle)
IV. water consumption irrigation on distribution pipeline plot-Q-(integrated signal with a 30 min cycle)
V. inclusion of the GKS discrete signal readable in a cycle of 30 s
VI. position switching valves (discrete signal read SHH 30 c).
VII. Report telemetricheskom signal code is performed by intelligent object field radio communications controller and after their initial processing and averaging processor is written into RAM.

Enter Operational Data into the Computer and the Formation of a Database (ODB)

Recorded in the memory controller objects (to) data are programmatically by radio and wire communications controller (CC) connected to your computer Tower (PD) (see circuit diagram system intensity of irrigation and automated controls), according to the specified rules and written in his memory in the structure of the telemetry files (see information provision). Computer exchange programs plays the data from RAM to the COP, transcode them and writes into the database from which displays them in real time on the display mnemoshemah, and after linearized and averaging the data on their codes programmatically are recorded in the cumulative base structure which provides information, and this generates a data bank complex tasks ASMO [1-3].

Information Flows of the Automated System of Low level (ASMO)

Before writing to the Bank data stream measurement data analyzed by specified algorithms and when the results of the analysis, with deviations from the values specified in the rules of the installations is operational control (OBU) process. Operating base control programmatically at the specified in the rules of the cycle is counted by the management module on technology directions and if there are deviations in the data records for this activity generates a control signal to the appropriate the executive body.

Organization of the Collection and Transmission of Data on the Internet Channels

Conditions for Organization of Data Exchange

A. Data Interchange on The Work of the System of Irrigation is Carried Out Via the Internet: To do this, you must connect through a computer modem to the telephone network and earn the right to Internet access through an Internet service provider. This requirement applies to each Subscriber. If these conditions are met, the computer ‘ The Center can communicate with computers on the sections of the irrigation districts of Azerbaijan and other States.
B. is the site irrigation system, where visitors will see: the latest system state data, interactive pages, created by PHP technology, rapid exchange of data and messages in real time?
C. Using Skype 3 users can talk on the phone and when using cameras to see each other, and when streaming video programs-view the status of the site. When measurements of parameters, it is necessary to take into account the dispersion of available measured values. The value of the parameter, which can be taken for the actual probability of 0.8, is determined by the number of repetitions of measurements is defined by the formula:
n_0 8e, x = 1.64 * 0.001 (SIG_(B)) * ((W(HB)/10 * h) * 2)) + 2.27 (1)
Where is:
n = 0.8
(Tr)-number of retries, the measurements meet the probability 0.8;
m-0.8 (tr)-measurement accuracy (mm)
SB-standard error of measurement, %
b (HB) W (HB)-moisture reserves, mm
When humidity b (HB) in the control layer (h) (a), m.

The Source (start) Measurement of Soil Moisture and the Calculation of the Initial Moisture Reserves in the Soil W0

General description of the Task

Original moisture reserves W0 soil in the active layer defined by the formula:
d WHB = W (tau)-W (HB), (2)
Where is:
h (a) is an active soil layer, m (it is assumed that the active layer of the soil is divided into layers of 0.20 m -0.30), γ is the average density of soil layer, t/m3 entry in program code gamma_sr, βτ-soil moisture at field station in% to mass of dry soil in the program code recording the moment (Veta tau). For automated definition starting soil moisture reserves come from the fact that the value (Veta_ tau) is defined βτ measure humidity, it is installed on a stretch of fields on n0, 8 (tr) measurements (write in code, n_0 8 ex). The measured values are automatically written to the parameter file Data Par. dbf data bank on N_ code element parameter belongs (see. (c) special section ‘ Data ware ≫) [3,4]. To specify the conditions for the calculation of the value of the conditionally required variables are written in the job (see. ZADANIE_3 information). Defining the value of starting (the original) soil moisture deficit is determined programmatically moisture reserves and necessary rules. Results of solution of the problem is written to the output document DOC_3 and plotted on the graph.

Description of the Algorithm in Accordance with the Task of Determining Soil Moisture and Moisture Reserves on a Plot of Field Irrigation (see information provision ‘ZADANIE_3)

Searching for Values from the Database (from the Section Information Management)
Parameter values automatically read from a file Data Par. dbf on N_ code element parameter belongs; the value of the N_ code element is read from the file ELEM. dbf on key: SL_SYST + SSYST + SL_MODYLE + SL_GROUP + SL_VID + SL_ TYPE. Formation of a lookup key for N_ code (see instructions to the operator).
a) Select SL_SYST. dbf) from a file system to which the parameter element.
b) From file SL_SSYST. d bf to select subsystem
c) From a file + SL_MODYLE-module d bf.
d) From the file SL_GROUP. dbf-the group to which an item belongs measured parameter
e) From the file SL_VID. dbf-element kind of measured parameter.
f) Of the file item type TYPE. dbf SL_ measured parameter.
If the elements identified by coupling multiple (see. ZADANIE_3, write Then Each of them is Assigned a Position Number: The item number is appended to the name through the separator [_] (NAME_1 >). For formed coupling is TLS_X. d bfN_ code. From Data Par. dbf to N_ code + Z date and parameter name in ZADANIE_3 (+) programmatically is its ZNACH value for each field. The obtained values of parameters-moisture content at the specified date, or BETA_ tau stocks of moisture on the specified date W (tau) for each section of a field are written to the output DOC. 3 see layouts output documents ‘ Supply of moisture on irrigation fields ≫ After identifying the BETA_tau moisture or soil moisture reserve W (tau) is defined or moisture deficit soil moisture reserve[2-8]. Determination of moisture deficit soil moisture reserves and to stretch the field and if the software is determined by ZADANIE_3) humidity and BETA_ tau of Data Par. dbf found its importance, relatively humidity moisture deficit lowest water consumption BETA_ (HB) is [2, 4, 6, 8]
dBETA _ HB = BETA_ (HB)-BETA_ tau (3)
Where is,
BETA_ (HB)- from SF_ Plot. dbf and Con Soil. dbf; BETA_ taufrom the 5.2.4.
Moisture deficit values are automatically written to the output DOC. 3 If for ZADANIE_3 is determined by the supply of moisture in soil W (tau) and of DataPar. dbf found its value, reserve moisture deficit moisture while the smallest capacity dW (HB) is equal to:
DW (HB) = W (tau)-W (HB) (4)
Where is
W (HB)-from SF _ Plot. dbf and
Con Soil. dbf; W_ tau-from the 5.2.4.
After Identifying Data for Each of the Specified Sites Field is Determined; and average value) BETA_AV humidity and soil moisture reserves generally W_AV on the field:
BETA_AV = 1/n Σ (BETA_ tau) (5)
Where is
n is the number of balanced plots involved per from ZADANIE _3, 4 entry;
(BETA _ tau) i -soil moisture is relatively dry soil from 5.2. for each plot.
if defined (W_tau), the average soil moisture reserves the entire field
dBETA_AV = 1/n * Σ (dBETA_ tau) I (6)
the average value stock deficit soil moisture fields:
dW_ AV = 1/n Σ (dW _ AW) I (7)
Calculated values in clause 5.2.4. are automatically written to the string < averaging field ... .... >.
i. Defined e in items 4.5 and 6 DOC. 3 bar chart displays the parameter values ‘supply of moisture on the field irrigation≫
ii. after seeing the DOC. 3 prompted < Will solve the problem for other fields on this date >. <Д а>, <Нет>. When you type <Да> < message, type the name of the field and economy in ZADANIE_3 > ZADANIE and displayed for data entry.
If the database parameter value specified in ZADANIE_3, it displays an < Value specified in the ZADANIE parameters in the database are missing. Will measure these parameters? <Да>, <Нет>. If <Да> then go to 5.2.1. If <Нет>, then the solution of the problem of consummated and exit the menu. Before starting measurements determines the number of dimensions at each site provides the probability computed value not less than 0.8 at minimum cost of labour on measuring n_0, 8Ex:
n_0, 8Ex: = 1, 64 * 0.001 (SIG_B) * (W (HB)/10 * h) * 2)) + 2.27 (8)
Where is:
SIG_B-set the value of the standard error in percent; Beta (HB)- from ZADANIE_3; -W (HB)-supply of moisture in the soil, in mm when humidity BETA(HB) of the SF_ Plot. dbf; -h is the depth of the soil layer (mm), which should be dimension. Perform n_0, 8Ex measurements specified ZADANIE_3 parameter, row 2 on each site and write to Data Par. dbf to N_ code, Z date, Z time. Calculate the mean value of the measurements of (make a selection from Data Par. dbf to N_ code + Z date. Average soil moisture reserve W_AV is equal to:
W_AV = 1/n_0, 8Ex * Σ (W_0, 8Ex) i (mm) (9)
Where is
W _ 0.8 Ex -the value of the stock of moisture each dimension selected in item 4.2.6 (If measured soil moisture BETA_0, 8Ex, the average humidity BETA_ AV as well:
BETA_AV = 1/n_0, 8Ex * Σ (BETA_0, 8) i (%) (10)
Where is
BETA_0, 8 Ex-the value soil moisture for each measurement computed values to assign:
a) W_AV: = W (tau);
b) VETA_AV: = BETA_ tau and write to output DOC. 3 as in 5.2.1 and 5.2.3 as; 5.2.4.
Filled DOC. 3 is written to the folder that you want to send through the channels of the Internet. Programmed codes are shown in a separate annex.

Conclusion

The study identified possible operational solving complex problems of an operational definition of soil-conservation settings.

For more Lupine Publishers Open Access Journals Please visit our website:
For more Open Access Environment Journal articles Please Click Here:
To Know More About Open Access Publishers Please Click on Lupine Publishers

Follow on Twitter   :  https://twitter.com/lupine_online
Saturday, 26 October 2019

Lupine Publishers | Creative Process in the Design and Creation of Textile Manufacture

Lupine Publishers | Journal of Textile and Fashion Designing


Introduction

Creative process

Man has his creative manifestations through his individual aspirations, thoughts and idealization. The need is a motivating factor that drives the search for knowledge, problem solving and satisfaction, Santis [1]. For Lobach [2] "The conduct of the human being is also driven by multiple and varied needs. The emergence of needs is not always logical, especially when other activities or processes have occasional preference. "Necessity seeks satisfaction; aspiration is the spontaneous will to obtain something that comes from idea or visualization. The aspiration consists in the desire to obtain something that can be reached or not. Needs and aspirations accompany the evolution of technology, information tools and economic development. Lobach [2] states that design consists of a systematized design, plan or method that includes problem solving incorporating ideas, innovation, sketching, samples, models to make concrete the solution found.
Over the centuries, the needs in its evolution have been accompanied by the development of instruments, methods and systems. The constant evolution through research and events show that innovative creativity has played a key role. The development of the human creative process has also been marked by various frustrations, problems in creativity and with innovation; these problems are constantly reported by various scholars. Several researchers and researchers [2] have already been affected by creative inertia, difficulty in exposing ideas, fears, and lack of innovation or even problems that seemed unsolvable. Even so, the creative process has become an important tool for resource development. And the stimulation and organization of the creative process is being studied in theories, techniques and tools such as: Design Thinking, Design Methodology, and Inventive Problem Solving Theory. These are applied for the development of textile products.

Product Development

Ostrower [3] states that the ability to understand, assimilate, configure, and signify is the creative act. Creating is a way of establishing a new relationship between the human mind and the object in order to understand meaning or to redefine (giving a new meaning, a new practice, the ability to perceive an object through a different vision). Already the creative process derives from the structuring of cognition (knowledge of facts), intelligence (human characteristic composed of logical thinking, communication, knowledge, sensibility, problem solving, emotional control, etc.), creation ability (giving meaning to something or something) and innovation (creating something unknown). To meet the new type of consumer coming from social and communication changes, manufacturers seek to align existing needs with functionality and aesthetics by creating values that can be applied to technological fabrics.
Barbará [4] calls the process a set of ordered and integrated actions for a specific productive purpose that at the end of the cycle generate products, services or information. In the process of manufacturing with synthetic fibers began the decade of 30, the developed fibers become part of the manufacture of fabrics and clothing. To give a small notion of what we call fiber, I find it interesting to contextualize the historical beginning, recalling some important facts. In this sense, the textile manufacturing manufacture uses the fibers to compose the yarn, and the woven yarn becomes fabric and various stamping and dyeing techniques. The textile production manufacture is divided into three cores: the yarn manufacturing, the fabric manufacture and the confection. According to Sanches [5] the fiber consists of the smallest element of the composition of the fabric in any natural or manufactured substance that has suitable characteristics that allow its processing. Being, the smallest component of hairy nature, which can be extracted or separated from a tissue.
In wire manufacturing, the breeding process establishes the mixing of the materials for processing. The processing consists of a rational part that modifies the form of a structure or system for the construction of a mixture, an irrational part that is compounded by bringing together psychological, emotional, innovative, creative and personal aspects. This means that the transformation depends on the creative aspects to innovate in the fiber blend. The creation procedure promotes finding strategies that encourage the production of new means of mixing the components, which can motivate, add capacity and add value to the basic and secondary functions of the product or service to generate probabilities of more interactive information in the market, Santis [6]. The set of productive operations or manufacturing should have as main focus of improvement; increase in productivity and also in quality.
On an industrial scale (manufacturing sizing) in the contemporary, the good use of the methodology of the project presents some techniques that promote to encourage the application processes of the project methodology consist of the interaction of tools, resources and manpower converted into energy that perform the connection between procedures and tasks, Santis [1]. The manufacturing of textile the object of study of this research produces knitted fabric, working in the circular knitting industry, among its articles produced we can mention: knitwear for fitness, linings, beach and microfiber. Knitted textile manufactures that also serve as object for this research have a tradition in the Brazilian economy and, considered as one of the great s manufactured in Latin America, consisting of several business units in the country, its most common products made of fabric composed of combinations of polyamide, cotton and elastane (synthetic filament) in circular and straight looms.
Thus, actions constitute a form of processes that are interconnected in a physical or virtual structure, which establishes a set of ordered processes in operations to modify the resources in products. For Agostinho [7]. The fixation of the scripts and manufacturing processes fix the knowledge manufacturing, or how to do it, being considered the pillar of fixation of manufacturing knowledge. Following the scripts and manufacturing processes, it is determined the times required for each operation of the script, consequently of the parts and set of parts that make up the product [8-52].
Finally, the manufacturing and creative processes interrelate in a chain of interdependent functions, considering (external environment) and dependent variables (internal environment). This functional interrelationship facilitates the systematization of the production of goods and services. Each function has a sequential operation flow for the development of an operation from the inflow of resources to the exit of the goods or services. The set of actions in the creative process developed by a sequence of operations establishes the construction of a product, whether it is a consumer good or a service and this facilitates innovation in creative development.


For more Lupine Publishers Open Access Journals Please visit our website:

For more fashion and textile research journal articles Please Click Here:

To Know More About Open Access Publishers Please Click on Lupine Publishers

Follow on Linkedin : https://www.linkedin.com/company/lupinepublishers
Follow on Twitter   :  https://twitter.com/lupine_online