Lupine Publishers- Environmental and Soil Science Journal
Abstract
In this study, a method of water leakage detection system was investigated using acoustic emission device, AQUA M 300D. It is
used to pinpoint leakage sources for underground pipelines system. The leakage is detected by analyzing the feedback frequency,
where leakage area produces higher frequency due to the vibration resulting from a high-pressure liquid that flows through the
crevice. The method is successful to detect underground pipelines system leakage with 90% accuracy.
Introduction
Every year, the government spends high budget on improving
water pipeline system by doing maintenance, replacing older water
pipeline, and locating leakage area. There are large percentage
of water loss due transportation from sources or treatment plants
to users. Water loss can be attributed by several causes including
leakage, metering error and misuse of public usage [1]. But, water
loss due to leakage contributes a larger percentage [2]. There are
several methods that can be used to detect water leakage. However,
in this study, acoustic emission technique has been chosen as
it is the best non-destructive test for underground water pipelines
[3,4]. The tests of efficiency and compatibility of the technique in
detecting underground water pipelines is explored. This paper will
also discuss the failure analysis that commonly occurs, and the factors
lead to it. The test is conducted at Universiti Pertahanan Nasional
Malaysia.
Instrumentation
Acoustic Detector AQUA M300 D
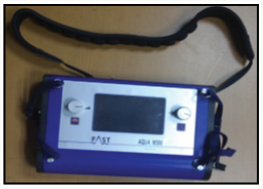
Figure 1 shows the AQUA M300 D, a multi-purpose detector designed
to allow the user to carry out electro acoustic leak detection
on pipe systems carrying water, acoustic leak detection on pipes,
and to perform non-destructive pinpoint leak detection on pipes
which have previously been flooded with trace gas using the indicative
measurement of different hydrogen concentrations.
Experimental Procedure
Acoustic Detector AQUA M300 D is used to record frequency
readings at the possible leakage locations. Four locations have been
selected, which are pipe located under the road, parking lot, chancellor
building, and Block C4.
Results and Discussions
Case Study 1: Leakage from Pipe Located Under the Road
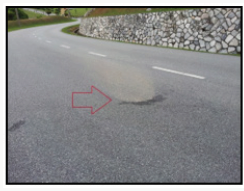
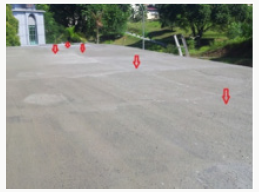
Figure 2 below shows watermark appear on the road surface
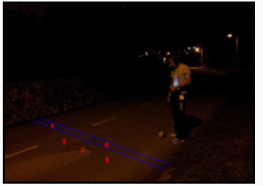
due to leakage or crack in underground water pipeline. Five readings
have been taken to determine the sources of the leakage as
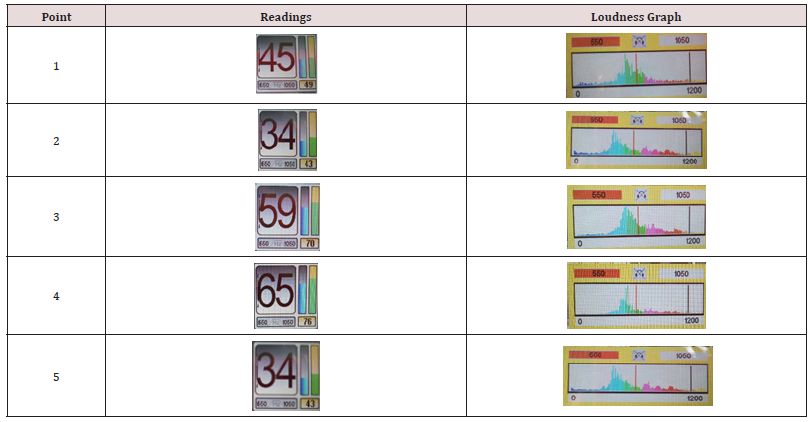
shown in Figure 3 The readings are displayed in the (Table 1) From
the table, it shows that frequency reading at point 4 is the highest
compared to other points. The high frequency is emitted due
to occurrence of underground water pipeline leakage or crack. It
is resulting from the vibration that is produced by a high-pressure
water flow through crevice in the water pipeline. The smart bar indicator
will increase when the frequency increases. That indicates
that the range of potential leakage pinpoint is narrowed down. The
area that does not have water pipe shows low reading because
there is no vibration occurred due to water flow.
Case Study 2: Wet Surface Detected at the Parking Lot
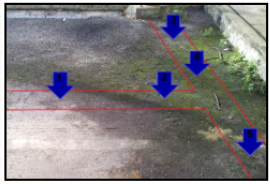
A wet surface had been detected at the parking lot surface near
the staffs’ residence as shown in Figure 4 The wet surface is obviously
detected during peak hours. This is because during peak hours,
water consumptions are high. So, a higher-pressure force flows in
the underground pipeline thus forces the water escape through the
crevice. The water then is pushed up to the surface through soils
and resulting in wet surface appears on the ground. The readings
are taken from five pinpoints indicated by blue arrows. The red line
shows the underground water pipeline path. The acoustic device
has been used to determine the pinpoint of the leakage. The readings
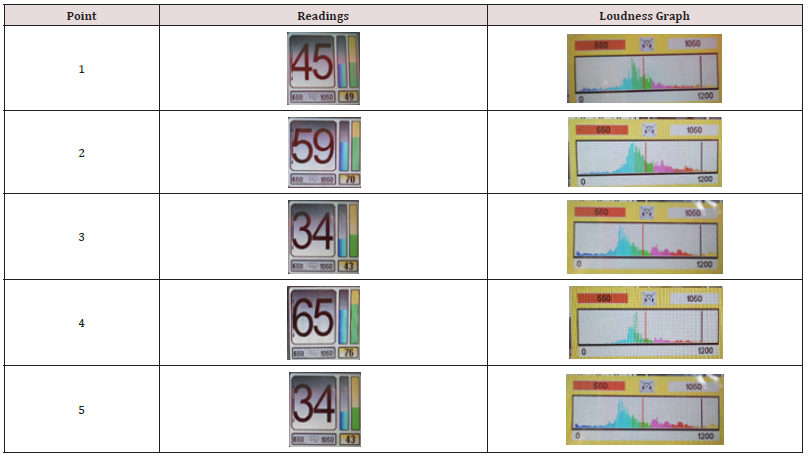
taken are plotted in Table 2. The results demonstrate that the
leakage is highly possible to occur at point 4 as it shows the highest
frequency reading. This is the result of vibration from water escaping
from the crack or leakage on the pipe. Uniform reading should
be accomplished if the pipeline is in good condition. Point 2 also
shows a high frequency reading though not as high as point 4. It can
be concluded that the frequency increases as the detector comes
close to the source of leakage. The readings at point 1, 3, and 5 are
lower compared to point 2 and 4 as they are further from the leakage
pinpoint.
Case Study 3: The Chancellor Building
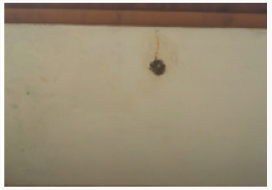
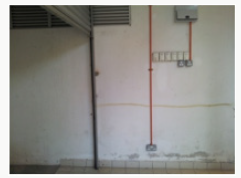
Watermark is detected at the ceiling of Chancellor Building as
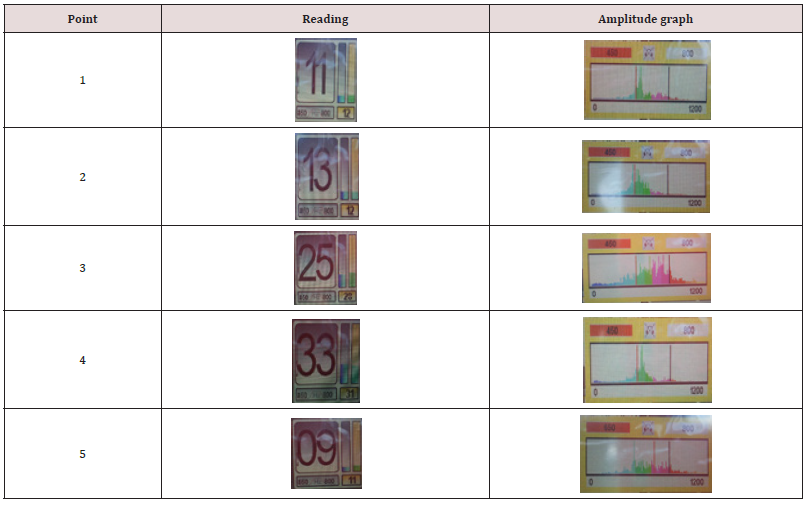
shown in Figure 5 below. Therefore, five frequency readings have
been taken from five different places near the watermark as shown
in Figure 6. Based on the results displayed in Table 3, there are
two possible points of leakage which are at point 3 and 4. This is
because at point 3 and 4, the device detected highest amplitude of
loudness which came from the leakage.
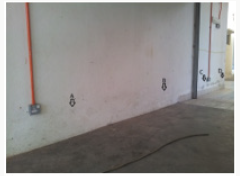
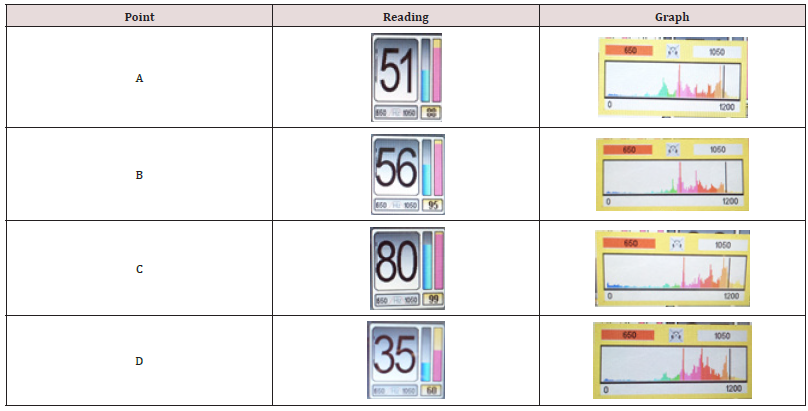
Watermark has been spotted at Block C4 as shown in Figure 7
Points of interest are labelled as shown in Figure 8 to determine
the source of leakage. The results are displayed in Table 4. Based on
the results, the highest frequency reading is obtained at point C followed
by point B, A, and D. This is because water leakage occurred
at that point causing the pipeline emitted a higher vibration that
can be detected by the detector.
Crack Propagation Theory
From the results obtained, we can analyse the factor that leads
to cracks and leakage. Leakage can occur as the results of high pressure
and type of material chosen for pipe. High pressure can cause
stress that leads to propagate cracks. Thus, crack propagation theory
is studied to determine the suitability on pipe selection. Due to
uniformity of loading, an element of the pipe is subjected to normal
stress or hoop stress (σ1) and meridian stresses (σ2) in the longitudinal
direction. Stresses subjected to pipe wall determined by internal
pressure, radius and thickness of the wall and are experienced
by every part of the wall pipe.
In order to find maximum stress acting on the pipe wall, hoop
stress and meridian stress both need to be calculated. The hoop
stress is the stress that occurs at y-plane direction. Meanwhile meridian
stress is the force acting on x-plane direction. The pipe sample
is shown in Table 5 below.
Calculation of hoop stress: -
σh=pr/t
σh= (28) (0.08)/0.006
σh=373.3 MPa
Calculation of meridian stress: -
σm=pr/2t
σm= (28) (0.08)/2(0.006)
σm=186.67 MPa
From the calculations, the value of hoop stress is chosen as operating
stress. It is chosen because the value of the stress is the maximum
stress experienced by the pipe wall. Fracture toughness, Kic,
is the resistance of a material from fracture starting from pre-existing
cracks. From this equation we can predict the stress state that is
closed to the crack tip accurately. Geometric factor is dimensionless
and determined by geometry, loading configuration (load acting on
pipe), and the ration of crack length to specimen width.
The equation is given as
K=Yσ√πa
Where;
K=stress intensity factor
Y=geometric factor
σ=operating stress=σmax
a=crack length
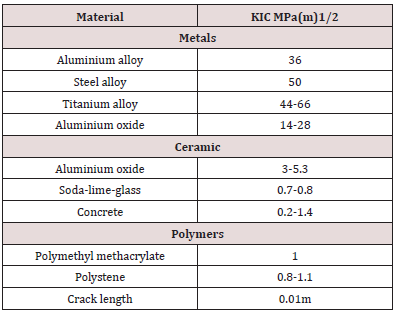
The stress intensity factor, K is then compared to plane strain
fracture, Kic as stated in the Table 4.4. The Kic is temperature, strain
rate, and microstructure of materials dependant. The magnitude of
Kic diminishes with increasing strain rate and decreasing temperature.
The value of Kic normally increases it with reduction in grain
size as composition and other micro structural variables are maintained
constant [5].
Y = in this shape of crack for pipe, 1.12 is taken for the value of
geometry factor
a = (crack length)/2
= 0.01/2 =0.005 m
K=Yσ√πa
K=1.12(373.3) √ (π (0.005))
K=52.40 MPa√m
From calculation made, stress intensity factors the value, K is
greater than plane strain fracture toughness, Kic as shown in Table
6 This means the crack on the pipe is propagating.
Conclusion
Cracks and leakage detection in buried water pipeline system
at UPNM area was conducted using an acoustic device which is
AQUA M 300D. It is found that the pinpoint of cracks and leakage is
successfully determined without affecting the pipeline. This study
is practical to be used as to detect abnormalities in the underground
water pipeline. A theoretical analysis for stress intensity factor
also has been investigated. The pipe is modelled as a thin wall
cylindrical to calculate the stress acting on the pipe wall. From the
data analysed, it can be concluded that the stress intensity factor, K
should not be greater than plane fracture toughness, Kic of the pipe
material. If the value exceeds, the crack will propagate and lead to
leakage. The theoretical calculation gives agreeable result with this
study as the K value exceeds the Kic, thus resulting in leakage on the
pipeline.
Follow on Linkedin : https://www.linkedin.com/company/lupinepublishers
Follow on Twitter : https://twitter.com/lupine_online

No comments:
Post a Comment
Note: only a member of this blog may post a comment.