Lupine Publishers- Environmental and Soil Science Journal
Abstract
The water quality of many waterways in the state of Alabama, and in
the nation as a whole, is deteriorating due to point and
nonpoint source pollution from human and animal waste. Accurate
identification of contamination sources is essential if we are
to develop cost-effective pollution control strategies. The direct
detection of host specific genetic markers by Polymerase Chain
Reactions (PCR) has been widely used in identifying sources of fecal
contamination in environmental waters. In this study, we
conducted experiments to validate genetic markers associated with
deer/elk, Canada goose, dog, and cattle for Microbial Source
Tracking (MST) in Alabama. End point PCR was performed on 10 raw sewage
samples and 133 fecal samples from nine animal
species. Our results showed that CowM3, GFD (goose), and deer/elk associated markers have acceptable specificity and sensitivity,
making them suitable for MST studies. However, the dog marker and one of the cattle markers (CowM2) exhibited cross reactions
with other fecal samples. The performance of these host associated markers in environmental water was evaluated using both end
point and quantitative PCR (qPCR). Human, goose, and dog markers were detected in several water samples by end point PCR;
the human marker and CowM2 marker were also detected by qPCR. Samples collected after a significant rainfall event showed
the highest frequency of genetic marker detection. Both human and Canada geese contributed to fecal pollution in samples from
Parkerson Mill Creek.
Introduction
The water quality of many of the waterways in our state, and
in the nation generally, is deteriorating due to contamination by
both point and nonpoint source pollution from human and animal
wastes. Each year, millions of cases of infectious disease result from
swimming and bathing in contaminated water or consumption of
shellfish harvested from fecal polluted waters [1]. Parkerson Mill
Creek, located in east Alabama, is rated “impaired” because it fails
to meet the water quality criteria required to support its designated
use as a fish and wildlife stream. In 2007, the creek was included on
the Alabama Department of Environmental Management’s (ADEM)
303(d) list of impaired waters for pathogens from point and nonpoint
pollution sources. (http://adem.alabama.gov/programs/
water/303d.cnt). Urban runoff, pet waste, wildlife, and leaky sewer
lines have all been thought to contribute to the high level of E. coli
concentration (Parkerson Mill Creek Watershed Management Plan,
2010). However, more information is needed to definitively identify
the major sources of fecal pollution in order to develop better
strategies to protect against the health risks posed by polluted
water. Fecal Indicator Bacteria (FIB) such as Escherichia coli ( E.
coli) and Entero cocci have been used to indicate fecal pollution and
potential human health risks in surface water for some time (USEPA,
1986). However, FIB methods are not specific to any fecal sources
and require at least 24 h to obtain results [2,3]. It is also possible
for E. coli and Entero cocci to survive and regrow in sediment after
being released into the environment [4-6]. Given that the accurate
identification of contamination sources is essential for developing
cost effective pollution control strategies, increasing interest is
now being directed towards the use of library and cultivation independent Microbial Source Tracking (MST) methods based on
the polymerase chain reaction (PCR) technique that target host
specific molecular markers. Combining MST methods with end
point PCR and qPCR should provide results that reflect the most
recent fecal pollution and identify the sources, thus enabling us to
develop better pollution control strategies [7-9].
Members of the order Bacteroidales are considered promising
fecal indicators with which to monitor microbial water quality
due to their host specificity, broad geographic stability, and high
abundance in the gastrointestinal tract of warm-blooded animals
[10-17]. However, Acteroidales are not present in the feces of every
individual member of a species and the concentrations may also
vary from one to another [18] suggested that Bacteroides in gulls
are scarce and the horizontal transfer of Bacteroides from humans
to gulls is common. As a result, the avian markers used in the current
study targeted bacteria namely Catellicoccus marimammalium.
The objective of this study was therefore to evaluate host specific
genetic markers associated with dogs, cattle, geese and deer that are
likely to affect the local watershed. Environmental water samples
collected from Parkerson Mill Creek were used to determine the
performance of these markers in the field.
Materials and Methods
Sample Collection
A total of 133 fecal samples and 10 wastewater samples were
collected around three cities in east central Alabama, Auburn,
Opelika, and Montgomery. The fecal specimens represented nine
different animal species (cattle, Canada goose, cat, chicken, deer,
dog, duck, goat, and horse) likely to affect the watersheds statewide
and were collected with sterile wooden spatulas and placed in
sterile polyethylene tubes. Ten raw human sewage samples were
collected from nearby wastewater treatment plants in sterile 1-liter
bottles. All samples were kept on ice and transported to the lab on
the day of collection. Sewage samples were centrifuged at 5000
rpm at 4°C for 15 minutes to concentrate the solid materials 10-fold
and fecal samples were stored at -80°C until use. On each of four
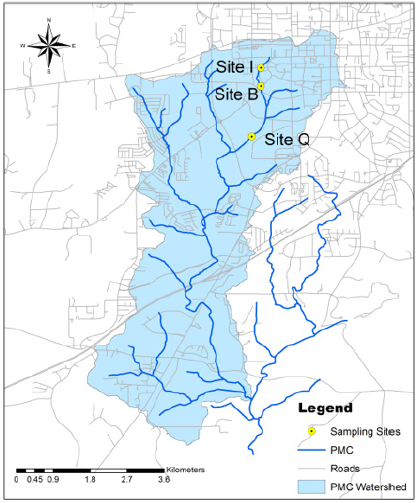
days during the months of April and May in 2013 (April 12, 19, 26,
and May 3rd), environmental water samples were collected from the
surface of the water in three different sites in the Parkerson Mill
Creek watershed (Figure1), a total of 12 samples were collected in
sterile 1-liter plastic bottles. In order to extract the bacterial cells
from the water, 500 ml of each sample was vacuum filtered through
0.45μm pore size, 47mm diameter nitrocellulose membrane filters
(Thermo Fisher Scientific, Waltham, MA). The membrane filters
were then stored at -20°C prior to DNA extraction.
DNA Extraction
All DNA extractions were performed using the Power SoilTM DNA
Isolation kit (Mo Bio Laboratories, Inc., Carlsbad, CA). Following the
manufacturer’s instructions, 0.25 g of each fecal sample or 300μl
of concentrated sewage were used for the DNA extraction. DNA
from water samples were extracted from membrane filters that had
been cut into small pieces prior to extraction. DNA concentrations
were quantified using a NanoDrop ND-1000 UV spectrophotometer
(Thermo Scientific, Wilmington, USA).
End-Point PCR and qPCR Assays
The primers used in this study are listed in Table 1. End-point
PCRs were performed on a TGRADIENT thermal cycler (Whatman
Biometra®, Germany). Each 25μl reaction mixture contained 5μl
of 5x colorless GoTaq® Flexi buffer, 1.5mm of MgCl2 solution, 0.2
mM of dNTPs, 0.5μm each of the forward and reverse primers for
the genetic markers, 0.4 mg/ml of bovine serum albumin (BSA),
0.08 unit/μl GoTaq® DNA polymerase, 2.0μl template DNA, and
an appropriate volume of PCR grade water. The thermal cycling
parameters for each PCR assay were 94°C for 2 min, followed by
30 cycles of 94°C 60s, 60°C (for the different markers’ annealing
temperature please see (Table 1) 45 s, and 72°C 60 s, then 72°C
for 7 min. The end-point PCR products were resolved using 1.5%
agarose gel electrophorese and viewed under UV light to verify
the absence or presence of the target gene. No Template Controls
(NTC) containing PCR grade water only and positive controls were
included in each instrument run for quality control. Real time PCR
assays (All Bac, HF183, CowM3, and CowM2) were performed using
the Step One real time PCR instrument (Applied Biosystems, NY).
The reaction mixture (15μl) contained 1x SSO AdvancedTM SYBR®
Green Super mix (BIO-RAD, CA), 0.7μg/μl BSA, 0.2μm of each primer
and 5μl of template DNA. All reactions were performed in duplicate
and began with a hold at 95°C for 10 min, followed by 40 cycles of
95°C 15s, 60°C 30 s, and 72°C 30 s. For each set of experiments, a no
template control with two replicates was included and a calibration
curve with a concentration spanning the range from 10 to 106 gene
copies per reaction with two replicates was constructed.
Data Analysis
The Amplification Efficiencies (AE) were calculated based on
the following equation:
E= 10(-1/slope) – 1
The related statistical analyses were performed using SAS® 9.3
software. ArcGIS 10.2 software for desk top was used to generate a
sampling map for the Parkerson Mill Creek watershed.
Results
DNA extracts from a total of 133 fecal samples and 10 wastewater
samples were analyzed and the results are shown in Table 1. The
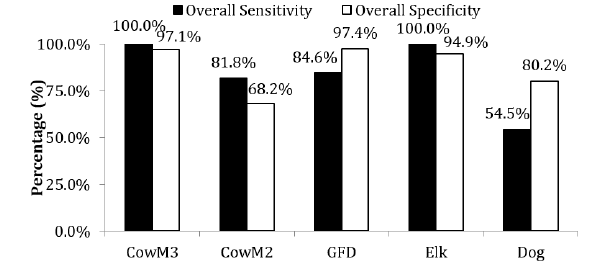
CowM3 Bacteroidales marker exhibited 100% sensitivity and 97.1%
specificity, so the assay met the 80% benchmark suggested by the
USEPA (2005) for both specificity and sensitivity. However, false
positive amplification was also observed in four non-target DNA
samples (two sewage and two deer samples). The CowM2 marker
was present in 9 of 11 cattle fecal samples, resulting in 81.8%
sensitivity. The CowM2 marker cross reacted with 42 non-target
fecal DNA samples: 34.6% (n=9) Canada goose, 66.7% (n=6) duck,
50% (n=5) sewage, 71.4% (n=15) dog, and 53.8% (n=7) chicken,
resulting in 68.2% specificity. Although the GFC marker for Canada
goose was detected in 84.6% of the goose fecal samples it also
exhibited a 100 % cross-reaction with human fecal samples, so in
this case, we chose to use the GFD marker in our primer evaluation
study instead. The GFD marker was positive in 84.6% and 27.3%
of goose and chicken samples, respectively (Figure 2). The overall
specificity and sensitivity of the GFD marker were 97.4% and
84.6%, respectively and although it had some cross reaction with
chicken fecal samples (27.3%), it fully distinguished duck samples.
Similarly, the elk marker was positive in 100% of the deer fecal
samples, though it also cross reacted with the cattle (3/11) and
goat (3/3) samples. The overall specificity and sensitivity of the elk
marker were 94.9% and 100%, respectively. The dog marker was
detected in 12 out of 22 dog fecal samples, 10 out of 10 sewage samples, and 14 out of 14 horse fecal samples, giving the dog
marker the lowest values for specificity and sensitivity, at 80.2%
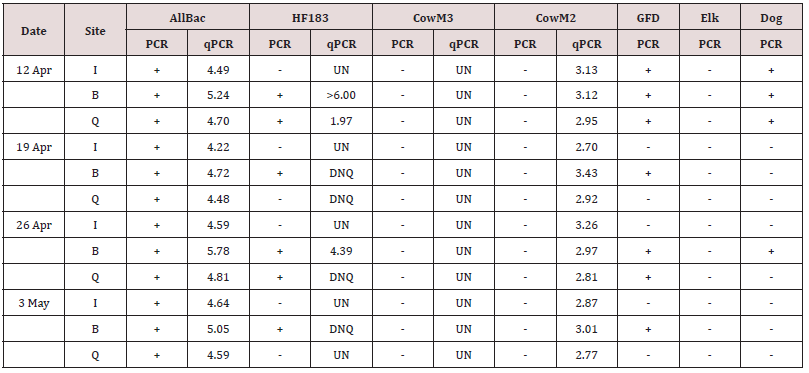
and 54.5%, respectively, of the species tested. The All Bac genetic
marker targeting the general Bacteroidales was detected in all 12
environmental water samples (Table 2). The human marker was
detected in 6 out of 12 and 7 out of 12 water samples in the endpoint
and real-time PCR assays, respectively. The Site B samples
for all four sampling dates were positive for the human marker,
as were the samples collected on April 12 and April 26 at site Q.
Similarly, the dog marker was detected in one third (4 out of 12) of
the water samples. The marker for Canada goose was detected in
58.3% (7 out of 12) of the water samples, with every sample from
site B testing positive for this marker. Two samples from site Q,
collected on April 12 and 26, showed positive results for the GFD
marker. Neither CowM3 nor elk markers were detected in any of the
12 water samples.
Table 2: Detection of host associated genetic markers in water samples collected from Parkerson Mill Creek.


(The unit for real-time PCR: log10 copies/100ml water).
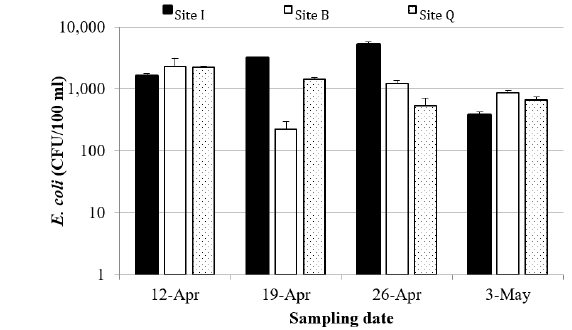
All of the 12 environmental water samples collected from
the three locations were positive for E. coli (Figure 3), with
concentrations ranging from 225 CFU/100 ml on April 19 at site
B to 5200 CFU/100 ml on April 26 at site I. Both Site B and Site
Q had significant high concentrations on April 12, probably due
to the rainfall on that day. Site I had the largest geometric mean
for E. coli concentration and site B the lowest. All sites exceeded
the USEPA’s criterion for recreational water quality (USEPA 2012),
which is a geometric mean of 126 CFU/100ml water. Eleven
out of the 12 samples also exceeded the USEPA’s single sample
maximum for E. coli concentration, which is 410 CFU/100ml. The
relationship between the E. coli concentration and the All Bac
marker concentration was weak (results didn’t show).
Discussion
The Canada goose specific genetic markers (GFC and GFD) were
chosen for evaluation in our study. The other genetic markers used
in our study to identify the sources of fecal pollution were based on
Bacteroidales and its relatives (Table 1), as the order of Bacteroidales
is known to be both abundant and common in mammalian feces.
However [19] characterized the fecal microbial community
from Canada goose, suggesting that the majority of the genes
sequenced were related to Clostridia or Bacilli or, to a lesser degree,
Bacteroidetes. Canada goose Bacteroidales specific genetic markers
have also been reported elsewhere [20], but these genetic markers
were not chosen for the current study because although they are
relatively temporally stable, they have low sensitivities. In Green
[18] study, the GFC and GFD markers targeted were Catellicoccus
marimammalium and Helicobater spp., respectively, with GFC
occurring at a higher concentration as more ribosomal operons
in Catelli coccus.. However, the GFC marker failed to distinguish
between waste pollution from human and goose samples in the
present study, so we discontinued our evaluation of the GFC marker
on other fecal samples. This result suggests that genetic markers
need to be validated across a range of conditions, even when they
appear to be highly specific when initially reported. Here, the
GFD marker exhibited a 27.3% cross amplification with chicken
samples, which is consistent with Green et al.’s research as GFD was
originally developed to detect avian fecal samples. We found that
it actually had a higher sensitivity (84.6%) on goose samples than
the 68% reported in Green et al.’s original study. Therefore, our
results for the GFD marker support the sensitivity and specificity of
PCR assays for identifying Canada goose-associated fecal pollution
in freshwater. CowM2 and CowM3 are both well-developed cattle
associated Bacteroidales genetic markers that have been widely
used in various MST research studies. Although CowM2 was
reported to perform better than CowM3 by Raith et al. [21], a lower
sensitivity for CowM2 (50%) has also been reported elsewhere
[22]. However, the applicability of those results to other regions
is potentially limited due to factors such as host diet, climate and
geographic location. In our study, we found a much lower specificity
for CowM2 (68.2%) compared with previous studies, some of
which have reported values of over 98% [21,23,24]. There are
several possible reasons for this discrepancy. First, geographical
differences could affect host associated Bacteroidales markers
significantly due to differences in the diet and animal digestive
tract physiology. Layton [17] found that Bacteroidales 16S rRNA
gene sequences obtained from pig were more closely related to
Bacteroidales 16S rRNA gene sequences obtained from humans
than to cattle sources, even though pig and cattle are in the same
order of Artiodactyla. Second, the evaluation of the same set of
samples may produce different results when examined from a
presence absence or quantitative perspective. When there are cross
reactions with non-target feces in PCR assays, this is usually at a low
level compared with the signal for the target feces and will thus tend
to be classified as false positives in end point PCR evaluations but
not in real time PCR evaluations [25]. Third, the decay rates for the
host-associated markers in the environment may be different due
to their size and function [26]. CowM2 targets a 437 bp fragment as
encoding an HDIG domain protein involved in energy metabolism
and electron transport, while CowM3 targets a 569 bp fragment
encoding a sialic acid-specific 9-O-acetylesterase secretory protein
involving cell envelope biosynthesis and the degradation of surface
polysaccharides and lipopolysaccharides [27-28], so the decay rate
of these two proteins in environmental water after release from
local animal tracts or the abundance variation of the proteins in
fecal samples may explain the discrepancy.
The CowM3 marker, on the other hand, had an overall specificity
of 97.1 % and 100% sensitivity, which is consistent with previous
studies that reported CowM3 to have both a broader target host
distribution and greater stability [21,27]. The relative abundance
of the host associated genetic markers for CowM3 was 32.6
times greater than the CowM2 marker concentration in the same
DNA sample, and this value compares favorably with the results
previously reported by Shanks [28]. The amount of target gene in
each cell may explain the different target copies detected in the
same DNA samples by the different markers [29] pointed out that
the CowM2 marker targets a single copy gene involved in energy
metabolism. Here we hypothesize that there may be two or more
CowM3 target genes involved in cell envelope biosynthesis and the
degradation of surface polysaccharides and lipopolysaccharides.
This result also indicates that not only is CowM3 more specific, but
it also has higher sensitivity and a lower detection limit than CowM2
due to its greater abundance. Thus, it will be necessary to validate
the specific genetic marker that will be used in each different
geographic location because the performance characteristics may
change and will thus affect the evaluation results. The dog associated
marker DF475F was paired with Bacteroidales specific Bac708R
and analyzed in our study against 143 target and non-target DNA
samples. Dick [30] who developed this dog marker, found no cross
amplifications with human, cat, cow, pig, chicken, or gull sources.
However, they also pointed out that the horizontal transfer of fecal
bacteria may occur among species in close contact, such as humans
and their pets, which suggests the potential for cross reactions with
the dog marker in human samples. This is probably why our results
showed that this primer set amplified 100% of the sewage DNA
representing human sources. Since this primer was the first and
only dog specific primer that has yet been identified, the similar
results for dog primer in Dick et al.’s research suggests the need
for future work in this area to optimize the primer and reaction.
Elk primer was found to amplify both the cattle and goat samples,
which is consistent with previous studies that reported that deer/
elk primer could not distinguish between Bacteroidales sequences
from deer/elk and sheep. Our results suggest that combining
the results from CowM2, CowM3, and elk markers should make it
possible to distinguish between cattle and deer/elk fecal pollution.
The All Bac genetic marker was designed to target the 16S rRNA
genes of Bacteroides spp. and provides a rapid direct measurement
of fecal contamination in water due to feces from warm-blooded
animal sources [16]. The positive results for the All Bac genetic
marker in all the water samples in the present study provides
an estimate of the total fecal contamination present in the water
samples. The human marker was detected in 6/12 and 7/12 of
the water samples using end point and real time PCR assays,
respectively. All samples from site B has been detected with HF183
marker, which suggests a potential source of human fecal pollution
close to this sampling site. However, there was no CowM3 signal
detected by either end-point PCR or real-time PCR. The discrepancy
results were observed between end-point and real time PCR assays
with CowM2 marker probably due to the cross-reaction of CowM2
marker with non-target feces since the low target concentration
was detected. Given the lack of signal detected for the deer/elk
marker, the positive signal for CowM2 in the environmental water
samples is probably due to the presence of human fecal pollution.
The samples that were positive for human signals also amplified
the dog marker; these sites were Site B and Site Q on April 12, and
Site B on April 26. Since the dog marker was detected in 100% of
the human samples, the positive signal for the dog marker in the
water samples was probably due to the presence of human fecal
pollution. Similar results for the GFD marker are likely to indicate
the presence of fecal pollution from Canada goose; during the
sampling season, Canada geese were observed around the sampling
site, which is consistent with these results. Interestingly, there was
no signal detected due to the CowM3 marker in samples collected
from site Q, even though this site is close to the beef teaching center
at Auburn University and beef cattle were observed on site. That
was probably because site Q was located at the upstream of beef
teaching center. Future work may be needed to add more sampling
sites locate downstream of beef teaching center. This result suggests
the capacity of MST to identify major pollution sources from among
many possible sources.
Follow on Linkedin : https://www.linkedin.com/company/lupinepublishers
Follow on Twitter : https://twitter.com/lupine_online


No comments:
Post a Comment
Note: only a member of this blog may post a comment.