Tuesday, 29 November 2022

Lupine Publishers| Comparison of Non-Destructive and Destructive Testing on Concrete: A Review

 Lupine Publishers| Journal of Civil Engineering and its Architecture


Abstract

Concrete is the oldest and most important construction material in the world. Testing of the concrete specimen plays and important role to know about the strength, durability and condition of the structure. The work will present a detailed comparison between the destructive tests and non-destructive methods. This work focuses on comparing the destructive and non-destructive testing which can determine the potential durability of the concrete. This work helped us to reach a conclusion where we can further find the best testing method system that shall be applicable for various concrete structures as well as in the concrete industry.

Keywords: Concrete; Compressive Strength; Destructive Testing; Non-Destructive Testing; Strength

Introduction

Concrete is the oldest and most commonly used construction material in the world, because of its durability, low cost and high availability Hassan [1]. It provides the most cost effective and efficient means of construction. Testing of concrete ranges from non-destructive where there the concrete specimen is not damaged to destructive testing where the concrete specimen might be slightly or completely damaged. 2 billion tons of concrete was produced in the year 2004 in the world, with India contributing 116.1 million tonnes Bhatacharjee, [2]. In today’s world concrete is made using various kinds of cement, coarse/fine aggregates, water, and admixtures if any. Proper infrastructure is one of the biggest drawbacks that halt the growth in India. The 12th five-year plan laid a special focus on the growth of infrastructure in India i.e. roads, highways, railways, communication and ports. One trillion is being invested in this sector during the 12th year plan. The world views India as a capable nation which is expected to show a growth from 1.2-1.5 billion by 2040 surpassing China which is already leading as the most popularly grown nation Rai and Ghavate [3]. A recent global report “Global Construction 2020” estimated India to be the third largest global construction market after USA and China. Today, the enhancement in the design capacity in India has reached a level where it is possible to design concrete with strengths of more than 100 MPa which wasn’t possible earlier. China has already used concrete strength up to 80MPa for high rise building construction within the cement usage set by the code standards Chatterjee [4].

The destructive testing method is suitable and economically beneficial for the concrete specimens that are produced at a large scale. The main aim is to investigate the service life and detect the weakness of design which might not show under normal working conditions. It includes methods where the concrete specimen is broken so as to determine mechanical properties i.e. hardness and strength. This type of testing is very easy to carry out, easier to interpret and yields more information. Some popular destructive test methods are as follows Shankar and Joshi [5]:

I. Tests of mechanical properties using the universal testing machine (UTM):

a) Tensile testing.

b) Bending testing

c) Compressive testing

II. Hardness testing.

a) Brinell test

b) Rockwell test

III. Impact testing

a) Pendulum test

b) Drop weight test

Destructive testing includes mechanical testing (bending, impact tests, tensile), macro/microhardness testing as well as metallographic examination. The various advantages of destructive testing are listed below:

A. Tests are economical and can be performed at a cheaper rate.

B. Equipment cost for destructive testing is cheap as compared to non-destructive testing.

C. It identifies mechanical properties (fracture strength, elongation, and modulus of elasticity)

D. It helps to reduce failures, accidents, and costs.

E. It helps in verifying the properties of the material Shankar and Joshi [5].

The various disadvantages of destructive testing are:

a. The internal defects of the concrete i.e. bubble, pores etc. can’t be determined.

b. The concrete specimens cannot be used again after the testing.

c. It cannot be used to detect early age deformities in concrete Kumavat et al. [6].

Non-destructive testing (NDT) is mainly concerned with the evaluation of flaws in materials which are in the form of cracks and which might lead to loss of strength in a concrete structure (Samson et al. [7]. NDT is a method for the testing of existing concrete structures so as to determine the durability and strength. In the modern construction world, it has become a vital part of the quality control process. NDT also helps in investigating about the crack depth, deterioration and microcracks present in concrete. Large no of parameters like density, strength and surface hardness can be determined by using NDT methods. It is also possible to check the integrity of structure and quality of workmanship by detecting cracks and voids Kumavat et al. [6]. It is applicable on both new as well as existing structures. Various NDT methods used in the field are as follows:

i. Rebound hammer test

ii. Ultrasonic pulse velocity test

iii. Combined ultraviolet and rebound hammer test

iv. Core extraction test

v. Ingredient analysis test.

The main aim of NDT is to assess one or more of in situ strength properties i.e. density, durability, and moisture content. NDT is the only way to assess the depth of cracks and to investigate whether any structural damage has occurred. Structural health monitoring by NDT like rebound hammer and UPV becomes very useful for the prediction of the service life of structure (Hannachi and Nacer, 2012). Experimental investigations determine that a good correlation exists between rebound hammer, UPV, and compressive strength. Rebound hammer test can be used alone to determine the compressive strength of concrete. UPV is an ideal NDT method to predict the deterioration of structures and the service life of structures. NDT has a vital role in everyday life and is very important to ensure reliability and safety. The main advantages of non-destructive testing are listed below:

I. The probe test generates variable results and provides the fastest means of checking maturity and quality of concrete.

II. Schmidt hammer test provides a simple, quick and inexpensive method of obtaining the indication of the strength of concrete with an accuracy of 15 to 20%.

III. Pull-out tests give information on development and maturity

IV. UPV method is the most ideal tool for determining whether concrete is uniform or not.

V. Radioactive equipment testing is very simple, and the running cost is less, although the initial price might be very high.

The main disadvantages of non-destructive testing are:

A. Interpretation of results is difficult.

B. The manual operation requires experienced and skilled technicians.

C. It is difficult to inspect the concrete specimens that are irregular and full of voids Kumavat et al. [6].

Literature Review

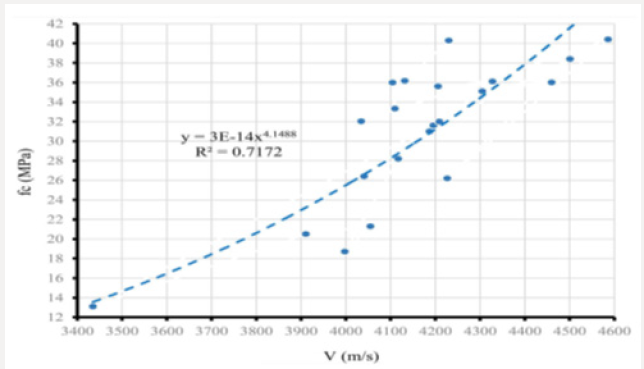
Figure 1: Compressive strength vs velocity of concrete specimens Lopez et al. [8].

Lupinepublishers-openaccess-journals-Civil-engineering-Architechture

Kumavat et al. [6] carried out an experimental study on combined methods of NDT in concrete and evaluation of core specimen from existing buildings. Ultra-pulse velocity rebound hammer and core tests were carried out on the specimens according to IS standards and combining the two methods. Regression analysis was carried out and correlation coefficients were given. Charts were plotted between rebound numbers, UPV against the compressive strength of the core specimen. The comparison showed that use of combined methods gives higher efficiency on estimation of concrete compressive strength. The results obtained gave a correlation coefficient of 0.003 and 0.355 for rebound value and UPV value. A higher correlation coefficient of 0.441 was obtained when two methods were combined. Lopez et al. [8] experimentally studied the concrete compressive strength estimation by NDT. The main aim was to produce a correlation between results of surface hardness, UPV and compressive strength of structural concrete in bleachers of a soccer stadium in Parana, Brazil. The concrete structure used in the study was 26 years old and had some severe deformities i.e. segregation, corrosion, and cracks. Mapping reinforcement was performed and UPV test was done according to the IS standards. 26 specimens of concrete were collected and correlation curves between NDT results were plotted. The results showed that stronger the concrete, higher shall be its surface index as well as its wave propagation velocity. Results also showed a good correlation between both surface hardness test and UPV test (Figure 1).

Bhosale and Salunkhe [9] experimentally found the relation between destructive and non-destructive tests on concrete. Different concrete mixes of M20, M25, and M30 were used and a slab of 2000*1000*200 mm was casted for each grade and cores were extracted from the slab. Cylinders of size 100*200mm, Cubes of size 150*150*150mm and cubes of 150*150*150mm with an inserted bar of size 16mm were cast. Casted cubes after 28 days were tested to obtain compressive strength using CTM. Rebound hammer test was performed and an average of 12 readings was taken. Regression analysis was done, and various correlations were achieved which are given as follows:

1) The relation between the compressive strength of cylinders (f cyl) and cores (F cor)

F cor = -0.034 f cyl2+ 2.586 f cyl -19.25

2) Relation between rebound strength of cylinders (R cyl) and cores (R cor)

R cor= -0.020 Rcyl2+2.15 R cyl -16.75

3) Relation between rebound ultra-pulse velocity of cylinders (U cyl) and cores (U cor)

U cor= 1.373 U cyl2+ 12.18 U cyl -22.95

4) Relation between rebound strength (R cor) and UPV strength of cores (f cor)

R cor= -0.050 f cor2 + 3.987 f cor – 31.16

5) Relation between UPV (U cor) and compressive strength (f cor) of cores

U cor= -0.003 f cor2+ 0.18 f cor +1.410

6) Relation between rebound strength and UPV of cores

U cor= -0.002 R cor2 +0.166 R cor + 1.671

7) Relation between rebound strength and compressive strength of cylinders

R cyl = -0.037 f cyl2 + 2.712 f cyl -19.85

8) Relation between UPV and compressive strength of cylinders

U cyl= 0.0222 f cyl + 3.64

9) Relation between rebound strength and UPV

U cyl= 0.001 R cyl2-0.052 R cyl + 4.355

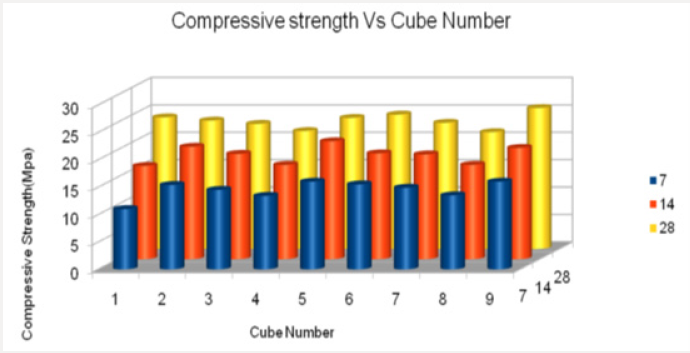
Figure 2: Compressive strength vs. cube no at 7, 14 and 28 days Patil et al. [10].

Lupinepublishers-openaccess-journals-Civil-engineering-Architechture

Patil et al. [10] deduced the comparative study of the effect of curing on strength of concrete using DT and NDT methods. 27 cubes of M25 grade were casted and allowed to be cured for 7, 14 and 28 days and rebound hammer test and compressive strength test was performed on 9 cubes of 7, 14 and 28 days respectively. The results showed that the rebound number increased as the compressive strength increased and vice-versa. For 28 days of curing decrease in percentage, strength was less as compared to 7 days percentage decrease in strength and average error in measuring compressive strength for 7, 14 and 28 days by rebound hammer and CTM was found out to be 20.01%, 1.37%, and 0.99% respectively. Results also showed that compressive strength or rebound number could be produced if only one of the values was known (Figure 2).

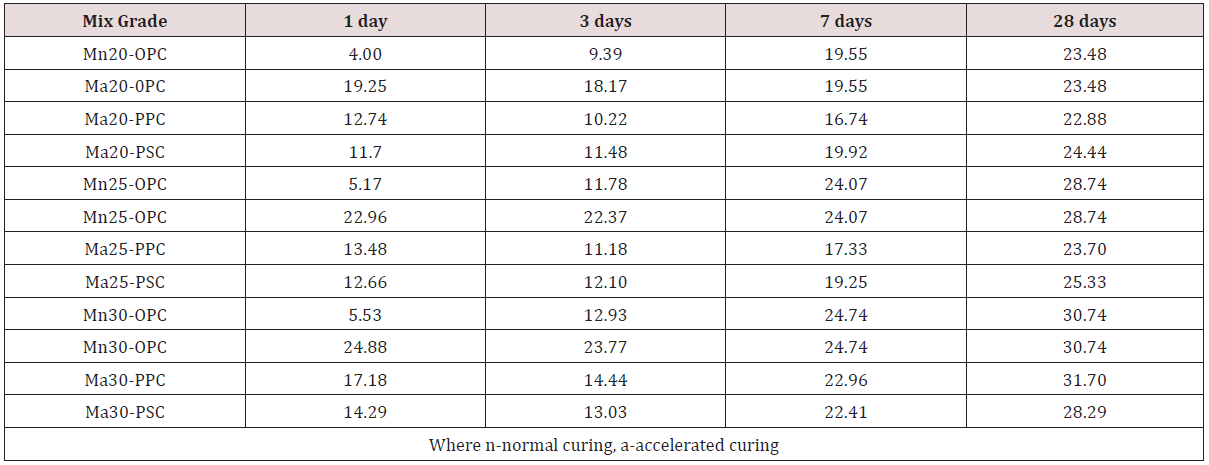
Balwaik [11] experimentally compared the direct, semi-direct and indirect method of testing. A randomly selected school building was taken and a complete analysis of all the structural members was carried out using the direct method of testing. Various defects like air gaps, hollow spaces and voids were identified and all the structural members were grouted at junction points so as to avoid collapsing of members. Results showed that direct UPV method was found to be reliable in detecting of the flaws as compared to indirect and semi-direct methods of testing. Damodar and Gupta (2014) experimentally investigated to develop an ideal curve equation for early prediction of concrete’s compressive strength. OPC, PPC and PSC cement were used in the experimental work.18 cubes of the 1st batch of M20, M25, and M30 grade were cast and subjected to normal curing. 3 cubes from every mix were tested for compressive strength at 1 and 3 days respectively and the result of an average of 3 cubes was taken. Results obtained from the experiment showed that OPC gained strength of 80% in the 1st day of accelerated curing while as PSC and PPC only gained 50% strength in the 1st day and these results could be used in future for prediction of the early strength of concrete. Results also showed that an ideal curve equation could be obtained and used in computing the compressive strength of concrete (Table 1). The gain in compressive strength is given by: y= (ab) x

Table 1: Compressive strength comparison of Mix M20, M25 and M30 in MPa (Damodar and Gupta, 2014).

Lupinepublishers-openaccess-journals-Civil-engineering-Architechture

Where, y represents compressive strength, a represents factor comprising parameters of various design mixes, b represents the coefficient of no of days the system has been subjected to curing and x represents no of days the cubes which are subjected to curing.

Savaliya et al. [12] studied the effect of age on mortar and concrete specimens through an experimental program. 6 concrete and mortar beams of size (150x150x700mm) and 6 concrete and mortar cubes of size (150x150x150 mm) were cast and subjected to direct, indirect and semi-direct UPV testing at 7, 28 and 56 days respectively. Results showed various relations between velocities of UPV, the age of mortar and concrete. The relation between velocity and age of concrete, where y represents the ultra-pulse velocity and x represents the age of concrete

y = 0.0244 ln (x) + 4.6277

The relation between velocity and age of mortar, where y represents the ultra-pulse velocity and x represents the age of mortar.

y = 0.1132 ln (x) + 3.2871

The results also showed that velocities measured by keeping the transducers on the bottom and top surfaces in semi-direct UPV testing gave different results. The relation between age of concrete and velocity of transducers on the top surface, where y represents the velocity and x represents the age of concrete.

y = 0.1051 ln (x) + 4.7836

The relation between age of concrete and velocity of transducers on the bottom surface, where y represents the velocity and x represents the age of concrete

y = 0.0469 ln (x) + 5.0426

Nacer and Hannachi [13] investigated the application of the combined method of UPV and RH tests for calculation of compressive strength. UPV and RH tests were measured with mechanical tests done on cylindrical specimens. The tests were used to arbitrate quality of concrete using regression analysis modes. Equations were obtained by statistical analysis to analyses concrete’s compressive strength on site. Correlation charts were plotted, and regression equations were listed (Table 2). The results showed that using more than one NDT provided a better correlation and lead to predictable evaluation of concrete’s strength. The results also showed that combined methods appeared more appropriate on conditions of on-site measurements as they were very fast, convenient and cost efficient. Shang et al. [14] found the strength of concrete using NDT methods using experimental study. All the samples were made from locally available materials and were confirmed to Chinese standard (GB 175-2007). Five sets of M20, M25. M30, M40, and M50 mixes were prepared and each containing 21 concrete cube specimens of the size (150x150x150mm). Rebound hammer test was performed on the specimens and 16 readings were taken for each specimen. Regression analysis was done, and curves were drawn for the rebound hammer method. Results showed that the rebound hammer was found reliable in predicting the early strength of concrete. It was concluded that regression models for the assessment of strength could be used for prediction of concrete strength (Table 3). Shariati et al. [15] assessed the strength of RC structures through UPV and rebound hammer tests and an interrelationship between DT and NDT tests was established. Main members of an existing building including a column, beam, and slab were tested by NDT. Regression analysis was done, and calibration curves were drawn. Correlation between predicted and actual compressive strength of concrete was interpreted by plotting average rebound no/ultrasonic pulse velocity against the compressive strength of each member. Results obtained from the experimental study showed that the regression model achieved from the combination of two NDT methods was more precise as compared to the individual methods. Results also showed that the rebound number method was more effective in forecasting the compressive strength of concrete than the UPV test method. The best-fit curve that represents the relationship for UPV results has the following equation:

Table 2: Regression equations for Cylindrical and core Specimens (Hannachi and Nacer, 2012).

Lupinepublishers-openaccess-journals-Civil-engineering-Architechture

Table 3: Rebound Curve for Concrete measurement and error (Shang et al., 2012).

Lupinepublishers-openaccess-journals-Civil-engineering-Architechture

fc (V) = 15.533V - 34.358

Where V is the ultrasonic pulse velocity. The best fit curve that represents the relationship for the combined method has the following equation:

fc (V) = -173.04+4.07V2+57.96V+1.31R

Where V is the ultrasonic pulse velocity and R is the rebound number.

Aydin and Saribiyik [16] carried out an experimental investigation to develop a relationship and correlation between rebound hammer test (NDT) and compression test (DT). Cube specimens of size 15*15*15cm and a no. of core samples from different RC structures were tested. Rebound hammer test and the compressive test was performed on the specimens. The curves were drawn and the best fit correction factors for concrete compressive strength were obtained through processing the correlation among the datasets. The results drawn from the investigation showed that use of rebound hammer test on existing buildings was not found suitable for evaluation of strength in old structures of concrete. Results also revealed that rebound hammer tests could be used alone as a reliable means to estimate the strength of concrete specimens if the needed calibrations were done (Table 4).

Table 4: .Regression outputs for 28 and 90 days concrete specimens (Aydin and Saribiyik, 2010).

Lupinepublishers-openaccess-journals-Civil-engineering-Architechture

Turgut and Kucuk [17] carried out an experimental study to compare direct, indirect and semi-direct UPV testing on 30 concrete blocks of size (30x30x25cm) at 28 days. 6 locations were taken in each measurement for each concrete block with path lengths of 250, 150, and 195 for direct, indirect, and semi-direct testing respectively. Results showed that average direct UPV was 9% higher than indirect and semi-direct UPV in concrete blocks. Results also showed that direction of casting in concrete affected UPV. It was found out that UPV was less in concrete casting direction than in horizontal direction. The regression analysis was carried out and best fit lines representing the relationships have been summarized in Table 5.

Table 5: Correlations between UPV measurements (Turgut and Kucuk, 2006).

Lupinepublishers-openaccess-journals-Civil-engineering-Architechture

Conclusion

It has been seen from the literatures reviewed that both the destructive and non-destructive tests help in assessing the strength of concrete. At times where the destructive tests on concrete cannot be employed, one prefers to utilize the non-destructive tests. NDT has a vital role in everyday life and is very important to ensure reliability and safety. A number of advantages were discussed for the various tests that are a part of NDT. The researchers at various instances found that the combination of the NDT tests proves to be more accurate and beneficial than one of the tests alone. The results drawn from the investigations also showed that use of rebound hammer test on existing buildings was not found suitable for evaluation of strength in old structures of concrete and rebound test was useful in finding the early strength of concrete. Results revealed that It was concluded by various researchers that regression models for the assessment of strength could be used for prediction of concrete strength. Thus, it is concluded that using more than one NDT provides a better correlation and lead to predictable evaluation of concrete’s strength. The results also revealed that combined methods appeared more appropriate on conditions of on-site measurements as they were very fast, convenient and cost-efficient.

Read More About Lupine Publishers Journal of Civil Engineering and its Architecture Please Click on Below Link: https://lupinepublishers-civilengineering.blogspot.com/

Lupine Publishers| Malocclusion and Changes in Orofacial Motricity in Children Patients

 Lupine Publishers| Journal of Dentistry and Oral Health Care


Abstract

Introduction: Orofacial motricity is related to the functional and structural aspects of the orofacial and cervical regions, including the functions of the stomatognathic system. There is evidence on the possibility of alterations of the orofacial myofunctional and malocclusions.

Objective: to determine the frequency orofacial motricity alterations in children with malocclusion and also to verify the possible existence of association between these variables.

Methods: A cross-sectional study of the secondary data of children patients undergoing an extension program at the Federal University of Pernambuco, city of Recife, Brazil. Those of both sexes, aged between six and nine years, according to the inclusion criteria and attended between the years 2016 and 2017, in the actions of the Speech and Hearing and Dentistry team.

Results: Sample of 44 children, both gender, 56.8% male, with a mean age of 7 ± 08 years old. The frequence of orofacial motricity alterations reached 61.4%; 70.5% had deleterious oral habits and 54.5% had non-ergonomic postural habits. There was a significant association between the presence of orofacial motricity alterations and Angle’s Class II malocclusions, presence of anterior open bite and posterior crossbite (p <0.05). Also between non-ergonomic postural habits and posterior crossbite (p<0.05).

Conclusion: Changes in orofacial motricity were observed in more than half of the children’s patients, and there was an association with some investigated malocclusions.

Keywords: Malocclusion; Mastication; Child Health Services; Orofacial Motricity; Harmful Oral Habits

Introduction

Malocclusion is a developmental disorder of the facial skeleton that affects different groups of muscles, such as facial expression, mastication and tongue muscles. It has a multifactorial origin which means that it can be caused by congenital, hereditary or local factors that have repercussions on the development of dental arches [1]. In addition to the problems related to the function, which are originated from morphological alterations, another relevant aspect that is also involved is the facial aesthetic, which causes psychological distress in those individuals who are affected with this condition [2]. According to data from the World Health Organization (WHO), malocclusion is the third complication of oral problems, following the top two which are tooth decay and periodontal disease. Furthermore, according to the National Research in oral health, SB Brazil 2010, nearly 25% of the children by age 5 had one type of malocclusion, also the numbers keep increasing among older children. Thus, malocclusion represents a serious public health problem due to its high prevalence and negative impacts on the quality of life of those individuals who are affected with it [3].

Orofacial Motricity (OM) is related to the functional and structural aspects of the orofacial and cervical regions, including the functions of the stomatognathic system, such as suction, swallowing, chewing, breathing and articulation [4]. Due to the anatomical complexity of these muscular structures and because they are so closely connected, any alteration could cause disturbances, in both Speech Therapy and Dentistry areas, and those sequelae can affect functional and esthetic elements [5]. Studies have shown a high frequency of malocclusions and alterations in children which are related to orofacial motricity problems. These changes could be particularly associated with the presence of deleterious oral habits; which represents one of the most important risk factors for the development of malocclusion and cause damage to the phonoarticulatory organs, changing not only the functionality of mastication, but also speech and swallowing [6]. Therefore, despite the scientific evidence regarding the association between malocclusion and alterations in orofacial motricity, the amount of interdisciplinary studies on the subject is not sufficient. Consequently, it is very difficult to have a full understanding and specific approaches when treating the patients who have those problems. This study aims to determine the frequency of alterations in orofacial motricity of children with malocclusion, by verifying the possible association between these variables.

Methods

This research is linked to the activities of an Extension Program at the Federal University of Pernambuco, “Smiling in Family” (SOFA) city of Recife, northeast of Brazil, with interdisciplinary approaches to improve oral health for the children patients and their families (Dentistry, Law, Medicine, Occupational Therapy, Psychology, Social Assistance and Speech-Language). This study was approved by the Ethics in Research Committee of the Federal University of Pernambuco (CAAE 77741417.0.0000.5208). All the children patients that participated in the study were authorized by the parents and ∕ or guardians through the signing of the consent form. For this study, 103 charts of children patients were taken in consideration. The age of the children ranged between six and nine, both genders were included. Those children attended the extension program from the second semester of 2016 until the first semester of 2017 (only regard the interdisciplinary actions between Speech Therapy and Dentistry). The inclusion criteria for the sample were defined according to the age, from six to nine years old, mixed dentition period, when the first permanent molars was erupted and the presence of any type of malocclusion. The records of children with neurological impairment, congenital defects or undergoing orthodontic or functional orthopedic treatment were excluded before the first evaluation.

The information was recorded during the anamnesis and physical examination of the children. The variables included in this study were: age, gender, disorders related to breathing, chewing, swallowing and phonation; the presence and classification of deleterious oral habits; presence and type of posture habit, presence and classification of malocclusions. Changes in orofacial motricity included morphological changes, decreased tension and altered movement of orofacial structures, and possible functional repercussions. The morphological aspects of face, lips, tongue, cheeks and occlusion, tension and mobility of the lips, tongue and cheeks were evaluated through clinical observation; counterresistance tests with disposable wooden spatula and gloved finger to check the tension; mouth-to-smile movements, inflation and contraction of cheeks, tongue protrusion and retraction, and tongue movement towards the four cardinal points to verify mobility [7]. Problems related to breathing, chewing, swallowing, phonation, presence of deleterious oral habits and posture habits were considered. Changes in the occlusal normal pattern were considered according to the following orientations: anteroposterior, transverse and vertical. Patients were classified according to Angle criteria for the anteroposterior relationship between permanent first molars: Class I, Class II division 1, Class II division 2 and Class III. The presence of crossbite in the anterior regions (when it affected one or more anterior teeth) or posterior (when present in this region) was investigated. In this case, it was subdivided into bilateral (when present on right and left sides) or unilateral (when involving only one side). Regarding the vertical changes, it was established as a parameter of normality a vertical overpass not more than 50%, which means that the upper permanent incisors should cover only half of the clinical crown of the lower permanent incisors. When the superior incisors covered greater than 50% of the inferior incisors it was categorized as overbite, on the other hand, the absence of vertical overpass it was categorized as open bite [8].

The gathered information was tabulated in the EXCEL worksheet. The data was analyzed descriptively through absolute frequency and percentage. It was applied the Pearson’s Chi-square statistical test in order to evaluate the hypothesis of a significant association between two variables. When the investigated condition was not verified by using the chi-square test, it was used the Fisher’s exact test. The margin of error used in the statistical test decisions was 5% and the statistical program used to obtain the statistical calculations was the SPSS (Statistical Package for the Social Sciences) version 23.

Results

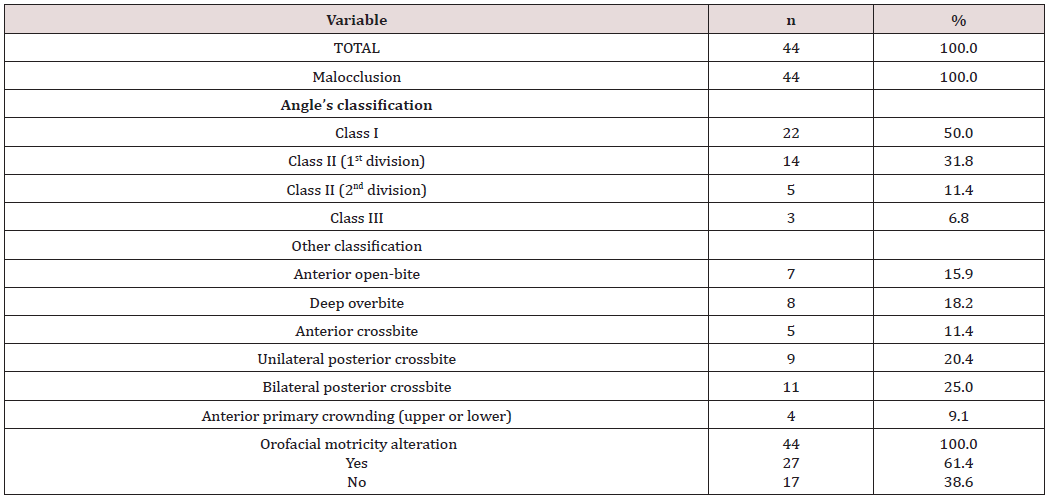
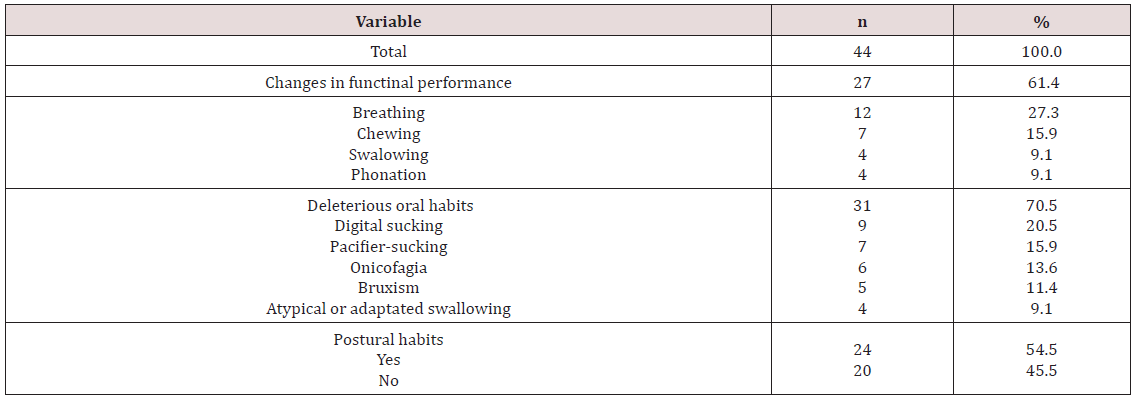
For this study, 103 charts of children patients were taken in consideration, but after the analysis, only 44 (42.7%) of those were selected. The sample was comprised of 44 infants of both genders, even though the number of male children represented 25 (56.8%) of the participants, also the average of age was 7 ± 8 years. All children that participated in the actions of the Extension Program had malocclusions. According to Angle’s Classification, the frequency of children with malocclusion Class I was 22 (50%) of the subjects. Also, among the other types of vertical, transverse, and sagittal malocclusions, it was noticed that bilateral posterior crossbite was presented by 11(25.0%) individuals of the sample, as shown in Table 1. This also presents a frequency of 27 (61,4%) for alterations in Orofacial Motricity. Table 2 shows the distribution of patients according to changes in functional performance, presence of deleterious and postural oral habits. The data in this table show that the changes in respiratory pattern were more frequent among children with malocclusion 12 (27.3%), 31 (70.5%) with deleterious oral habits, especially digital sucking 9 (20, 5%) and 24 (54.5%) with postural habits.

Table 1: Distribution of assessed children patients, according to classification of malocclusion and presence of orofacial motricity alteration.

Table 2: Distribution of assessed children patients, according to changes in functional performance, deleterious oral habits and postural habits.

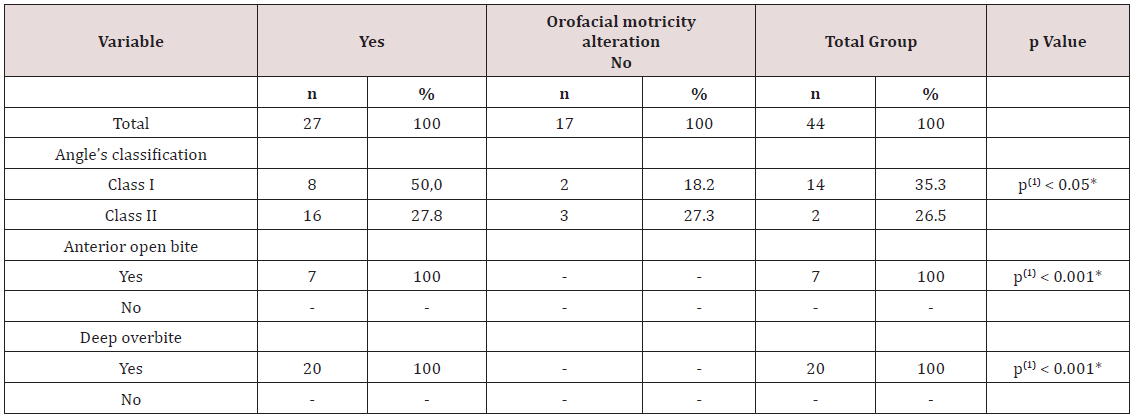
Table 3: Distribution of assessed children patients, according to malocclusion and orofacial motricity alteration.

Those last ones included, in descending order: the interposition of the lower lip and/or the tongue between the arches 12 (27.3%), protraction of the mandible 7 (15.9%) and support of the hand in the mandible 5 (11.3 %). Table 3 shows the significant changes (p <0.05) between the presence of alteration in the orofacial motricity and the type of malocclusion. It demonstrates a significant association between the presence of alterations in orofacial motricity and Angle’s Class II malocclusions (when organized as Division I and II), anterior open bite and posterior crossbite (p <0.05), by grouping unilateral and bilateral posterior crossbite for this purpose. Despite the fact that all children with Angle’s Class III malocclusion presented alteration in orofacial motricity, the test could not be established due to the low frequency of these cases, which were found only in 3 patients. Other possible associations were also tested, then it was seen a significant association between the presence of postural habits and the posterior crossbite; followed by the groups of unilateral and bilateral crossbite (p <0.05). The study did not find any significant association regarding the age or gender of the participants (p> 0.05).

Discussion

It has been very difficult to compare this study with others available in the literature. This might have happened due to the lack of studies regarding this content, mainly with the corroboration of both sciences, Dentistry and Speech Therapy, because of their differentiated methodology and approaches. This interaction allows understanding better the structures and dynamism of stomatognathic system as well as the guidelines for future researches. The methodology adopted in this research was based on a secondary data. The information gathered during the actions of the Extension Program was filed in order to be used as data for future projects. It is important to emphasize that, in this specific situation, one of the goals of the Extension Program is to do research, thus the data collected during the activities were already with this purpose. Moreover, the children’s parents signed a Term of Free and Clarified Consent authorizing to use the information for future researches. The investigated sample was a representation of the appointments in the dental clinic, which represents almost half of the patients who were treated in the period considered for this research. It was possible to determine the frequency of orofacial motricity of those who had patients with malocclusions, seeking for a possible association between the variables. On the other hand, it is not possible to compare the children with or without malocclusion, because one of the inclusion criteria was to have any type of malocclusion [9].

Regarding the distribution of malocclusion in the children during the mixed dentition period, the authors recognize this period as the one with important dentoalveolar changes; thus great part of the occlusal problems can be perpetuated in the permanent dentition if no therapeutic conduct is performed as soon as possible, especially in situations of crossbite and open bite [10]. An epidemiological study developed in the city of Lins, State of São Paulo compared the distribution of these problems according to Angle’s classification. The sample was comprised of 734 individuals by age 12. The goal of this research was to evaluate the prevalence of malocclusions as well as the severity and the need of treatment [11]. The authors observed similar results in descending order of Class I, II and III malocclusions. They also found a higher percentage of Class I (55.92%) and Class II (42.86%), with lower Class III (1.22%) as the present study.

When considering other classifications, the cross-bite has a higher frequency. A study [12] demonstrated the importance of early treatment of this common malocclusion in children’s patients. The authors established that is necessary an adequate differential diagnosis regarding its etiology, skeletal, dental or functional impairment. This study also reinforces the high prevalence of unilateral posterior crossbite compared to bilateral; however this characteristic was not seen in this current research. Changes in orofacial motricity were found in the majority of the infantile patients of this study. However, it should be considered that the sample only included children with malocclusions, which could lead to a greater predisposition of disorders mainly in the specialty of Speech Therapy. A similar result was seen in other study, but with lower percentage. For this study, in the city of Santa Maria, Rio Grande do Sul, the authors investigated the presence of speechlanguage disorders in 262 schoolers aged from four to six years old. They also found a higher frequency of alterations in orofacial motricity (31.3%), followed by alterations in speech (21.37%) and language (4.58%) [13].

These alterations can interfere in different ways, for example, the respiratory function can be altered by functional or organic factors. Thus, when the nasal breathing becomes mixed (nasal and oral) or predominantly oral, it becomes anti-physiological, which generates different compensatory changes. The presence of inappropriate postural habits, associated with oral breathing can lead to changes in growth and development of the face and teeth which are in formation. These changes lead to a change in the children’s occlusion pattern and also interfere in the phonetic system [14]. The oral habits are strongly related to the presence of malocclusions, it means that they are a potential factor in the development of alterations of the structures and functions of the Stomatognathic System, depending on the intensity, frequency and duration of the stimulus, besides the genetic predisposition of the individual. In a literature review [15] regarding this content, the open bite was observed as the most associated malocclusion. This condition happens due to mechanical interposition between the upper and lower dental arches, usually by sucking a pacifier or finger. In this current study, postural habit was more frequent in children who grew up as oral breathers, so when the oral habits persist during the child’s development it may provide a pattern of oral breathing, as was found in other studies [6,16].

According to the consulted literature [17]. Regarding the deleterious oral habits, it was found a lower prevalence of digital sucking habits when compared to pacifiers; fact not observed in the present study. It was also noticed a controversy regarding the possibility of similar or greater damages caused by digital suction due to the difficulty of removing this habit. Despite scientific evidence of the association between malocclusion and changes in orofacial motricity, the number of interdisciplinary studies regarding this content is not enough, which explains the difficulty of understanding and having a consistent approach in terms of integral health care to these problems. Even with few articles regarding this content, most of those studies shown a significant improvement in relation to the treatment as well as in the patients’ quality of life, if an early diagnosis and approach occur in the children. However, it is necessary to keep studying this content, not only seeking for an approach with methodological rigor but also comprising a more representative sample of the population so that the results can provide more conclusive information about this subject.

Conclusion

Changes in orofacial motricity were observed in more than half of the subjects, it was also noticed that oral breathing is the most frequent condition. It reinforces the need to integrate actions between Dentistry and Speech Therapy.

Read More About Lupine Publishers Journal of  Dentistry and Oral Health Care Please Click on Below Link: https://lupine-dentistry-oral-health-care.blogspot.com/

Monday, 28 November 2022

Lupine Publishers| Paraparesis caused by Aneurysmal Bone cyst (ABC)

 Lupine Publishers| Journal of Neurology and Brain Disorders


Abstract

Through the study of a case of spinal aneurysmal bone cyst managed in the Department of Neurosurgery at Hassan II University Hospital of Fez we focus our discussion of various aspects of this rare disease.

Our study concerns a male patient admitted to the emergency department for spinal cord compression that necessitated a spinal MRI. It showed T4 vertebral compression, hypointense T1, hyperintense T2 with hematic fluid levels causing spinal cord compression. The patient underwent surgical treatment with good clinical outcome. Histological study revealed a spinal aneurysmal bone cyst.

Keywords: Aneurysmal cyst; MRI-surgery; Embolization

Introduction

The aneurysmal bone cyst is a benign lesion with an aggressive character. It represents 1.4% of primary bone tumors, its spinal localization remains uncommon (3-30%) and spinal syndrome is the most frequent reason for consultation [1]. Plain radiography and CT have a significant role in its diagnosis, but MRI remains the investigation of choice. The management of spinal aneurysmal bone cyst remains controversial.

Case

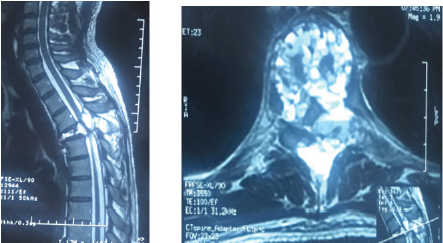
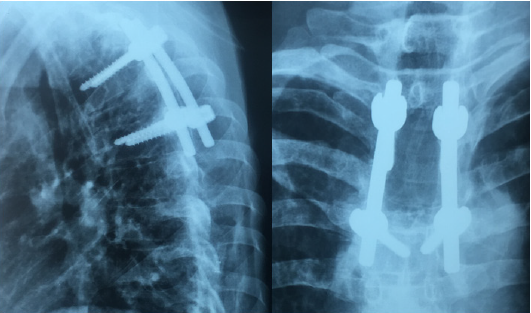
A 40 years old man, chronic smoker (a packet/day) was admitted to the emergency for a spinal syndrome for 2 years that was complicated 2 months before admission by the appearance of a grade D paraparesis, hypoesthesia with a sensory level at xiphoid process and urinary incontinence. The spinal MRI showed compaction of T4 vertebra with a heterogenous hyperintensity on T2 and STIR, a hyperintensity on T1 with heterogeneous enhancement of hematic fluid levels causing spinal cord compression at same level (Figure 1). The management consisted of performing a laminectomy of T3-T4 with pedicle screw and rod fixation of T3 and T5 vertebra (Figure 2). The postoperative course was marked by improved clinical signs. The Histopathology report came back in favor of aneurysmal bone cyst.

Figure 1: Spinal T2 weighted MRI showing (a) sagittal view with T4 compression and (b) Axial view with fluid level spaces.

Lupinepublishers-online-journal-of-neurology-and-brain-disorders

Figure 2: Spinal X-ray Lateral and anteroposterior showing post-operative pedicle screw and rod system.

Lupinepublishers-online-journal-of-neurology-and-brain-disorders

Discussion

Aneurysmal Bone Cyst (ABC) is a benign cystic lesion composed of blood-filled spaces, devoid of coating endothelial, muscle or elastic, surrounded by fibroblasts, described for the first time by Jaffe and Lichtenstein in 1942 [2]. Its incidence is 0.14 per 100,000 individuals with a female predominance (ratio 1.16) [3]. For Lichtenstein [4], the ABC is a secondary bone lesion due to hemodynamic imbalance resulting in a significant capillary dilatation, resulting from an increase in venous pressure. This increase in venous pressure might be due to venous thrombosis or abnormal arteriovenous communication. Biesecker et al [5] measured the intracystic pressure which was identical to that of arterioles and concluded that this hypertension is due to an arteriovenous fistula following a secondary lesion. Some authors [6-8] think that the appearance of an aneurysmal bone cyst would be secondary to impaired intraosseous vascular flow in the phase of consolidation following trauma. However, several cases of familial aneurysmal bone cysts [9,10] have been reported, hence orienting towards a genetic origin and indeed the genetic and immunohistochemical studies [11] have demonstrated a translocation on chromosome [7].

Aneurysmal bone cyst is most frequently found in the long bones especially the metaphyseal region [12,13], while the spinal location remains rare and affects the cervical, thoracic, lumbar and sacrum, with no case of coccygeal bone ABC reported [14]. Clinically, spinal ABC may be asymptomatic [1], but usually it manifests itself as a spinal disorder, with or without spinal cord compression signs. MRI remains the examination of choice which shows a welldemarcated bone lesion, hypointense on T1, hyperintense on T2 with a peripheral border taking contrast, defining spaces with fluid level [4]. Surgery that involves wide excision represents the preferred treatment of choice for ABC with a recurrence rate of 25% and multiple complications such as deformation and growth disorders [15]; For these reasons, selective arterial embolization was introduced into the management of this entity that proves similarly effective and with fewer complications, representing the treatment of choice in cases where the patient shows no deficit or unstable associated fractures [16]. Radiation therapy, which was an important pillar in the therapeutic arsenal, was gradually abandoned because of the risk of exposure and development of radiation-induced sarcomas [17]. Other therapeutic protocols have been proposed: the intralesional injection of calcitonin, and doxycycline Ethibloc [17-20], however they have not proven effective as with other therapeutic methods. Currently, research [21-23] has focused on the interest of Denosumab, a monoclonal antibody used in the treatment of giant cell tumors, and the intrinsic stimulation by the mesenchymal stem cells and have both shown promising results [24,25].

Conclusion

Aneurysmal bone cyst is a benign disease with unpredictable course, and thus what makes its treatment a challenge especially in locations where access is difficult. Surgery and embolization currently remain the treatment protocol of choice. Research on Mesenchymal stem cells and Denosumab have demonstrated promising results in the therapeutic management of ABC.

Read More About Lupine Publishers Journal of Neurology and Brain Disorders Please Click on Below Link: https://brain-disorders-lupine-publishers.blogspot.com/

Thursday, 24 November 2022

Happy Thanksgiving 2022!!!


Thanksgiving wishes from across the miles from our Lupine Family to yours. May your home be filled with laughter and happiness. May this day be a beautiful reminders of the wonderful things in life.


Wish you a very happy and blessed Thanksgiving!

Wednesday, 23 November 2022

Lupine Publishers| Determination of Knowledge, Attitude and Behaviors of Pesticide Dealers and Applicators in Different Cities of Turkey

 Lupine Publishers| Journal of Medical Sciences


Abstract

Introduction: Biocidal products refer to the general name of substances used in order to prevent, control or reduce the harmful effects of hazardous organisms present in all areas of public health describing human settlements, working areas, physical places and environment related to daily living [1]. The use of biocidal product around the world is, on average, 3 million tons per year; this amount is 13.000 tons in Turkey.

Objective: Objective this study is to measure the knowledge, attitude and behaviors of Pesticide sellers and Pest Control Companies during February-May 2017 in the cities of Antalya (Aksu), Denizli (Center), Isparta (Center) and Ankara (Center).

Materials and Methods:This study was conducted in the cities of Antalya, Denizli, Isparta and Ankara during the months of February-May 2017 by means of surveys prepared to measure knowledge, attitude and behaviors of pesticide sellers and home pest control companies. In the survey study, 37 questions in total were addressed to pesticide sellers while 48 questions were directed to managers and workers in home pest control companies. Statistical significance value was accepted as p< 0.05. For statistical analyses and calculations, IBM SPSS Statistics 21.0.

Results:The average age of respondents was 36.77±10.73 years for home pest dusters and 37.50±9.74 for pesticide sellers. Pesticide sellers (86.7% was university graduate) were found to have higher education level in comparison to home pest dusters (53.3% was university graduate). When the questions of surveys were evaluated, average score of home pest dusters were defined as 64.69±7.79 whereas pesticide sellers scored 64.18±9.74 on average.

Keywords: Biocidal product; Pest control; Biocide poisoning; Agriculture

Introduction

Biocidal products refer to the general name of substances used in order to prevent, control or reduce the harmful effects of hazardous organisms present in all areas of public health describing human settlements, working areas, physical places and environment related to daily living unknown [1]. Although the concepts of biocidal product and pesticide are usually substituted for each other, pesticides are used as a general term involving all kinds of chemical substances used in implementations of agricultural pest control [2]. Rapidly growing world population and unchanging world acreage point out that the yields from cultivated areas should be increased [3]. Illness and detrimental weeds lead to product losses up to 25-30% in cultivated plants. In order to minimize or prevent this loss, chemical control is the most preferred method as it is easy to implement and quickly yields solution [4]. Hazardous chemicals started to be widely used in pest control during mid 1940s [5]. 75 % of all biocidal and pesticide usage in the world occur in developed countries. However, in developing countries, both biocide and pesticide usage have been increasing [6]. Besides, 95% of poisoning and mortality related to biocide and pesticide takes place in developing countries.

Whereas the use of biocidal product around the world is, on average, 3 million tons per year; this amount is 13.000 tons in Turkey. With the aim of maximizing productivity of agricultural lands, use of pesticide in pest control has been increasing more each year due to ease of implementation and quick solution [7]. In pesticide use against pests, illnesses and weeds leading to yield loss; only 0.015%-6.0% of pesticides reach the target organism and the remaining 94.0%-99.9% reach non-target organisms and soil or meddle with other ecosystems as contaminant [8]. Inappropriate use of biocidal products can lead to acute and chronic intoxication, food and environment pollution and development of resistance against these products in target organisms [9,10]. It is quite hard to evaluate the impacts of biocidal products on human since there are many unknown factors related to the exact nature of problem. Socio demographic attributes such as age, gender, race, economic situation change the extent and results of influence considerably [11,12].

In this study, “home pest dusters” refer to the people who actually do the pest control with biocidal products used in public health areas and natural or legal persons who sell these products are stated as “pesticide sellers”. The study evaluates knowledge, attitude and behaviors of pesticide sellers and staff working in pest control companies in four selected cities as well as investigates the factors that might have an impact [13]. The amount of pesticide consumption per hectare is lower in Turkey than European Union Countries yet there is not any tracking and control system regarding the implementation of standards and procedures in preparation, application and sales of these pesticides. In addition; health education as well as education about the pre-and post-processes of pesticide application are necessary to perform balanced and conscious application and to avoid adverse effects of pesticides. The safety of workers applying pesticides is protected by some regulations with active participation of health, environment and business sector. Regulations for workers mainly include components such as the update of acts related to employee and employer, employee protection standard development, extending risk benefit analysis, guidance and training certification [14]. Although there are limited studies about attitude and behaviors of agricultural laborer in use of pesticide, there is no study done regarding pesticide dealers and home pest dusters.

Materials and Method

This study was conducted in the cities of Antalya, Denizli, Isparta and Ankara during the months of February-May 2017 by means of surveys prepared to measure knowledge, attitude and behaviors of pesticide sellers and home pest control companies. Four provinces have been selected in the agricultural sector, which have export licenses and are important in the country of agriculture. While the ratio of the total agricultural area of Ankara to Turkey is about 5%, the ratio of the fruit area of Ankara to Turkey is 8.46%; the ratio of vegetable area of Ankara to Turkey is 5.93% and the ratio of cultivated area to Turkey is 5.01% [15] (Ankara Kalkınma Ajansı, 2017). The city of Antalya constitutes 28.41% of cucumber production; 27.28% of orange production and 78.15% of avocado production in Turkey Antalya İl Gıda Tarım ve Hayvancılık Müdürlüğü [16] and takes the first place in Turkey in Isparta apple production Bashimov [17] (20.2% of total Isparta apple production) Yaman et al. [18].

The share of agricultural production in Denizli South Aegean production basin in 2010 was 30%. According to 2011 data, about 99% of Denizli’s agricultural production is wine grapes. When agricultural products exported in Denizli in 2013 are examined, 11.081 tons of fresh grapes are in the first place; and they are exported to countries such as Russia, Ukraine, Germany, Bulgaria and Azerbaijan. Denizli meets 90% of thyme production in Turkey, 15% of sunflower seeds and 80% of chickpea production in Turkey. Denizli is the world’s top producer in thyme, Turkey’s top producer in sunflower seed and opium, Turkey’s second producer in grape production and in milk production, it is the largest fourth producer of Aegean region and the largest ninth producer of Turkey ÖselmiÅŸ [19]. The main materials of study include the pesticide sellers in the cities mentioned, pest control company executive, employees and survey questions addressed to these people. Lists of Pesticide dealers were obtained from Directorates of Provincial Food Agriculture and Livestock in the cities of Ankara, Antalya, Denizli and Isparta. Based on the obtained data; 57.69 % of pesticide dealers within the study were reached and 37-question surveys were applied.

Furthermore, lists of home pest control companies were obtained from environmental health units of Ankara, Antalya, Denizli, Isparta Municipalities. 48 question surveys were applied to 10 out of 14 companies in Antalya, 3 out of 4 in Denizli, 3 out of 5 in Isparta and 14 out of 22 companies in Ankara. Selection of companies were made randomly in both survey studies. Distribution of continuous variables such as age, working years was reviewed with Shapiro-Wilk Test and graphs of normality. Kruskal- Wallis test was used in comparison of points of knowledge by cities whereas Mann-Whitney U test and t-test based on the distribution of knowledge point were used in comparison of points of knowledge by education level. In comparison of categorical variables such as education level etc. depending on poisoning, chi square test was applied. The relations between education point and age, working years were assessed by Spearman’s correlation analysis. Statistical significance value was accepted as p<0.05. For statistical analyses and calculations, IBM SPSS Statistics 21.0 (IBM Corp. Released 2012. IBM SPSS Statistics for Windows, Version 21.0. Armonk, NY: IBM Corp.)

For 35 knowledge measurement questions in the survey measuring the knowledge, attitude and behaviors of home pest dusters and 25 questions in the survey measuring the knowledge, attitude and behaviors of pesticide sellers, “knowledge score” was calculated out of 100 points. During the calculation of knowledge score, every question measuring knowledge level was evaluated in equal weight. Multiple answer questions were scored by adding the number of correct answers for related question. The main professions of home pest dusters and pesticide sellers were divided to two categories as area and non-area for statistical analyses. Professions such as Agricultural technician, agricultural engineer, environmental engineer, health personnel and chemist were regarded as in area while accountant, tradesman, business manager, teacher and other professions were accepted as non-area.

Results

In this study, survey questions were applied to 150 people in the group of pesticide sellers and to 30 people in the group of home pest dusters. In the survey study, 37 questions in total were addressed to pesticide sellers while 48 questions were directed to managers and workers in home pest control companies. Average ages of home pest dusters in study were 36.77±10.73. 53.3% of the 30 home pest dusters within the scope of research were university graduate and 46% were high school graduate. 70.8% of the home pest dusters were among area professions. Average time spent in professional life was 6.03±4.85 years. As for pesticide sellers, average age was 37.50±9.74. 86.7% of them was university graduate, 12.7% high school graduate and 0.7% of them was primary school graduate. 92.1% of pesticide sellers were within the group of area professions. Average time spent in working for pesticide sellers were 9.27±7.02 years. Average knowledge level of home pest dusters was 64.69±7.79 while that of pesticide sellers was 64.18±9.74. Knowledge level of home pest dusters was seen to be higher than that of pesticide sellers. There was no statistically meaningful difference between the knowledge levels of pesticide sellers and home pest dusters (z=0.207, p=0.836).

When the knowledge levels and professions of home pest dusters are compared, it was seen that there was no statistically meaningful difference between the knowledge level of participants with in-area (n=17) and non-area (n=9) professions (Z=1.647, p=0.107). In comparison of professions and knowledge levels in pesticide sellers, there was also no meaningful difference between the knowledge level of participants with in-area (n=137) and nonarea (n=13) professions (Z=0.164 p=0.870). In addition, there was no meaningful relation found between ages and knowledge levels of home pest dusters and pesticide sellers (p>0.05). Also, there was no meaningful relation between daily working period and knowledge levels (p>0.05). A moderate negative linear relation was detected in working years and knowledge levels of home pest dusters (p=0.026). As working period of home pest dusters decreased, their knowledge levels increased. According to this result, it can be deducted that as working years of home pest dusters increased, they could not sufficiently keep up with current issues and they supposed that the knowledge they possess is enough for them. On the other hand, when working years and knowledge levels of pesticide sellers are compared, there was no meaningful linear relation found between working period and knowledge level (p>0.05).

According to results, there was no meaningful difference between education level and knowledge level of home pest dusters (t=1.081, p=0.289). Also, when pesticide sellers’ education level and knowledge level are compared, there was no meaningful difference in score between high school and university graduates (z=0.515, p=0.607). When knowledge levels and the cities home pest dusters live are compared, there was again no meaningful difference (x2=0.343, p=0.952). On the other hand, knowledge level and the cities of pesticide sellers are compared, knowledge levels were detected to show meaningful difference based on the cities (x2=18.706, p<0.001). As a result of pair comparisons, it was determined that pesticide dealers from Denizli had higher scores than the participants from Antalya and Isparta (p<0.05) and pesticide sellers in Denizli was found to be more knowledgeable in terms of professional knowledge when compared to other cities.

It was detected in this study that average daily working hours of home pest dusters were 9.47±1.28, there was first aid kit and medicine chest in all workplaces, safety measures were being taken against fire in 90% of the workplaces, there was a separate changing room for the workers in 50% of the workplaces. 40% of companies participating the survey were detected to prepare biocidal products for application in workplace; 13.3% of companies in vehicle and the remaining percentage in application area. However, it was well known that preparation for application should be done in workplaces. Maintenance and calibration of the equipment used in pesticide application was being done regularly by all home pest dusters or through outsourcing. All home pest dusters were using back pomps for spraying and no treatment was done with living things that have died after pesticide use. Yet it is laid down by laws that these dead animals should be disposed properly.

Based on the answers of surveys, it was observed that all home pest dusters think that an ideal biocidal product should be harmless to humans and other organisms, 16.7 % of them think that biocidal product has influence over more than one species, 10% of them think it has influence over only one species, 10% that it should be easy to use and 10% believe that it should be cheap. As for pesticide sellers; it was determined that 53.3% supposed that an ideal biocidal product should be harmless to human and other organisms, 24.0% that it should be easy to use, 21.3% that it has influence over more than one species, 21.3% that it should be cheap and 20.7% that it should impact only one type of species. The main characteristic of an ideal biocidal product is that it should be affectless to human and other organisms. While all home pest dusters have knowledge of this, only 53.3 of pesticide sellers have it.

According to research results, 36.7% of home pest dusters and 79.3% of pesticide sellers believe that even small doses of biocidal products are harmful to other organisms. Among home pest dusters, 93.3% of suppose that biocidal products leave residues in the environment after being used. 100% of participants answering this question believe that residues remain in air, 3.6% believe they remain in rain and there was no one thinking that residues stay in earth, water, food, household goods and clothing. As for pesticide sellers, 75.2% think that residues stay in earth, 37.6% in food, 24.0% in water, 20.0% in air and 4.8% in rain. While pesticide sellers think that after use of biocidal products, residues remain mostly in earth, food and water; home pest dusters believe that they stay in air and rain at most. According to the results obtained, all of home pest dusters were seen that they think biocidal products are not hazardous to human health while 78% of pesticide sellers think they are. As a result, pesticide sellers think they are harmful to human health at a higher rate than home pest dusters. 96.7% of home pest dusters consider that biocidal products enter the human body via inhalation, 16.7% think they enter orally while no one thinks that they enter via skin, touch, eye contact or other ways. 67.3% of pesticide sellers state that biocidal products penetrate the human body via inhalation, 27.3% orally, 52.7% via skin contact, 13.3% via another way, 12% via eye contact. While pesticide sellers consider that biocidal products enter the human body via inhalation and skin contact at most; home pest dusters believe that they do through inhalation and mouth.

All of home pest dusters stated that they know the symptoms of biocide poisoning. Having looked at the distribution of answers; we saw that 100% is nausea and vomiting, 13.3% dizziness, 13.3% weakness, 6.7% fainting and 6.7% excessive perspiration. However apart from these signs, no one considered encopresis, seizures, lachrymation, dyspnea, stomachache, being unable to urinate are among the symptoms of poisoning. As for pesticide sellers, 98.7% stated that they know the symptoms of biocide poisoning. 86.5% marked nausea and vomiting, 48% dizziness, 28.4% excessive perspiration, 23% weakness, 18.2% fainting, 14.2% lachrymation, 14.2% dyspnea, 6.8% stomachache, 11.5% seizures and 10.8% marked encopresis among the symptoms of biocide poisoning. These results showed that although pesticide sellers stated that they are less informed about the symptoms of biocide poisoning than the home pest dusters, they could count the signs more comprehensively.

96.7% of home pest dusters stated that it is necessary to use protective material to avoid biocide poisoning while 83.3% of pesticide sellers confirmed the necessity of protective material, 30% stated that long term exposure should be avoided, 28.7% that unconscious use should be restrained, 26% that they should be kept under safety conditions, 21.3% that their mix with water and food should be avoided and 1.3% that other ways should be done to avoid biocide poisoning. When these answers were analyzed, it was detected that the pesticide sellers knew the ways of protection from biocide poisoning more comprehensively than home pest dusters. Based on the survey answers, it was seen that all of home pest dusters stated they use personal protective equipment; gloves, mask and boots. 20% of survey participants mentioned they use apron, 6.7% goggles and 3.3% safety helmet. On the other hand, only 85.3% of pesticide sellers were using personal protective equipment. 93% of those who use prefer gloves, 26% mask, 18.8% goggles and 3.1% another personal protective equipment. All in all, while pesticide sellers use gloves and mask more as personal protective equipment, home pest dusters mostly use gloves, mask and boots. Surveys showed that all of home pest dusters believe that biocidal products are not harmful to human health while 78% of pesticide sellers thinks they are. 78% of pesticide sellers mentioned that they believe biocidal products cause respiratory system disease, 47% dermatological disorders, 24.8% cancers, 12.8% gastrointestinal and 7.7% cardiovascular, 4.3% blood diseases and 0.9% other diseases. It was found out that the home pest dusters in study did not know the phone number of National Poisons Information Center (UZEM) while only 46.7% of pesticide sellers did know it.

While 76.7% of home pest dusters think that insecticides have antidote, 6.3% think they don’t. As for pesticide sellers, 70% mentioned that they believe biocidal products have antidote and 75.3% definitive treatment of biocide poisoning can be carried out. The study revealed that none of the home pest dusters got examined in regular intervals whereas 100% had no health complaint during or after the application of biocides. 19.3% of pesticide sellers got poisoned while no one among home pest dusters had biocide poisoning. 89.7% of pesticide sellers who had been poisoned consulted a medical institution. This situation can result from the fact that usage ratio of personal protective equipment among home pest dusters is 100%. All the home pest dusters see themselves at no risk of biocide poisoning while only 26% of pesticide sellers see themselves under risk. It was observed that pesticide sellers see themselves under risk of biocide poisoning at a higher rate than home pest dusters. It is considered that awareness level of pesticide sellers was higher than that of another group. All home pest dusters mentioned that they stored biocidal products in accordance with safe storage conditions while only 3.3% of pesticide sellers informed that they did not keep them safely.

According to survey results, 70% of home pest dusters were eating at work. All the workers were washing their hands before meal and after contact with biocides. On the other hand, 96% of pesticide sellers were washing their hands before meal and 86.7% were washing hands after contact with biocides. It was observed that behavior of pesticide sellers about this issue is less conscious when compared to home pest dusters. The study revealed that 93.3% of home pest dusters were following the related legal developments. 73.3 of them took part in training programs about biocidal products and 100% participated courses about preparation and application of biocides. 100% of home pest dusters were making arrangements at home before application and giving information to the hosts about the application. In Turkey, trainings for pest controllers are arranged in two categories: responsible manager trainings and operator trainings. Operator training programs are arranged by authorized relevant occupational organization, university or directorate for minimum 24 hours not to be less than 3 days and more than 10 days [20]. Pesticide sellers were found to follow up legal developments about biocidal products at a higher rate (99.3%) than home pest dusters. Again, the participation rate of pesticide sellers in education programs related to biocidal products (91.3%) was higher than that of home pest dusters.

According to the results of the research, 63.3% of home pest dusters read the contents of biocides. 70% of home pest dusters think that biocidal products are used consciously while %40 of pesticide sellers think so. 98.7% of pesticide sellers stated that they informed buyers about the biocidal products. It was determined that 76.4% of the survey participants gave information about dose, 65.5% about how to apply, 39.9% about the content, 5.4% about side effects of exposure, 4.7% about the symptoms of poisoning, 4.1% about immediate first aid in case of poisoning, 4.1 % about actions to be avoided in case of poisoning, 2.7% about other issues apart from these.

93.3% of home pest dusters pointed out that they knew the necessary immediate actions in case of biocide poisoning. 92.9% of home pest dusters believe that things to do in urgent cases include helping to enable regular breathing, according to 7.1%, it is to get one out of the scene, according to 7.1%, it is to wash the person, according to 3.6% it is to help the person vomit. Among pesticide sellers, the ratio of those who know the necessary immediate actions in case of biocide poisoning is 96%. 37.5% of pesticide sellers stated that in case of biocide poisoning, the person poisoned should be made to vomit immediately, 36.1% stated that the poisoned person should be get out of the scene, 34.7% that the clothes of the poisoned person should be removed, 36.6% that he/ she should be helped to breath regularly, 18.1% that the person should be washed, 7.6% that another action apart from these must be taken. According to 26.7% of home pest dusters, the poisoned person must not be made to drink water and according to 46.7%, movements of the person should not be hindered during seizures. As for pesticide sellers, 44.7% of them stated that to make one drink water was wrong and 33.3% that to hinder the movements during seizures and 22.7% that to make one eat yogurt is wrong.

The rate of biocide poisoning in pesticide sellers is 25.0% in Ankara (n=8), 28.6% in Antalya (n=20), 0.0% in Denizli (n=0) and 5.6% in Isparta (n=1). Distribution of poisoning varies across the cities (p=0.003). Poisoning rate in Denizli is lower than Ankara and Antalya. This meaningful low level in poisoning rate of Denizli is accordant with the high level of knowledge in the participants from Denizli. Pesticide sellers who did not have biocide poisoning had a higher rate of not using personal protective equipment (p=0.008). Among pesticide sellers who had biocide poisoning, the ratio of those who thought biocides were used consciously was higher (p>0.001). It has been determined that the persons who had biocides poisoning were not using biocidal products consciously although they thought themselves conscious user. It was detected that the ratio of those who were aware that biocidal products might enter human body via skin contact was lower among those who had biocide poisoning than those who did not get poisoned (p=0.017). The poisoned people were not aware that the biocides might enter through skin. Similarly, the ratio of those who knew that biocidal products might enter human body via eye contact was lower among those who had biocide poisoning than those who did not get poisoned (p=0.024).

Read More About Lupine Publishers Journal of Medical Sciences Please Click on Below Link:  https://lupine-publishers-medical-sciences.blogspot.com/

Tuesday, 22 November 2022

Lupine Publishers| Nasolabial Cyst: Report of 2 Cases and Literature Review

 Lupine Publishers| Journal of Otolaryngology


Abstract

Introduction: Nasolabial cysts are a rare, ectodermal development cyst, presenting as a fullness of canine fossa, nasal ala or vestibule of the nose. They are usually asymptomatic but may become infected. Treatment is complete surgical excision by sublabial approach, or transanal endoscopic marsupialization.

Case Report: Description of two cases, one female presenting as nasal deformity due to progressive growth of unilateral nasolabial cyst, and a healthy young male presenting severe facial cellulitis, with a CT showing bilateral nasolabial cysts.

Discussion: Nasolabial cyst is a rare condition, but diagnosis and treatment are simple. Nasolabial cyst should be incorporated by ENT in the differential diagnosis of nose deformities and facial swelling.

Introduction

Nasolabial cysts are also described as nasoalveolar cyst or Klestadt cyst and were first described by Zuckerkandl [1,2]. They are rare, affecting 1,6 per 100.000 persons per year, more frequently in females (4:1 ratio), especially among African Americans, in the fourth and fifth decades of life. 90% are unilateral, and often underdiagnosed [3,4]. Nasolabial cysts are non-odontogenic cysts that develop lateral to the midline of the maxillary lip and alar base. They usually present as a swelling in the nasolabial fold, causing alar nose elevation and upper lip projection. They may grow slowly and painlessly over several years. Because of its close anatomical relation to the nasal cavity and teeth, they may become infected easily, rapidly growing and being painful [1,5]. Diagnosis is made by clinical examination, imaging tests, and is confirmed by histopathologic study. The cyst can be palpated bimanually with one finger in the floor of the nasal vestibule and another in the labial sulcus. Computed tomography (CT) and magnetic resonance (MR) can be useful. Differential diagnosis includes cysts of the nasopalatine duct, periapical inflammatory lesions (granuloma cyst, abscess), and epidermoid cysts [1,6]. Complete surgical excision of the nasolabial cyst is the best treatment, and sublabial approach is most used. Other authors propose transanal marsupialization as an easier and shorter procedure, with lesser complications, but recurrence may be a problem [3,5].

Case Report 1

Figure 1(a).

lupinepublishers-openaccess-journal-otolaryngology

Y=372.256 + 6.8856. X1+residuals

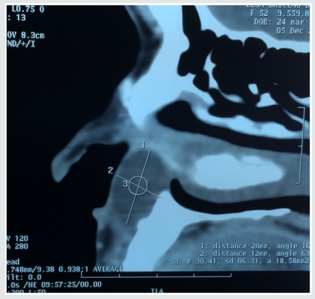
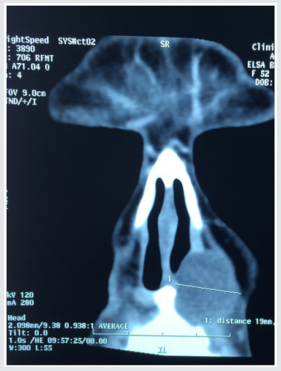
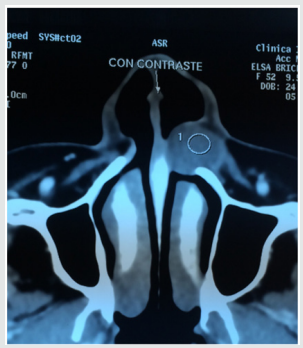
52-year-old female patient with a 3-year history of left floor of nose intermittent painful swelling, and progressive deformity of this area. Computed tomography (CT) study showed a 3,2 cm rounded lesion in left pyriform aperture compatible with nasoalveolar cyst (Figure 1). A sublabial approach was performed, and complete excision of the cyst was obtained (Figure 2). Histological study confirmed suspected diagnosis. Patient evolved in excellent conditions, with no complications or recurrence in a 2 year follow up period.

Figure 1(b).

lupinepublishers-openaccess-journal-otolaryngology

Figure 1(c).

lupinepublishers-openaccess-journal-otolaryngology

Figure 2. Intraoperative view of sublabial access to left nasolabial cyst in Case 1.


Case Report 2

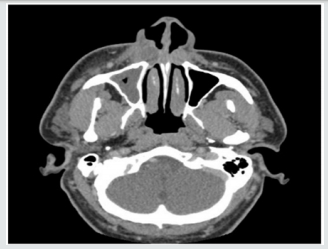
Figure 3. Computed tomography of bilateral nasoalveolar cysts. Case 2.

lupinepublishers-openaccess-journal-otolaryngology

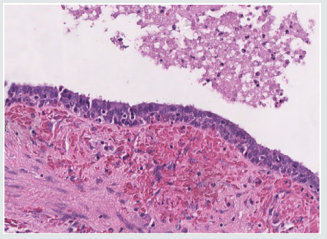
Figure 4. Pathology H-E study of Case 2 showing cyst wall with pseudostratified columnar cells.

lupinepublishers-openaccess-journal-otolaryngology

37-year-old male patient, with no prior medical record, developed a facial cellulitis with no initial response to oral antibiotics, requiring hospitalization and intravenous antibiotic treatment. Maxillary and orbital CT study showed bilateral nasoalveolar cysts, with signs of active infection in the right cyst (Figure 3). Antibiotic treatment was completed, and cyst resection was programmed a month later. An extensa sublabial approach was performed, and bilateral cysts were removed. Histological findings confirmed diagnosis (Figure 4). Patient did not have any other episode of facial cellulitis or cyst recurrence in a 14 month follow up

Discussion

Origin of nasolabial cysts is controversial. Most accepted theories are that cysts derive from remnants of the nasolacrimal duct or inclusion cysts of mesenchymal cells during the fusion of medial and lateral nasal prominences to the maxillary prominence during facial skeletal formation [2]. Histology usually present pseudostratified columnar epithelium. Su et al noticed with electronic microscopy that that cysts had a highly placated mucosa, of non-ciliated stratified columnar epithelium, differing from the ciliated columnar epithelium of the paranasal and nasal sinuses [7]. The treatment of nasolabial cysts consists on complete removal of the lesion, with the objective of prevention of infectious complications, histologic diagnosis, and aesthetic improvement. Fine needle aspiration can help in diagnosis, and relieve of symptoms, but recurrence is high [1]. Surgery is usually done by sublabial approach, creating a mucosal flap of gingiva to allow access to the pyriform aperture and to the cyst, which can be resected carefully to avoid rupture, especially to the floor of the nose mucosa, and complete excision is mandatory to avoid recurrence. After the intervention, the gingival mucosal flap is fixed in its original position with absorbable sutures. Potential complications are uncommon, including facial swelling, insensitive gingiva, teeth numbness, and surgical site infection.

Patients must use a toothbrush on the surgical site. Diet should be soft for the first week, then normal. Dental prostheses can be used immediately after surgery [1]. Lee et al published in 2009 a comparative study between surgical techniques, and strongly suggested endoscopic trans nasal marsupialization as a simpler, shorter and safer procedure, and in most cases, it could be done under local anesthesia [3]. In our two cases we used sublabial approach with general anesthesia because is the usual technique used in our practice, but we are interested to use endoscopic marsupialization in next cases. We did not have any complications or recurrences in follow up of both cases.

Conclusion

Nasolabial cysts are rare but must be considered in the differential diagnosis of floor of the nose deformities and facial swelling. Sublabial approach is the most common procedure, but probably be replaced by endoscopic marsupialization in the future.

Read More About Lupine Publishers Journal of Otolaryngology Please Click on Below Link: https://lupine-publishers-otolaryngology.blogspot.com/