Showing posts with label ANOAJ. Show all posts

Wednesday, 6 September 2023

Lupine Publishers | New Drug Delivery Strategies for Treating Fungal Infection

 Lupine Publishers | Journal of Nanomedicine


Abstract

Systemic Fungal infection of skin is also known as mycosis. Mycosis is a common fungal infection affecting human skin and causes different dermatophyte infections. Fungal infections is panic rate which presenting number of challenge to healthcare professionals. This rising rate is directly related to the growing population of immune compromised individuals thus results from changes in medical practice like use of immunosuppressive drugs and rigorous chemotherapy. Now there are modern aggressive treatment was used to control fungal infection in the body. The purpose of this review is to highlight the different novel diagnostic approaches for treatments for fungal infections.

Keywords: Fungal infection; types; characteristics; conventional; novel drug formulation

Introduction

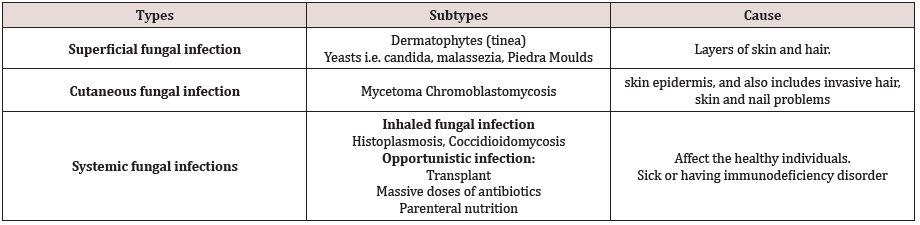
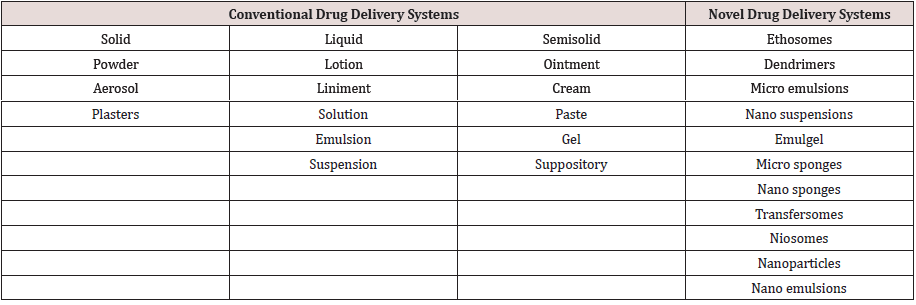
Fungal infection (fungus) is that kind of infection which is a germ or microbe that causes infections to mammals. Another words fungus referred as mycology and in plural it is called as fungi. Fungus has become rise throughout the past decade. The fraction of weak patients is rising, paralleling the surplus use of immunological disorder therapies. The circumstances incline the patients to fungal infection have hematopoietic stem cell, transplantation and therapy as well as preterm birth etc. Among the varied opportunist pathogens, fungi express a significant and necessary threat. Fungal microbes are overabundant in nature (Table 1). They are frequent colonizers on varied human tissue layer surfaces, wherever they will live by evading host defenses (Table2).

Table 1: Types of Fungal Infection.

lupinepublishers-openaccess-journal-nanomedicine

Table 2: Conventional and Novel Delivery Systems for treating fungal infections.

lupinepublishers-openaccess-journal-nanomedicine

Characteristics of fungi [1]

.

a. Parasite
b. Identify by reproduction
c. Branched Filaments

Major Antifungal Agents

.

a. Fluoropyrimidines
b. Polyenes
c. Azoles
d. Echinocandins
e. Polyenes

Conclusion

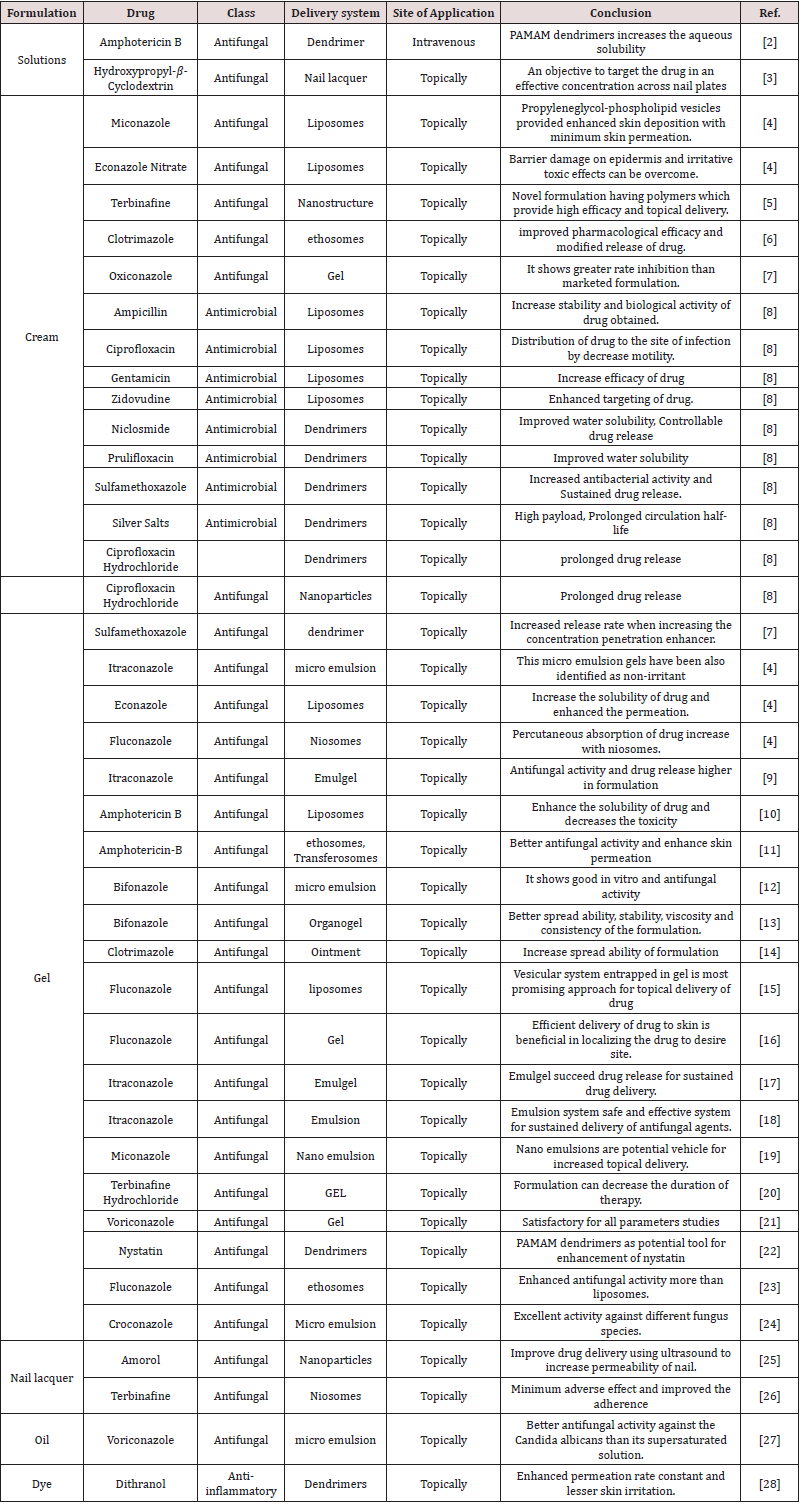
The best way to deal with the ideal management of fungal infection is firstly finding and identify the causative agents and suitable treatment could be began as soon as possible (Table 3). But these days novel treatments are used for the superficial fungal infection. Which reduced the toxicity and increase the efficacy of these drugs. They are more capable of release the drug in sustained or controlled or minimizing the adverse effect of drugs such as allergic reaction and itching [1-28]. Thus, novel drug delivery system would be considered as highly efficient and better alternative for infection.

Table 3: Novel drug formulation used of Fungal Infection.

lupinepublishers-openaccess-journal-nanomedicine

Read More About Lupine Publishers Journal of Nanomedicine Click on the Below Link:
https://lupine-publishers-nano-science.blogspot.com/


Monday, 17 July 2023

Lupine Publishers | Current Approaches in Nanomedicine

 Lupine Publishers | Archives of Nanomedicine: Open Access Journal


Introduction

Over the last years, nanotechnology has been introduced in our daily life. Nanotechnology may be able to part in a very range of applications, such as in nanomedicine, nanoelectronics, biomaterials energy production, and consumer product, etc. The application of nanotechnology for medical purposes has been termed nanomedicine and is defined as nanoscale tools (e.g., 1–1000 nm sized) for the diagnosis, prevention, and treatment of diseases. The term nanomedicine appeared in the 1990s, and since then, has the potential to significantly improve some current treatments. Commonly, nanomedicines consist of active pharmaceutical ingredients such as small molecules or biologics packaged into nano-sized carriers made of excipients like lipids and polymers. By packaging drug in the particles, drug concentration in the target is maximize by passive or active targeting and pharmacokinetic-pharmacodynamics profiles are improved. But due to their size related physicochemical properties, nanomaterials can require additional quality and safety testing compared to products with standard size.
In nanomedicine, nanomedical devices can be used for analytical, imaging, detection, diagnostic and therapeutic purposes and procedures, such as targeted cancer therapy, drug and gene delivery, improving cell-material interactions, scaffolds for tissue engineering, etc. The application areas of nanomedicine are shown in Figure 1.
With the developing technology and increasing life expectancy, new problems are faced in human life. Science is actively working to offer solutions to these problems. The advancing technology and increasing knowledge, the reliability of the products and techniques used for years, started to be questioned and the problems identified led to the development of new solutions. Over than 160 years, dentistry has been used silver amalgam for tooth filling material which contains approximately 50% Hg metal. During the past decay, science demonstrated the released Hg from the filling material covalently bound to cell proteins and shows toxic effect. So, the presence of toxic and trace elements in dental powders has led to the discover better dental filling materials and tests. In this context, Joseph published a research article about Al detection in dental powder by using handheld X-Ray Fluorescence (HHXRF) (Joseph, 2019). On the contrary of conventional XRF, HHXRF has an advantage of showing Al which is a prominent element in dental powders.

Figure 1: Schematic representation of the application areas in nanomedicine.

lupinepublishers-openaccess-journal-nanomedicine

Mycobacterium tuberculosis infection is one of the most common and deadliest infection for many years. During past decades, many efforts have been made to reduce the level of the diseases. Gupta et al. reviewed the mycobacteriophage to control tuberculosis infection (Gupta et al., 2019). Mycobacteriophages are the member of a group of bacteriophages that infects Mycobacterium and have two killing mechanisms such as lytic and lysogenic. Endolysin and lysB proteins have a major role to disrupt cell wall envelope of the bacterium. Mycobacteriophage therapy is a novel study for Tuberculosis which is a common and deadliest infection disease. Both in nuclear and thermonuclear power engineering, hydrogen could be the first reason of equipment damage. Because of that, reactor pressure vessels (RPV) was manufactured without stainless cladding as a product of RPV wall corrosion. In the RPV steel, hydrogen concentration was determined with gas chromatography. The hydrogen content in the irradiated steel were found less than 0,1 ppm. This was attributed to the increase in hydrogen content as fast neutron fluency increased (Krasikov, 2019).
“If one day, my words are against science, choose science” Mustafa Kemal Atatürk.


Read more about Lupine Publishers Archives of Nanomedicine: Open Access Journal Click on the below link: https://lupine-publishers-nano-science.blogspot.com/


Wednesday, 20 April 2022

Lupine Publishers| Solar Radiation Energy Issues on Nanoparticle Shapes in the Potentiality of Water Based Cu, Al2O3 and SWCNTs

 Lupine Publishers| Journal of Nanomedicine


Abstract

Energy is an extensive view for industrial advancement. Solar thermal energy is designed by light and heat which is radiated by the sun, in the form of electromagnetic radiation. Solar energy is the highest promptly and sufficiently applicable authority of green energy. Impact of nanoparticle shapes on the Hiemenz nano fluid (water based Cu, Al2O3 and SWCNTs) flow over a porous wedge surface in view of solar radiation energy has been analyzed. The three classical form of nanoparticle shapes are registered into report, i.e. sphere , cylinder and laminar . Nanoparticles in the water based Cu, Al2O3 and SWCNTs have been advanced as a means to boost solar collector energy through explicit absorption of the entering solar energy. The controlling partial differential equations (PDEs) are remodeled into ordinary differential equations (ODEs) by applying dependable accordance alteration and it is determined numerically by executing Runge Kutta Fehlberg method with shooting technique. It is anticipated that the lamina shape SWCNTs have dynamic heat transfer attainments in the flow improvement over a porous wedge surface as compared with the other nanoparticle shapes in different nano fluid flow regime.

Keywords: Nano Particle Shapes, Unsteady Hiemenz Flow, Water Based Cu, Al2O3 and Swcnts, Solar Energy Radiation, Nano Fluids, Solar Thermal Energy, Progressive Technology, Volumetric Receivers, Thermal Attitude

Introduction

Recently nano fluid (water based Cu, Al2O3 and SWCNTs) attracts a noticeable application due to its remarkably energetic heat transfer mechanism. Solar thermal energy is an ideal significant in our regular benefit and it’s a usual system of accessing heat, electricity and water with assist from the nature. As we will address some fossil fuels situation, the solar thermal energy is a sustainable expert of energy which never exhausts. Sustainable energy generation is one of the most important challenges facing society today. Solar thermal energy is one of the principal experts of renewable energy with basic coincidental impact, Sharma et al. [1]. The essential view of ANOAJpting particles to assemble solar energy was analyzed in the 1970s by Hunt [2]. Nanoparticles attempt the possible of developing the radiative assets of liquids, outstanding to enhance in the capability of explicit absorption solar collectors. Heat transfer in the nano fluids (water based Cu, Al2O3 and SWCNTs) due to solar radiation energy is of considerable practical influence to engineers and scientists as a result of its relatively global event in countless units of science and engineering, Choi [3], Buongiorno and Hu [4], Buongiorno [5] and Cheng and Minkowycz [6]. Once again, science and progressive technology is much obliged to solar radiation due to its extensive utilization in the design of solar thermal electricity, solar photovoltaic cells, solar heating, artificial photosynthesis, etc.

Nanoparticle shapes (sphere, cylinder and lamina) in the nano fluids (water based Cu, Al2O3 and SWCNTs) absorb solar radiation notably because of small size as correlated to the wavelength of de Broglie wave. Therefore nanoparticles also attempt the assuring aspect of strengthening the radiative resources of liquids, dominating to accelerate in the performance of straight absorption of solar collectors, [7,8]. Recently, the effects of solar radiation on nano fluid with variable stream conditions were addressed by Das et al. [9] and Anbuchezhian et al. [10].

Many investigators [11-16] have analyzed the utilization of these new transport of heat transfer in solar collectors. Yousefi et al. [11] experimentally presented that the Al2O3/water nanofluid increases the ability of flat-plate collectors by 28.3%. Yousefi et al. [12] studied the effects of pH values of carbon nanotubes nanofluids on the expertise of a flat-plate solar collector. Kameya and Hanamura [13] addressed that the radiation absorption resources of base fluid were increased harmfully by including Ni nanoparticles. Lenert and Wang [14] analyzed the efficiency of nanofluids as volumetric receivers in concentrated solar utilizations applying the suspension of carbon-coated cobalt nanoparticles into Therminol VP-1 fluid. He et al. [15] practically addressed the applicable photo-thermal assets of Cu/H2O nanofluids for enrollment in blunt absorption, solar thermal energy systems.

Furthermore, the up-to-date revision papers [17,18] recorded that nanofluids have strong accessible for utilizations in solar organizations such as solar collectors [19], photovoltaic thermal schemes [20], and thermal energy storage structures [21]. Most of the analysis on the employment of nanofluids in solar collectors has been defined to energy and energy investigations. There are some analyzes on the investigation of the hydrodynamic and convective heat transfer assets of nanofluids in solar structures [16]. As displayed in many review articles [22-24], a massive amount of practical work has been addressed on the thermal attitude of various types of nanofluids flowing through different heat exchanger models; among them, the circular successive tubes have admitted more application in this study since they are the main elemental of various types of solar collectors.

Recently, the capability of applying both nanofluid and porous media has admitted comfortable absorption and has attended to broad analysis in this field. Porous media enhance the association surface area among liquid and solid surface, and, on the other hand, nanoparticles circulated in nanofluid upgrade the impressive thermal conductivity. Therefore, it suggests that utilizing both porous media and nanofluid can enhance the ability of typical thermal systems harmfully. Convective flow in porous media has been universally analyzed in the recent years due to its extensive operations in engineering as post-accidental heat dismissal in solar heater or collectors, drying generating processes, heat exchangers system, geothermal and oil recovery scheme, building construction region, etc. Heat and mass transfer for Hiemenz flow through porous media in the presence of an incident external magnetic field have been studied by several authors [25-30].

The method of Lie group transformations is used to derive all group-invariant similarity solutions of the unsteady twodimensional laminar boundary layer equations, Yurusoy and Pakdemirli [18], Yurusoy and Pakdemirli [19] and Avramenko et al. [31]. Impact of thermal stratification is an important aspect in heat transfer analyses. Thermal stratification of nanofluids occurs due to temperature variations or the presence of different fluids of different densities.

In this article, we addressed the role of nanoparticle shapes (sphere, cylinder and lamina) in the presence of unsteady nanofluids (water based Cu, Al2O3 and SWCNTs) flow and heat transfer past a porous wedge sheet due to solar radiation. Lie symmetry group transformation is applied to transform the controlling PDEs into ODEs and then the numerical solution of the problem is cultivated by using fourth or fifth order Runge Kutta Fehlberg method with shooting technique. Experimental works have analyzed that the nanoparticle shape has a unique impact on the heat and mass transfer of nanofluids [32,33]. Nanoparticle shapes i.e. sphere, cylinder and laminar, are authorized into address in this work. The parameter affirmation for the problem was accomplished and is authorized. It is consumed that the results will gift towards better understanding of nanofluid conflict in channel. Several aspects of the problem are analyzed and predicted graphically with account to the physical parameters elaborated within it and the instant improvements are associated with the applicable literature.

Mathematical Analysis

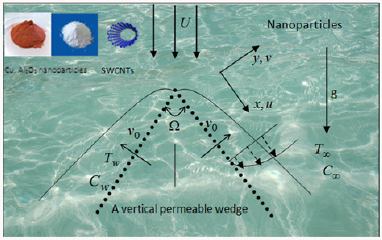
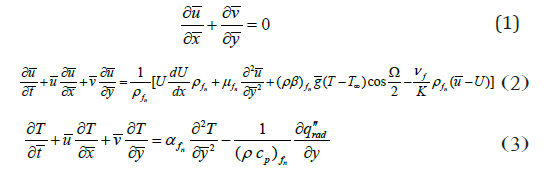
Consider the unsteady laminar two-dimensional flow of an incompressible viscous nanofluids (water based Cu, Al2O3 and SWCNTs) past a porous wedge sheet in the presence of solar energy radiation (Figure 1). The porous medium is assumed to be transparent and in thermal equilibrium with the fluid and neglecting the pressure gradient in the y direction. Due to heating of the entrancing nanofluid and the wedge surface by solar thermal radiation, heat is transmitted from the plate. Also, the solar radiation is a collimated beam that is normal to the plate. The working water based Cu, Al2O3 and SWCNTs nanofluid flow is assigned to be Newtonian. The system of regulating equations are designated are

Figure 1: Flow configuration and coordinate system.

Lupinepublishers-openaccessjournals-Nanotechnology-nanomedicine

Employing Rosseland approximation for thermal radiation Sparrow and Cess [34], Rapits [35] and Brewster [36], qradn=-4σ1/3k* ∂T4/∂y, σ1- the Stefan-Boltzman constant, k* - the mean absorption coefficient. The Rosseland relation is recycled to define the thermal radiative heat transfer in the restraint of the optically thick fluid (nanofluid).

With boundary conditions

Lupinepublishers-openaccessjournals-Nanotechnology-nanomedicine

(Power index) are constants and V0 and Tw are (the suction ( V0 > 0 ) or injection ( V0 < 0 )) velocity and the fluid temperature at the plate. The feasible flow velocity of the wedge is U(x,t)=v xmm+11=2m/1+m Sattar [37] whereas δ is the time-dependent length scale, δ =δ (t) and the Hartree pressure gradient parameter, β1=Ω/π,Ω - angle of the wedge, the temperature of the fluid is simulated to differ succeeding a power-law function while the free stream temperature is linearly stratified. In equation (4) and n is a constant parameter assigned as the thermal stratification parameter, 0 ≤ n <1. T0 =T (0) is a constant reference temperature. The suffixes w and ∞ denote surface and ambient conditions. Let u and v are the velocity components along the x and y directions, T - the local temperature of the nanofluid, g - the acceleration due to gravity, K - the permeability of the porous medium, ρ fn- the effective density of the nanofluid, rad q′′ - the applied absorption radiation heat transfer, μ fn - the effective dynamic viscosity of the nanofluid, α fn - the thermal diffusivity of the nanofluid, Aminossadati and Ghasemi [38] which are defined aρs =(1 −ζ)ρf+ζρs, μfnf/(1 − ζ )2.5,Lupinepublishers-openaccessjournals-Nanotechnology-nanomedicine,

Lupinepublishers-openaccessjournals-Nanotechnology-nanomedicine

Maxwell model [39] was refined to define the effective electrical or thermal conductivity of liquid-solid suspensions. Let kf and ks - the thermal conductivity of the base fluid and nanoparticle, ζ - the nanoparticle volume fraction, μf - the dynamic viscosity of the base fluid, βf and βs - the thermal expansion coefficients of the base fluid and nanoparticle, f ρ and ρs - the density of the base fluid and nanoparticle, kfn - the effective thermal conductivity of the nanofluid and (ρ cp)fn- the heat capacitance of the nanofluid.

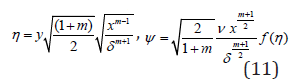
Proposing the succeeding non-dimensional variables

Lupinepublishers-openaccessjournals-Nanotechnology-nanomedicine

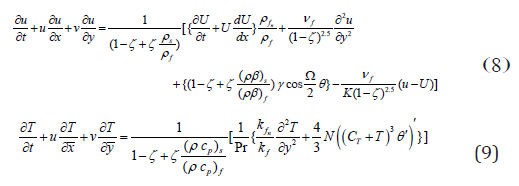
Based on the above results, the equations (1) - (4) become

∂u/∂x+∂v/∂y=0 (7)

Lupinepublishers-openaccessjournals-Nanotechnology-nanomedicine

With boundary conditions

Lupinepublishers-openaccessjournals-Nanotechnology-nanomedicine

Pr= νff- the Prandtl number,λ=δm+1/ K k2- the porous media parameter, Lupinepublishers-openaccessjournals-Nanotechnology-nanomedicine- the buoyancy or natural convection parameter,Lupinepublishers-openaccessjournals-Nanotechnology-nanomedicine- the conductive radiation parameter, where θw=1/Tw-T≅0.1.Let γ > 0 aids the flow and γ < 0 opposes the flow, while γ = 0 i.e.( ) w T T∞ − , represents the case of forced convection flow. Hence, combined convective flow exists when γ = O(1). Based on Kafoussias and Nanousis [20]

Lupinepublishers-openaccessjournals-Nanotechnology-nanomedicine

and θ=T-T/Tw-T,u=∂ψ/∂y and v=-∂ψ/∂x

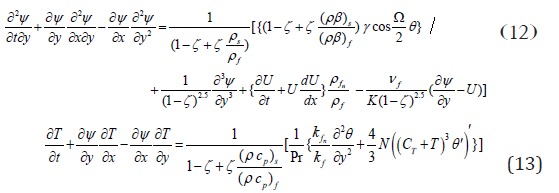
The system of equations (7) - (9) become

Lupinepublishers-openaccessjournals-Nanotechnology-nanomedicine

With the boundary conditions

∂ψ/∂y=0,∂ψ/∂x=-V0,T=Tw at y=0,

Lupinepublishers-openaccessjournals-Nanotechnology-nanomedicine

where CT=T/Tw-T - the temperature ratio, 0.1 T C = and heat radiation 0 ≤ N ≤1.0 , Murthy et al. [40].

The symmetry groups of Equs. (12) and (13) are estimated applying the classical Lie group approach as

Lupinepublishers-openaccessjournals-Nanotechnology-nanomedicine

It is noted that the form of infinitesimals as

Lupinepublishers-openaccessjournals-Nanotechnology-nanomedicine

g(x) - An arbitrary function.

Definitions of infinitesimal alternators are

Lupinepublishers-openaccessjournals-Nanotechnology-nanomedicine

The PDEs controlling the work under attention are converted by a exclusive mode of Lie symmetry group conversions viz. oneparameter infinitesimal Lie group of transformation into a system of ODEs. For the current situation, we considered that the generator 1 X with g(x) = 0 . The distinctive equations are

dx/x=dy/0=dψ/ψ=dθ/θ (18)

Based on the above equations, it is calculated as

η = y,ψ = x f(η ) and θ = xθ (η ) Where η =η (x,t) (19)

Established on these relations, the Equs. (12) and (13) become

Lupinepublishers-openaccessjournals-Nanotechnology-nanomedicine

S - The suction parameter if S > 0 and injection if S < 0 and

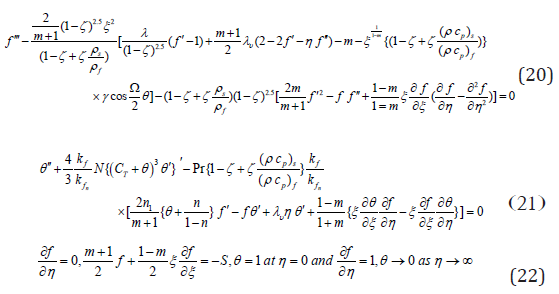
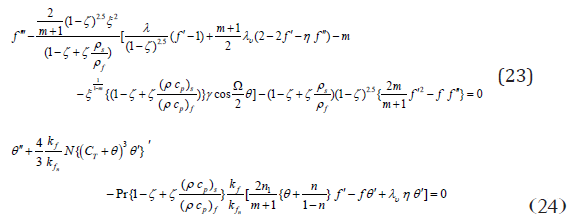
ξ =k x1-m/2 the dimensionless distance along the wedge (ξ > 0 ) [41].In this scheme of equations, it is predicted that the non similarity forms of the problem are exhibited in the terms involving partial derivatives with respect to ξ . Generation of the local nonsimilarity schemes with reference to the current work will now be reviewed. At the first level of truncation, the terms followed by ξ ∂/∂ξ are small. This is notably true when (ξ <<1). Therefore the terms with ξ ∂/∂ξ on the right-hand sides of Equations (20) and (21) are eliminated to obtain the succeeding scheme of equations:

Lupinepublishers-openaccessjournals-Nanotechnology-nanomedicine

With boundary conditions

Lupinepublishers-openaccessjournals-Nanotechnology-nanomedicine

Suppose that λυ= c/xm1, = , c is a constant so that c=δm/v ∂δ/∂t and integrating, it is predicted that δ = [c(m+1)ν t]1/ m+1 . In spite of c = 2 and m =1 in δ and we obtain δ = 2 ν t which observes that the parameter δ can be correlated with the well settled scaling parameter for the unsteady boundary layer problems [42].

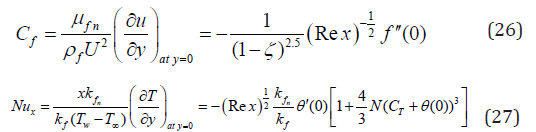
For experimental principles, the functions f (η ) and θ (η ) grant us to define the skin friction coefficient and the Nusselt number as

Lupinepublishers-openaccessjournals-Nanotechnology-nanomedicine

Here, Rex=U x/v f = is the local Reynolds number.

Results and Discussion

Estimation are carried out by the fourth or fifth order Range Kutta Fehlberg method with shooting technique for different values of parameters. Equations (23) and (24) developed to the boundary conditions (25) have been resolved numerically employing computer software Maple 18. If γ >>1.0 conforms to pure free convection, γ =1.0 correlates to mixed convection and γ <<1.0 corresponds to pure forced convection. Impacts of nanoparticle shapes and solar thermal radiation energy on unsteady Hiemenz water based Cu, Al2O3 and SWCNTs nanofluid flow over a porous wedge sheet are investigated for different values of parameters. In order to justify our method, we have correlated the solutions of f (η ), f ′(η ) and f ′′(η ) for different values of η (Tables 1 & 2) with White [40] whereas f ′′(0) and θ ′(0) for distinct values of ξ (Table 3) with Vajravelu et al. [43] and observed them in desirable acknowledging.

Read More about Lupine Publishers Journal of Nanomedicine Please Click on Below Link: https://lupine-publishers-nano-science.blogspot.com/


Tuesday, 19 April 2022

Lupine Publishers| Determination of Caffeine in Soft and Energy DrinksAvailable in Market by UV

 Lupine Publishers| Journal of Nanomedicine


Abstract

This investigation was carried out to determine the pH, levels of caffeine contents in five soft drinks and four energy drinks available in local market of Pakistan. pH were measured by pH meter. Quantitative estimation of caffeine was performed by a simple and fast standard UV spectrophotometric method (Perkin Elmer lambda 35 UV/Vis spectrometer) using carbon tetrachloride as the extracting solvent at 270nm wave length. The minimum caffeine level of soft drinks was observed in Brand-3 (10.69 mg/serving), while Brand-5 showed the highest caffeine content (42.17mg/serving) showing a range from 10.6 to 42.17mg/serving. The levels of caffeine in all energy drink samples are well below the maximum allowable limits set by the food regulatory bodies, except E2. The E2 has greater calculated concentration then the labeled concentration .The minimum caffeine level of energy drinks was observed in E4 (32.04mg/L) while E2 showed highest caffeine level in energy drinks (101.705mg/serving) showing range from 32.04mg/ serving to 101.705mg /serving . And the pH ranges of these soft drinks were (2.29 to 3.02) and in energy drinks (2.85 to 3.28) .Further investigations are needed to determine the suitability of these soft and energy drinks.

Keywords: Caffeine, Cocoa Beans, UV Spectrophotometer, Comparison of Soft And Energy Drinks, White Crystalline Xanthine Alkaloid, Anthropologists, Warding off Drowsiness, Restoring Alertness , Psychoactive Substance, Decaffeinated Coffee

Introduction

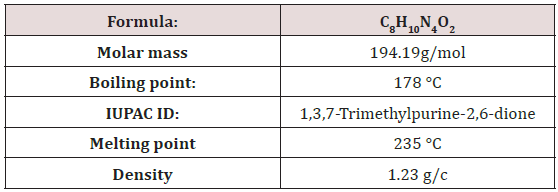
Caffeine is a common ingredient of energy drinks. It is deliberately added as a flavoring agent and to make the drinks addictive [1]. Caffeine is a bitter, white crystalline xanthine alkaloid that acts as a psychoactive stimulant drug and a mild diuretic. Around sixty plant species are known to contain caffeine [2]. Common sources are the “bean” (seed) of the coffee plant; in the leaves of the tea bush; and in kola nuts. Other sources include yaupon holly leaves, South American holly yerba mate leaves and seeds from Amazonian maple guarana berries [3]. Columbia In 1819, the German chemist Friedrich Ferdinand Runge isolated pure caffeine for the first time [4]. Caffeine is one of the world’s most widely used drugs. Many anthropologists believe its use may date back to the Stone Age. Caffeine was first extracted from coffee in 1821 [5]. Caffeine is a naturally occurring substance found in the leaves, seeds or fruits of over 63 plants species worldwide and is part of a group of compounds known as methyl xanthines. The most commonly known sources of caffeine are coffee, cocoa beans, cola nuts and tea leave [6]. Caffeine is a naturally occurring substance found in humans, caffeine is a central nervous system (CNS) stimulant [7]. It has theeffect of temporarily warding off drowsiness and restoring alertness. Beverages containing caffeine, such as coffee, tea, soft drinks and energy drinks, enjoy great popularity [8]. Caffeine is the world’s most widely consumed psychoactive substance. Adults receive nearly three quarters of their daily caffeine from coffee. Children receive one half of their caffeine from soft drinks.

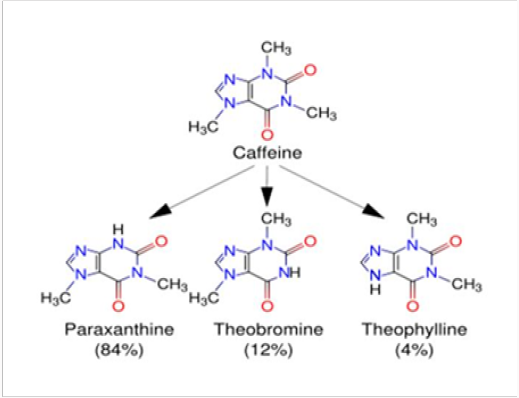
Energy drinks represent a fast-growing beverage market (Table 1). Energy drinks vary in the amount of caffeine can range from around 50-300mg. Most people experience no behavioral effects with less than 300 mg caffeine. Sleep is more sensitive and can be disrupted by 200mg caffeine [9]. The caffeine content in your average cup of coffee is around 100mg. Decaffeinated coffee isn’t actually caffeine-free, and can contain up to 12mg of caffeine. Your average cup of tea contains 85mg of caffeine. A single can of commercially available energy drink can have anywhere between 80 and 280mg of caffeine depending on the can size. Green tea is close behind with 60mg of caffeine, followed by white tea with 55mg. Slim-fast chocolate drinks come in at 20mg of caffeine in a single serving [10]. Caffeine is metabolized in the liver into three primary metabolites: paraxanthine (84%), theobromine (12%), and theophylline (4%) [11] Caffeine is metabolized in the liver by the cytochrome P450 oxidase enzyme system (specifically, the 1A2 isozyme) into three metabolic dimethyl xanthines which each have their own effects on the body [12] (Figure1). Paraxanthine (84%) Increase free fatty acid levels in the blood plasma. Theobromine (12%) increases urine volume. Theophylline (4%) Relaxes smooth muscles of the bronchi, and is used to treat asthma [13]. An acute overdose of caffeine, usually in excess of 250 milligrams (more than 2-3 cups of brewed coffee), can result in a state of central nervous system overstimulation called caffeine intoxication [14]. The effects of caffeine on the body may begin as early as 15 minutes after injecting and last up to hours [15]. Caffeine is highly addictive, caffeine increase stress level, caffeine accelerates aging and wrinkles [16]. Caffeine intake of 150-300mg after a 10h fast increased urinary calcium excretion 2-3h after exposure in adolescent men and women [17]. Dehydration is a major drawback of caffeine consumption, and results from the drugs ability to increase urine production. In addition to dehydration, caffeine causes some people to get jittery stomachs or “coffee stomach” - which can be quite uncomfortable and mask any potential benefits [18]. 100-200mg dose of caffeine result in increased alertness and wakefulness, faster and clearer flow of thought, increased focus, and better general body coordination [19]. Caffeine makes people more alert, less drowsy, and improves coordination. Combined with certain pain relievers or medicines for treating migraine headache [20]. In a large 217,883 person study, those that consumed caffeine from any source had less kidney stone formation than those that did not consume caffeine [21].

Figure 1: Caffeine structure and its metabolism.
Lupinepublishers-openaccessjournals-Nanotechnology-nanomedicine

Table 1:

Lupinepublishers-openaccess-Nanomedicine

Aims

I selected this topic determination of caffeine in drinks available in market because now a days energy and soft drinks play vital role in our daily life and become necessity of our life that’s why I want to know all benefits and disadvantages of these drinks .so I determined the amount of caffeine in 9 brands of soft and energy drinks by using UV/VIS Spectrophotometer to obtained practical knowledge in the use of basic UV/VIS Spectrophotometer equipment. The main purpose of this research is to raise the awareness of negative effects of caffeine on human health because many companies sales their products by highlighting few advantages of caffeine so companies should be labeled the caffeine content in drinks and also its effects as well as benefits.

Literature

Guzin Alpdogan concluded the caffeine concentration range in coca cola is 149.32±0.68 mg/ml by using derivative spectrophotometric method and use Philips 8740UV/VIS Spectrophotometer at 232.7-245.2nm and the caffeine concentration range of coffee is 1.36 ±0.03 percent at 268.5-289.5nm and in the tea range of caffeine concentration is the 1.53 ± 0.03percent at 286.0-300.0nm. Ahmad H. Alghamdi determined the content levels of some food additives (Aspartame, Caffeine, Sodium benzoate) in 29 different beverage samples commercially available in Riyadh local markets by using UV spectrophotometric method ( Perkin-Elmer, USA).The caffeine contents in energy drink samples ranged from 22.64ppm to 34.96ppm. H.N Wanyika discussed the levels of caffeine in certain coffee (nescafe, africafe, dormans) and tea (chai maramoja, kericho gold, sasini, finlays premium) brands found in the Kenyan market were determined using High performance liquid chromatography (HPLC) and UV/ Vis spectrophotometer (Shimadzu) at 274nm which gave a concentration of 471 .73 ± 1 96.92 ppm. KapilKalra studied the concentration of Caffeine of seven brands of soft drinks with the use of an analytical method, U.V Spectrophotometer Shimanzu 1800 Compact. Which will tell us the best brand amongst different brands containing caffeine at 271.2nm , highest concentration of caffeine was found in Power-ex (46 μg/ml) and the lowest concentration of caffeine in XXX (19.5μg/ml). Sarmad G. Mohammed has done research on ten brands of beverages (soft and energy drinks) consumed in Basrah governorate/Iraq, and he were determinate its pH, trace minerals and caffeine contents by using UV/VIS spectrophotometer (shimadzu AA 630-12) at 254nm wavelength. The caffeine concentration in beverages are these Kal aschnikow 103.13±1.14, 2 Boom Boom 102.56±1.11, Power horse 94.53±0.10 ,O290.89±1.02, Pit bull 79.99±1.00 , Pepsi 80.00±1.34 ., Wild tiger 79.94±0.22 , Mountain dew 44.08±0.34.

Magut Hillary studied the different brands of soft drinks and juices were randomly sampled from different stores in Eldoret town, the caffeine levels were found to be in the range of 1.43mg/L and 40.51mg/L. Muhammad Mufakkar has done research on the eight brands of soft drinks and determine the caffeine concentration by using Ultraviolet spectroscopy at 272nm [22]. The highest concentration of caffeine was found in Sting 500mL (560.29μg/ mL). The lowest concentration of caffeine was found in 7up 500mL (29.71μg/mL). Mozammel Hossain investigated to carry out to determine the pH, levels of caffeine and reducing sugar contents in five energy drinks available in local market in Rajshahi, Bangladesh by using U.V/VIS Spectrophotometer the pH of the beverages was perfectly acidic ranging from 2.85 to 3.11. The minimum caffeine level was observed in Brand-4 (40.34mg/serving), while Brand-5 showed the highest caffeine content (244.57 mg/serving) showing a range from 40.34 to 244.57mg/serving.

Material and Methods

Instrument

UV/VIS spectrometer Perkin Elmer lambda 35. The double beam spectrophotometer having the range 190-1100 nm and bandwidth: 0.4-4nm (variable).

pH Determination

Beverages PH were determined by using Sartorius pH meter.

Preparation of Stock Solution

i. All glassware was washed with distilled water.

ii. Then glassware was dried in oven at 105 degree Celsius.

iii. A 100ppm stock standard of caffeine was prepared by dissolving 20 Mg caffeine in 250ml

carbon tetra chloride in 200ml volumetric flask.

Preparation of Standard Solution

Working standards were prepared by pipetting 0.1, 0.2, 0.3, 0.4, 0.5ml respectively aliquots of stock standard solution into separate volumetric flasks of 100ml and dilute it with carbon tetrachloride and forms 10, 20, 30, 40, 50mg/L standards solution. The absorbance of each solution was measured at absorption maximum of 270nm using 10mm quartz cuvette.

Caffeine Extraction Procedure

i. The brands of soft and energy drinks were taken by different shops.

ii. Then the sodium carbonate solution is prepared by dissolving 20g sodium carbonate into distilled water in 25ml volumetric flask.

iii. Then separating funnel was taken and adjust it in the stands with beakers.

iv. Then 5ml of drink sample was drawn in the separating funnel by addition of distilled water and add 1ml of sodium carbonate solution in the separating funnel and add 20ml of carbon tetrachloride in it.

v. The caffeine was extracted by inverting funnel at least three times venting the funnel after each inversion.

vi. The non aqueous carbon tetra chloride layer was removed to a clean 50ml volumetric flask.

vii. Another 20ml portion of carbon tetra chloride was added to aqueous solution in separating funnel and extraction procedure was repeated twice and carbon tetra chloride layers combined.

This procedure was repeated for all drink samples the absorbance of resulting solutions was measured on UV/Vis Spectrophotometer at 270nm using 10mm quartz cuvette.

Results and Discussion

The regression line is Y=0.036x-0.0112. Dilution factor= flask volume / sample volume =50/5=10.

Caffeine Concentration and pH

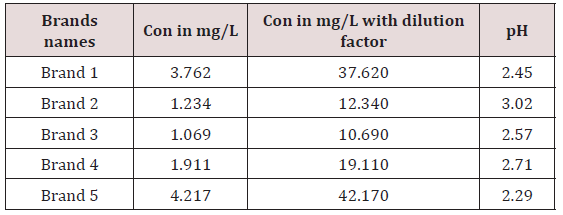
The main objective of this research is to know the caffeine level in soft and energy drinks high or low then the published value or the FDA recommended value. The Brand 2 has the highest pH 3.02 values among all soft drinks so it means it is less acidic among all soft drinks .And Brand 5 has lowest pH 2.29 among all soft drinks it means it is more acidic among all soft drinks .The soft drinks having pH range 2.29 to 3.02. The ideal (neutral) pH of the mouth ranges from 6.5-7.5.A pH of 5.5 is considered to be the threshold level for the development of dental decay. Both soft drinks and sports drinks have been shown to have a pH between 2.5 and 3.5. Demineralization of tooth enamel will occur more rapidly if the pH drops below the critical 5.5 level for long periods of time and if the pH is dropped below the critical level frequently. All kinds of soft drinks are acidic and that cola drinks especially make our bodies poor in oxygen.

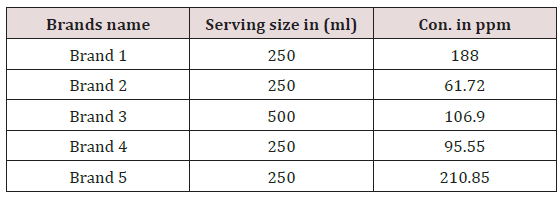
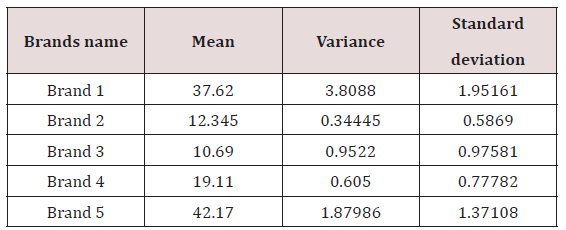
The caffeine concentration range in soft drinks is 10.69- 42.17ppm. And the concentration of Brand 1 is 37.62 at 270nm .Similarly caffeine concentration in Brand 2 was found to be 12.345ppm,caffeine concentration in Brand 3was found to be 10.69ppm,caffeine concentration in Brand 4 was found to be 19.11ppm and caffeine concentration was found to be 42.17ppm. The highest caffeine concentration was found to be in Brand 5 which is 42.17ppm and it has lowest pH value so it means Brand 5 is most acidic among all soft drinks .so it is strongest central nervous system stimulant .so it can be discontinued in market. The lowest caffeine concentration was found to be in Brand 3 which is 10.69ppm and pH values are high so it means these brands are less acidic so it can be sold in market and a weak central nervous system stimulant .The US food and Drug Administration (FDA,2006) limits maximum amount of caffeine in soft drinks is 200pm in 6mg/oz .therefore caffeine content allowed in soft drinks may be in range between 30-72mg in 355ml (Table 2).

Table 2:
Lupinepublishers-openaccess-Nanomedicine

Statistical Analysis of Soft Drinks

The variance and standard deviation of Brand 1 was 3.8088 and 1.95161 respectively .The variance and standard deviation of Brand 2 was 0.34445 and 0.5869 respectively. The variance and standard deviation of Brand 3 was 0.9522 and 0.5869 respectively. The variance and standard deviation of Brand 4 was 0.605 and 0.77782 respectively. The variance and standard deviation of Brand 5 was 1.87986 and 1.37108 respectively.

Mean = Sum of X values / N(Number of values)

Standard deviation = S=√ [ (X-M) ] ^2/n-1

Variance = s2.

Caffeine Concentration and pH

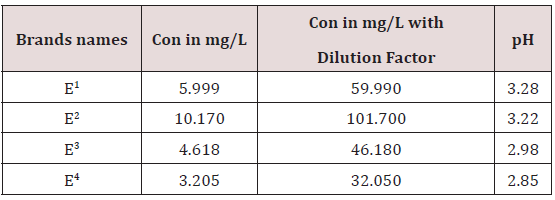
The pH range in energy drinks is 2.85 _3.28 .The Brand 9 having pH 2.85 it means it is highest acidic among all energy drinks and E1 have highest pH which is 3.28 so it means it less acidic among all energy drinks. The low pH values could be as a result of presence of carbon dioxide, phosphoric acids, malic acid, tartaric acid used as preservatives by manufactures of these beverages. The acids inhibit growth of microorganism, bacteria, fungal may contaminate beverages. E4>E3>E2> E1.The caffeine concentration range in energy drinks are 32.05-101.905ppm and the concentration of E1 59.95ppm .Similarly caffeine concentration in E2 was found to be 101.705ppm,caffeine concentration in E3 was found to be 46.185ppm,caffeine concentration in E4 was found to be 32.05ppm . The highest caffeine concentration was found to be in E2which is 101.705ppm and it has lowest pH value so it means E2 is most acidic among all energy drinks .so it is strongest central nervous system stimulant .so it can be discontinued in market. The lowest caffeine concentration was found to be in E4which is 32.05ppm and pH values are high so it means these brands are less acidic so it can be sold in market and a weak central nervous system stimulant (Table 3).

Table 3:
Lupinepublishers-openaccess-Nanomedicine

Statistical Analysis of Energy Drinks

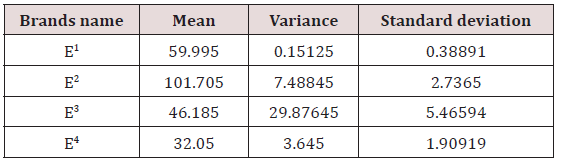
The variance and standard deviation of E1 was0.15125 and0.38891 respectively. The variance and standard deviation of E2 was 7.48845 and2.7365 respectively. The variance and standard deviation of E3 was 29.87645 and 5.46594respectively. The variance and standard deviation of E4 was3.645 and1.90919 respectively (Table 4).

Table 4:
Lupinepublishers-openaccess-Nanomedicine

Comparison of Labeled and Calculated Concentrations

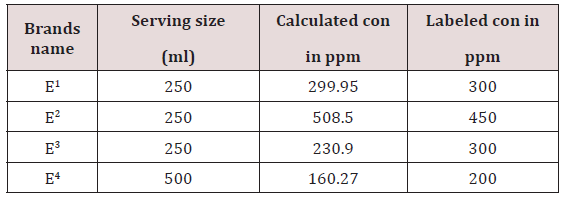
The E1 had been labeled concentration was 300mg per 250ml and calculated 299.95mg per 250ml .The E2 is the first brand which have ginseng that cause low tension , relieve stress, Stimulate metabolism. It is manufacture by king beverages and its calculated caffeine content is 508.5mg per 250ml and labeled concentration was 450ppm per 250ml. The E3 had labeled concentration was 300mg per 250ml and calculated 230.9mg per 250ml so it is less than its labeled caffeine content amount .The E4 had labeled concentration was 200mg per 500ml and calculated amount of caffeine 160.27mg per 500ml it is less than its labeled caffeine content amount (Table 5-7).

Table 5:
Lupinepublishers-openaccess-Nanomedicine

Table 6:

Lupinepublishers-openaccess-Nanomedicine

Table 7:

Lupinepublishers-openaccess-Nanomedicine

Concentration in ppm 250ml =concentration in ppm per 5ml *50.

Concentration in ppm per 500ml= concentration in ppm per 5ml *100.

Conclusion

Determination of caffeine content in non alcoholic beverages and energy drinks is very important analytical process safeguard the well being of people who are unaware to adverse effects of caffeine. In soft drinks the Brand 5 have highest concentration of caffeine that is 42.17ppm and Brand 3 having low concentration of caffeine 10.69ppm and in energy drinks Brand 2 having high concentration of caffeine that is 101.705ppm (Figure 2). Brand 9 having low concentration of caffeine that is 32.05ppm among all energy the process of determination of caffeine in drinks can done by many analytical method but in this research UV/VIS Spectrophotometer was used because it is relatively easy, fast, cheap ,highly sensitive and give accurate concentration of caffeine.

Read More about Lupine Publishers Journal of Nanomedicine Please Click on Below Link: https://lupine-publishers-nano-science.blogspot.com/

Monday, 17 January 2022

Lupine Publishers| Degradation of Malachite Green by Green Synthesized Copper Nanoparticles by Using Aloe Barbadensis Leaf Extracts

 Lupine Publishers| Journal of Nanomedicine


Abstract

The present study was aimed to account a green synthesis of copper nanoparticle is by interaction of leaf extract and copper salt. The bio-synthesis of nanoparticles put forward a cost free and eco-friendly method of nanoparticle synthesis. Copper nanoparticles were synthesized by using aqueous solution of copper sulphate and extract of Aloe barbadensis. The prepared leaf extract was observed when 1mM copper sulphate solution is added in it. Color change of the reaction mixture was observed from deep blue to colorless and then to brick red and dark red indicating the formation of copper nanoparticles. The synthesized CuO NPs was characterized by using different technique such as UV, IR, XRD, and SEM. ward a cost-free and environmentally suitable method of nanoparticle synthesis. Synthesized CuO nanoparticles with average particle size of 60n. Shape of copper nanoparticles was spherical and cubic and their range was 80-120nm Different functional group in synthesized nanoparticles are examined by FTIR. UV spectrophotometer confirm peak of copper nanoparticle experiments Copper oxide nanoparticles shows maximum absorbance at 272nm. Catalytic activity of synthesized nano particles is also examined on the degradation of malachite green. This catalytic effect of copper oxide nanoparticles can be contributed to its small size.

Keywords: Aloe Barbadensis, SEM, Copper Oxide Nanoparticles, Green Synthesis, XRD, Green Synthesis, Highly Stabilized Nanoparticles , Ecofriendly, Phenolic Content, Degradation of Malachite Green

Introduction

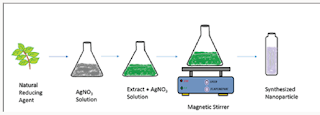
Nanotechnology deals with manipulation of matter at low size normally lesser then that of the 100nm. Metallic nanoparticles can be prepared by chemical and physical method. These methods have certain flaws like toxic chemicals and also dangerous to environment [1]. Developing research in green chemistry employed prominent part in nanotechnology to attain benefit to society surface area and mass ratios increase adsorption property [2]. Green synthesis has been concerned in synthesis of highly stabilized nanoparticles. Synthesis of nanoparticles taking assistance of ecofriendly methods has achieved huge attention in the modern era. The particles produced by green synthesis differ from those using physio–chemical approaches. [3] Green synthesis, a bottom up approach, is similar to chemical reduction where an expensive chemical reducing agent is replaced by extract of a natural product such as leaves of trees/crops or fruits for the synthesis of metal or metal oxide NPs. Biological entities possess a huge potential for the production of NPs. Biogenic reduction of metal precursors to corresponding NPs is eco-friendly [4] (Figure 1). Copper nanoparticles were synthesized by leaf extract of Aloe barbadensis plant. The plant is also known as “Aloe vera”. The green synthesis of copper nanoparticle by Aloe vera plant extract is fast, easy and (Figure 2). environmentally suitable method [5].

Figure 1: Green synthesis of NPs.

Lupinepublishers-openaccessjournals-Nanotechnology-nanomedicine

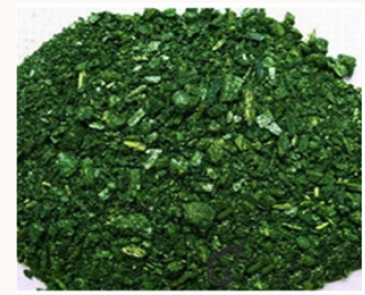
Phenolic content in plant extract dissolved in water, degradable and catalyzed synthesis of nanoparticle as capping and reducing agent [6]. This old plant is well known for deeper healing effects. It is majorly present in cosmetics and skin creams. It has the ability to clean skin and anti-aging effects of it is also famous [7]. Aloe vera contains antioxidant vitamins A, C, and plus vitamin B12, folic acid, and choline [8]. Its gel juice is taken as power drink. Minerals such as calcium, copper, selenium, chromium, manganese, magnesium, potassium and zinc are present in aloe vera. Leaves of aloe vera provide anthraquinones [9]. Copper nanoparticles synthesis by using electron microscopy represented that their range is upto 50 to 130nm [10]. Copper nanoparticles important as compares to other nanoparticles due to their properties that are found at less cost than that of expensive metal such as gold and silver such as examination of catalytic activity of copper nanoparticles by degradation of malachite green [11]. Copper oxide particles show effective catalytic removal of organic dyes such as malachite green, when particles were added into it [12]. The use 0fgreen method increased so much because of its easy preparation and low manufacturing cost. Moreover, less to toxic starting materials and ease of handling make it more favorable [13]. Malachite green is extensively used in many industries as a dye for leather, textiles and also in aquaculture industry to control fish parasites and disease [14]. Malachite green is classified as a class II health hazard and they pose toxicity (mutagenicity, genotoxicity) to the aquatic organisms like fish, algae, bacteria etc. and it’s proved to be highly carcinogenic and is banned by many countries [15] (Figure 3). The removal of organic pollutants and dyes from industries remain as a challenge as these dye molecules are difficult to decompose. Varieties of organic and heavy metal pollutants were removed by nano adsorbents by various research groups [16].

Figure 2: Aloe veraplant.

Lupinepublishers-openaccessjournals-Nanotechnology-nanomedicine

Figure 3: Malachite Green

Lupinepublishers-openaccessjournals-Nanotechnology-nanomedicine

Materials and Methods

Material

Copper sulphate, Aloe barbadensis leaves, sodium borohydride (NaBH4), organic dyes such as Malachite green

Preparation of Plant Leaf Extract

50g of the Aloe vera is taken from the nearby garden. The leaves of aloe vera are first separated from the gel part o0f aloe vera. The leaves are then washed thoroughly with distilled water to remove soil and dust particles. After washing leaves were dried and finely chopped. These finely chopped leaves were allowed to boil for 15min at 100 °C with 100mL of de-ionized water in a250-mL flask and then allow to cooled down to come at least at room temperature. The resulting solution is passed through a filter paper to remove any solid particles and then again filtered throughaWhatmanfilterpaperofporesize0.2μm.Thefiltrate is stored at 6 °C as a stock for the synthesis of CuO NPs.

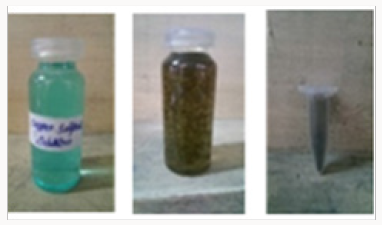
Green Synthesis of Cuo NPs: A copper sulphate solution of fifty milliliters was added to 15ml aloe vera leaves extract. The solution was stirred on a magnetic stirrer at 120degrees. The color change was observed. The color changes from deeply blue to colorless and then dark red at saturation. Brick red color confirms the nanoparticles formation. The resultant solution was centrifuged for ten mints at speed of 50,000rpm. After discarding supernatant copper oxide nanoparticles were dried in a watch glass. After drying, black color particles (Figure 4). were assemble for further characterization.

Figure 4: copper NPs synthesis.

Lupinepublishers-openaccessjournals-Nanotechnology-nanomedicine

Characterization of Green Synthesis Copper Nanoparticles

The morphological, structural and chemical composition of CuO NPs were analysed by using SEM (jsm-6480) and XRD (XPERTPRO) equipment. Optical properties of synthesized particles are investigated by UV spectrophotometer (DB-20). Size and shape of copper oxide nanoparticles were observed by SEM (jsm-6480). The crystal structure of synthesized nanoparticle is examined by XRD (XPERT-PRO), FTIR analysis is performed for the collection of the functional groups, present in this synthesis of CuONps.

Colour change observation: Color changes indicate the formation of nanoparticles of copper oxide. Blue color solution was turned into red or brick red indicated for formation of copper nanoparticles synthesis.

Result

X-Rays Diffraction Studies

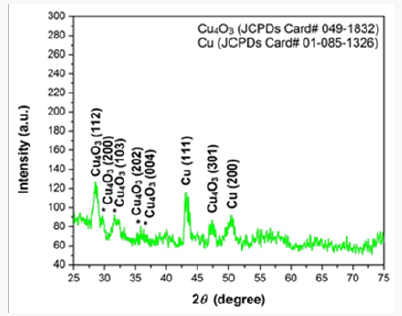
Copper oxide nanoparticles were examined by X-ray diffractometer (XPERT-PRO). Copper oxide powder was put in cubes of XRD for calculation of intensity. The resultant pattern of synthesized nanoparticles was analyzed. The peaks at 2θ correspond to intensity as the peaks at28, 29.8, 32.1, 35.8, 36, 43.3, 47.5, 51.1, and have 112, 200, 103, 202, 004, 111, 301 and 200, pattern which is compare to JCPDS card no (049-1832). The pattern of Cu nanoparticles compared to JCPDS card no (01-085-1326), the peaks at 2θ. XRD pattern confirmed that CuO nanoparticles are highly crystalline with cubic crystal structure. The average size of the particle calculated by Scherrer equation was 60-100nm (Figure 5).

Figure 5: XRD pattern of Cuo NPs.

Lupinepublishers-openaccessjournals-Nanotechnology-nanomedicine

FTIR Analysis

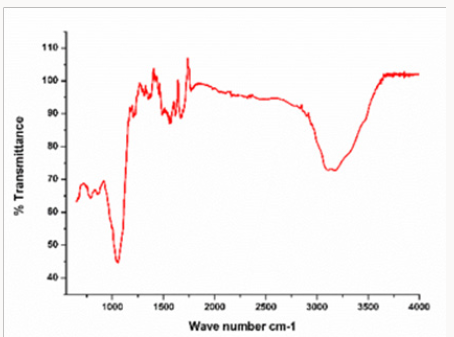
In this analysis, FTIR (IPRrestige-21) spectrum was analyzed. The analyzation confirms the presence of copper nanoparticles. Different peaks were observed at 1100cm-1 confirm formation of Copper oxide nano particle speaks was observe in range of 400-4000cm-1. The FTIR spectrum of Copper oxide nanoparticle exhibits that the broad absorption band at 32cm-1 corresponds to the hydroxyl (OH) functional group in alcohols and phenolic compounds. The peak at 1601.2cm-1 is due C=C aromatic bendindg. Absorption peak at 1038.0 cm-1 stretching vibration of C–O group of primary and secondary alcohols (C–O), while smaller peaks at 900- 700cm-1 were also (Figure 6). Assigned to the aromatic bending vibration of C–H group (Table 1).

Table 1: Absorption peak at 1038.0cm−1 stretching vibration of C–O group of primary and secondary alcohols (C–O), while smaller peaks at 900–700 cm−1 were also assigned to the aromatic bending vibration of C–H group.

Lupinepublishers-openaccess-Nanomedicine

Figure 6: FTIR spectra of copper oxide nanoparticles.

Lupinepublishers-openaccessjournals-Nanotechnology-nanomedicine

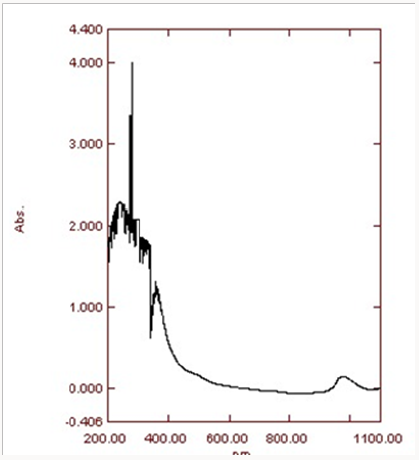
Ultra violet spectroscopy: The presence of copper oxide nanoparticles is confirmed at the range of 200-1100nm. The ecofriendly method for the synthesis of copper oxide nanoparticles using Aloe vera leaves extract proved feasible, coast free and successful method. UV-Vis spectra analysis has apparently shown the formation of copper oxide nanoparticles. Nanoparticles synthesized have variety of application in the different field. The maximum absorption peak is between 265-285nm.The peak at about 280nm was achieved (Figure 7).This peak confirmed formation of the copper oxide nanoparticles.

Figure 7: Nanoparticles synthesized have variety of application in the different field.

Lupinepublishers-openaccessjournals-Nanotechnology-nanomedicine

SEM Analysis

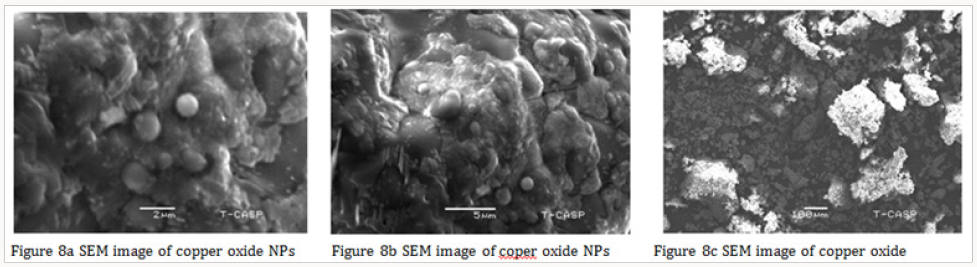
The average particle size of copper nanoparticle was analyzed by SEM model (JSM-6480). The range of grain of copper oxide nanoparticle was calculated about 50.5-130nm by SEM micrograph. It was observed that particles were smooth with a spherical shape (Figure 8). The catalytic activity of the CuO NPs analyzed by the degradation of malachite green dye. The catalytic activity of the CuO NPs analyzed by the degradation of malachite green dye. Preparation of 1000mg/l dye S.S. 1000ppm solution of Malachite green dye was prepared by dissolving dye in 1-liter distilled water.

Different concentration of dyes was prepared from stock solution. 100ppm solution was prepared from 1000ppm solution after dilution. After that 150,200,250-ppm solution was prepared. 18g of NaBH4 is made up to 10mL and kept aside. Different concentrations of NaBH4 and catalyst are tested on the methylene blue dye. The catalytic degradation of organic dyes was observed by measuring UV-Visible spectra at regular time intervals.

Figure 8: SEM micrograph.

Lupinepublishers-openaccessjournals-Nanotechnology-nanomedicine

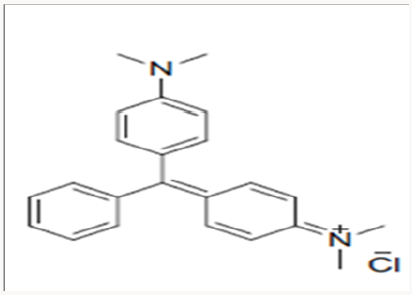
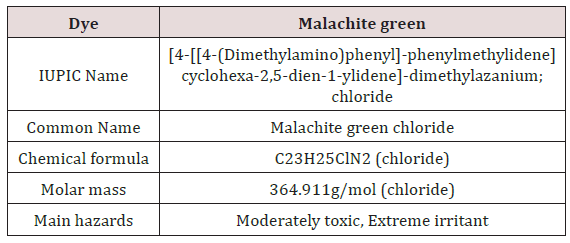
Malachite Green: Malachite green is extensively used in many industries as a dye for leather, textiles and also in aquaculture industry to control fish parasites and disease. The use has increased so much because of its easy preparation and low manufacturing cost (Table 2) (Figure 9).

Figure 9: Stucture of dye (malachite green).

Lupinepublishers-openaccessjournals-Nanotechnology-nanomedicine

Table 2: The use has increased so much because of its easy preparation and low manufacturing cost.

Lupinepublishers-openaccess-Nanomedicine

Structure

Dye Degradation: The degradation of malachite green in the absence and presence of CuO NPs were studied spectrotometrically by using DB-20 UV-Vis spectrophotometer determining the decrease in the absorbance at 631nm.The reaction was study spectrophotometrically at room temperature (25 0C). The colour of the reaction mixtures faded, indicating that degradation had occurred. The same procedure was followed for uncatalyzed reactions, in absence of CuO NPs.

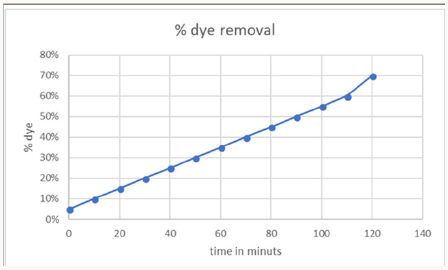
1-Time Effect on Dye Removal: Decolorization of dye Malachite Green at room temperature was analyzed. Initially 20ml dye solution was taken and 1mg of greenly synthesized copper nanoparticles using aloe vera leaves extract dissolved in it. 0.1mg of NaBH4 was dissolved as a reducing agent. The solution was heated for 10- 20 mint at 100 degrees. The time interval was taken in consider gradually during reaction. The removal percentage of decolorization was calculated and draws graphically. The maximum time was 120 mints with70% color removal. This confirms the rapid reaction of copper oxide nanoparticles (CuO NPS) (Figure 10).

Figure 10: The time interval was taken in consider gradually during reaction.

Lupinepublishers-openaccessjournals-Nanotechnology-nanomedicine

Figure 11: Aloe vera synthesized copper oxide nanoparticles showed maximum percentage decolorization as pH was increased at a certain limit after more increase has a negative effect.

Lupinepublishers-openaccessjournals-Nanotechnology-nanomedicine

2-pH effect on dye removal: pH of the solution also majorly affected the de-colorization of dye. pH effect on the decolorization of copper oxide nanoparticles was analyzed in this research. Aloe vera synthesized copper oxide nanoparticles showed maximum percentage de-colorization as pH was increased at a certain limit after more increase has a negative effect. This may be happened due to the formation of more positive ion competition. Maximum de-colorization 70% was at pH 5 (Figure 11).

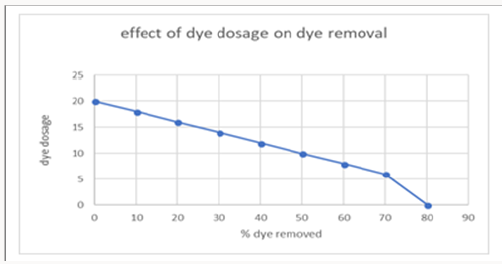
3-Concentration of dye effect on decolorization of dye: The increase or decrease in the concentration of Malachite green MG dye is also considerable in decolorization efficiency. The graph was obtained after experimenting various concentration of dyes. The maximum amount of dye taken was 20mg/l. After increasing concentration no effect on 70 decolorizatioof dye was observed (Figure 12).

Figure 12: After increasing concentration no effect on70 decolorizatioof dye was observed.

Lupinepublishers-openaccessjournals-Nanotechnology-nanomedicine

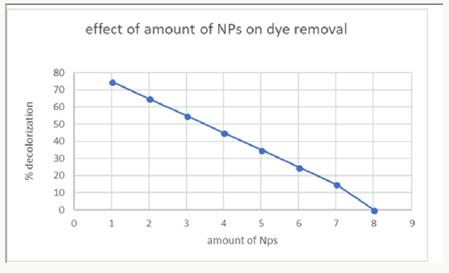
4-Effect of Copper Oxide Nanoparticles Amount on Dye Removal: The number of copper oxide nanoparticles exhibits positive results on decolorization. The number of nanoparticles 1 gram was taken showed maximum de-colorization power. This confirmed from the experiments that increasing of nanoparticle showed no effect on de-colorization. This concentration of nanoparticles was used in further experimentation of research (Figure 13).

Figure 13: This concentration of nanoparticles was used in further experimentation of research.

Lupinepublishers-openaccessjournals-Nanotechnology-nanomedicine

Conclusion

Here in conclusion, we concluded a method of green synthesis of Cu nanoparticles by leaf extract of Aloverabarbadensis plant. This eco-friendly way of synthesis of nanoparticles is more recommended over other methods as green synthesized CuO NPs are cost-effective, biogenic molecules with the capability to serve as dye absorbent. From vast of analyzation on nanotechnology for synthesis of nanoparticles it is declared that it is safer and best by using natural plants. With the huge plant variety much more plants are still not known for the synthesis of nanoparticles. Nanoparticles synthesized can be applicable in the different field of biochemistry, Pharma, agriculture and industry. Copper oxide nanoparticles have the ability to remove carcinogenic dyes. In the present study, Malachite green dye was removed by nanoparticles and its time, pH, contact time was observed. The maximum contact time was 120min, pH was observed 5, nanoparticle amount 1mg which proved green synthesized copper nanoparticles, as best removal of carcinogenic dye like Malachite green.

Read More About Lupine Publishers Journal of Nanomedicine Please Click on Below Link https://lupine-publishers-nano-science.blogspot.com