Monday, 11 January 2021

Lupine Publishers | Role of Ephemerals in Sustainability of Grazing Lands in Arid Areas

  Lupine Publishers | Current Investigations in Agriculture and Current Research


Abstract

Ephemeral species germinate with onset of rains and complete their lifecycle by setting seeds as the soil moisture declines within one growing season. Though their life cycle is short, they play a multifaceted role in ecological and economic sustenance of arid regions in general and grazing lands in particular. This role of ephemerals emanating from various studies has been synthesized here in respect of Indian arid zone. Nearly half of the reported 682 species in the Indian arid zone are ephemeral and seasonal, the majority being monsoonal. They constitute bulk of alpha diversity on any landscape. These occur on all land uses i.e., croplands and grazing lands. Species composition of ephemerals which varies on different habitats and in varying annual precipitation has been described in this paper.

Changes is species composition, cover and biomass of ephemerals due to grazing have been discussed. Comparing phenology of selected seasonals in different grazing pressures with those in protected areas revealed that increasing grazing stress caused a typical shift in their phenophases. Production potential of ephemerals estimated in a large variety of situations indicated that they contribute differently to the total biomass of the grazing lands representing different range conditions. Since ephemerals being palatable offer grazable material, their role in prolonging duration of range use by the livestock has been proved from case studies. Besides, ephemerals occur as weeds of cropland, their composition and biomass on different habitats have been described to assess their contribution to liverstock support. The ecological value of self regenerated ephemerals in rehabilitation of disturbed lands such as mine spoils has been discussed. Many of these ephemerals are also medicinally important with proven economic potential for enhancing the livelihood of desert dwellers.

Keywords: Ephemerals; Sustainability; Grazing; Phenophase; Biomass

Introduction

Arid regions experience a spurt in vegetation emergence during monsoon. While perennials regenerate, the annual species germinate to put up a sprawling green cover bringing profound changes in the desert landscape. These include changes in species compositions, phenology, production and utilization of these ephemerals vis-a-vis perennials. While extensive literature exists on these aspects in respect of perennials, little attention seems to have been paid to the desert ephemerals. Secondly, twelve extreme arid districts in western Rajasthan have 67.2% area under culturable waste which is used as grazing ground [1]. This region provides highest quantum of meat, milk, and wool to the country from an area (36%) of which 2/3 area is largely a degraded wasteland. Encroachment of these grazing lands is shrinking their area on one hand while quality of the feed is also declining due to overstocking. How constantly shrinking grazing lands in this region, which are also declining in feed quality with less perennial grasses sustain enhancing livestock pressure has been a paradox. Do ephemerals play any role in sustainability of these grazing lands was a question that needed an independent investigation for arriving at unbiased conclusion. An attempt has therefore been made in present paper to collate and synthesize results of studies on various such aspects to prove that ephemerals do play an important role in sustainability of grazing lands in arid areas with special reference to Indian arid zone

The Environment

Region facing annual water deficit of two - third or more of the potential evapotranspiration (PET) is classified as arid [2]. Semi arid regions experience this deficit ranging from one third to two third of PET. Using this criteria 9.56 lakh km2 (30.50%) can be classified as semi arid and 3.81 lakh km2 (10.16%) area as arid in India. Arid region of India has over 60% area in western Rajasthan and experience extremes of temperature (0 to 4 °C in winter and 45- 48 °C in summer), low annual precipitation ranging from 450mm in the east to 10mm in the west, low humidity, high wind velocity and high evapotranspiration. Soils are sandy, poor in nutrient with low water holding capacity and prone to erosion by wind and water. Natural vegetation in such edapho climatic conditions is sparse and stunted, predominantly spiny belonging mainly to grass cover type Dichanthium- Cenchrus-Lasiurus- type and very small area having Sehima- Dichanthium type [3].

Dichanthium - Cenchrus_ Lasiurus Cover Type

This grass cover occurs in the region receiving 100-750mm rainfall with higher mean temperature during summer (42-48 °C) and winter temperature as low as 1 to 2 °C). These grasses occur mainly on alluvial soils with varying amount of loam having high soluble salts and pale gray and brown colours. The geographical extent of 4.36 × 10⁵sq km area is distributed in northern portion of Gujarat, Rajasthan (excluding Aravallis), western Uttar Pradesh, Delhi State and semi arid Punjab and Haryana [4]. This cover type has 11 perennial grasses, 45 other herbaceous species of which 19 are legumes. The predominant woody perennials here include Acacia senegal, Calotropis procera and Cassia auriculata. These areas look typical as savanna lands.

Floristics of Herbage

Table 1: Herbage species and their families in the Indian arid zone (S=season, W=winter, M=monsoon, A=all yr).

Lupinepublishers-openaccess-Agriculture

Arid part of Rajasthan has 682 species. Of these 331 are ephemerals belonging to 44 families [5] (Table 1). Hydrophytes have been excluded from this analysis. Some 54 species are winter ephemerals; 17 occur in both monsoon and winter. In true sense, some 260 species (38.12% of flora) constitute monsoon herbage. These belong to 188 genera and 44 families. Amongst families, Poaceae has maximum i.e. 53 monsoon species followed by 25 in Fabaceae and 20 each in Cyperaceae and Asteraceae, 15 in Euphoriaceae, 14 in Convolvulaceae and 11 in Acanthaceae, and remaining families having lesser than these species.

Herbage Communties

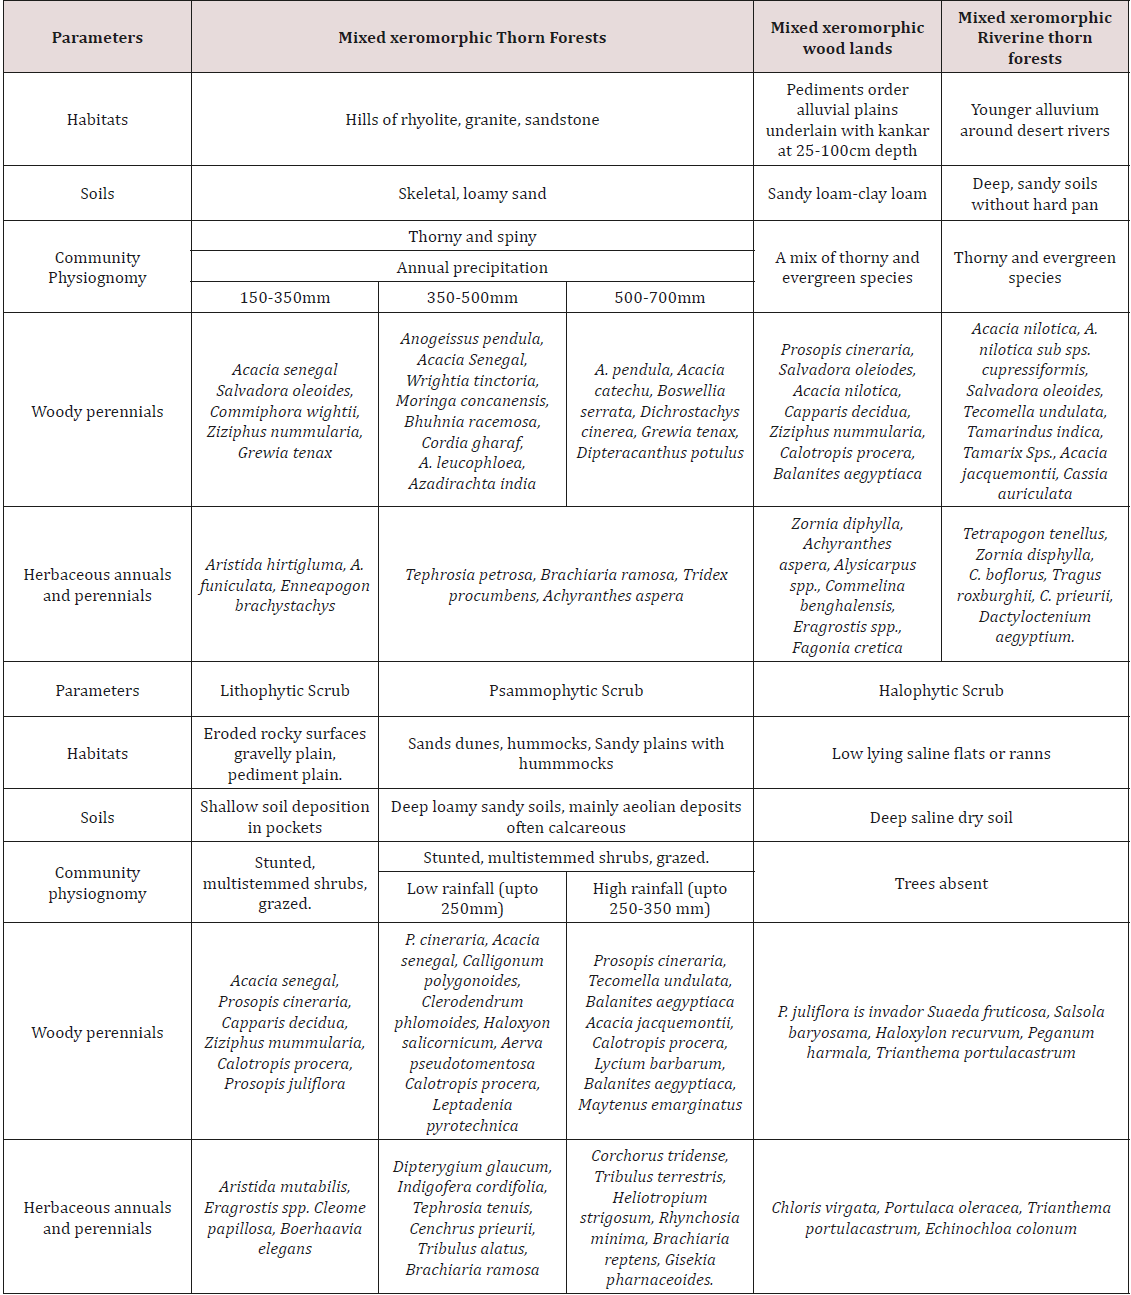
Vegetation is a reflex of climate, land form and its surface deposit. Broadly classified on the basis of physiognomy, six characteristic types are recognized in the Indian arid zone [6]. These are

a) Mixed xeromorphic thorn forest on hill and rock outcrops.

b) Mixed xeromorphic wood lands on piedmonts and alluvial plains.

c) Mixed xeromorphic riverine thorn forest on younger alluvial plain around desertic river and water bodies.

d) Lithophytes scrub on eroded rocky gravelly plains.

e) Psammophytic scrub on sand dunes, hummocks and sandy plains.

f) Halophytic scrub on low lying saline flats or ranns (Table 2).

Table 2: Vegetation types of Indian Arid zone.
Lupinepublishers-openaccess-Agriculture

Each vegetation type has specific trees, shrubs, forbs, grasses and seasonals [7]. Though ephemeral/seasonals are specific to each vegetation type, their common occurrence within two or more vegetation types indicates that their niche requirements are met there. It is important to note that most of the ephemerals often form pure colonies under trees and shrubs. In fact, these are the pioneer species in succession of vegetation on these habitats when their dominance is 80-100% in the beginning of colonization and ecesis and it declines to often 20-30% in the sub-climax to climax formation.

Life Cycle Of Ephemerals

Besides showing spatial specificity, some ephemerals are unique in their temporal presence; being ‘accidental vegetation [8]. Accidental vegetation appears only during high rainfall; say once in the years when rainwater collects in depression where these species come up. Monsoon herbage act as ‘rain-gauges’ i.e. these will germinate only after a particular amount of rain is received in one event. In contrast, there are species which germinate at the very first event of rainfall irrespective of amount. These include large number of species of Indigofera, Aristida and Cenchrus. If there is no successive rain with in a span of 15-20 days these will start flowering and set seeds as early as 20 days to 40-50 days. This has been confirmed by sequential sampling of permanent plots where seasonal variation in monsoonal vegetation has been charted and measured on rocky habitats [9], alluvial plains [10] and semi rocky habitats [11]. Their findings are: Within 21 days of rain, annuals were maximum 33.58% in August and declined to 13.6% by end of September on rocky habitats of Kailana, near Jodhpur. Likewise, maximum dominance of annual grasses was 14% within 18 days of rain and it declined to almost 1/3 i.e., 4.6% by the end of September on alluvial plains in Jodhpur. It has been found that at each germination event, 20-25% seeds of entire seed bank germinate and remaining are dormant. This is an ecological adaptation in annuals to germinate only a fraction of total seed bank so as to preserve the rest for next rain event. This ensures that if seedlings die or disappear without completing life cycle and formation of seeds, the remaining seed bank portion held with in soil is able to regenerate and continue the progeny. If however, there are continuously well distributed spells of rain, they continue to grow vegetatively till they face water stress. Growth up to 50-60 cm height has been observed in these species in case of prolonged wet spell. This indicates the plasticity in annual habit of these plants.

Composition of Herbage in Protected and Degraded Conditions

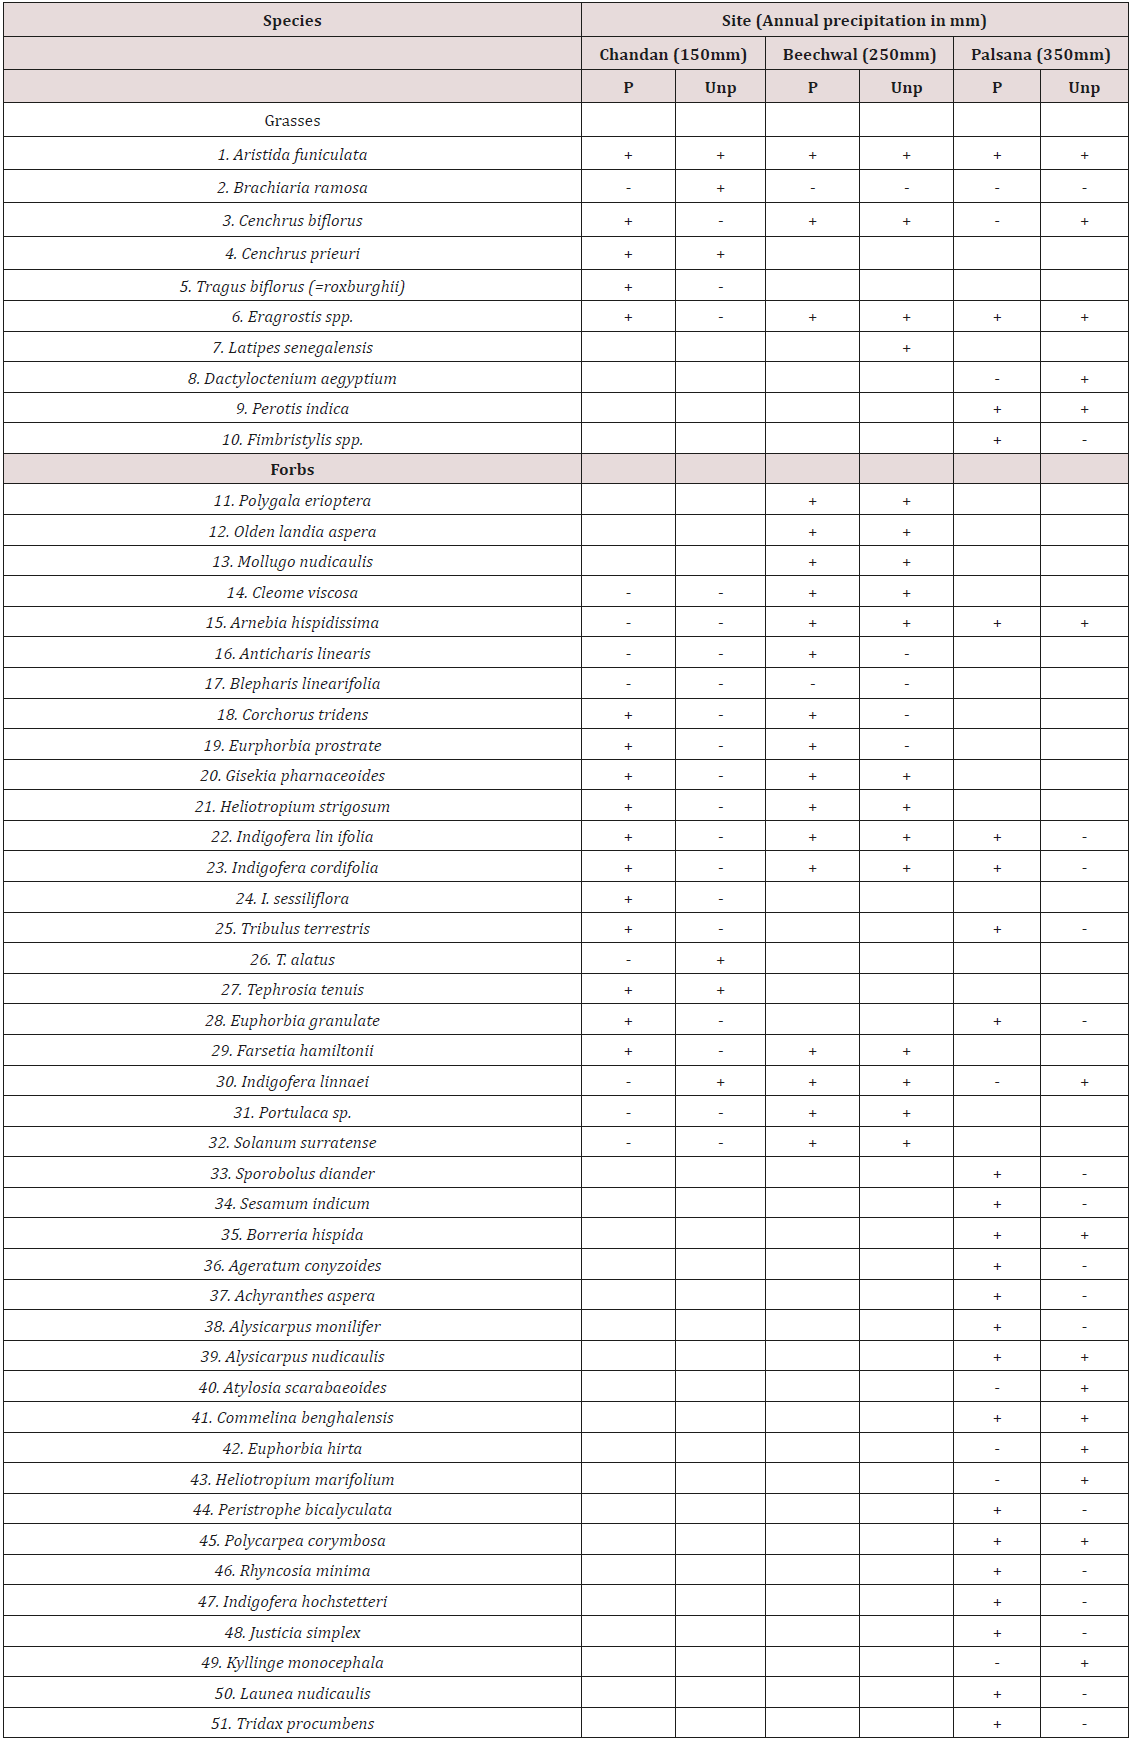
Table 3: Botanical composition of herbage in protected (P) and unprotected (Unp) grazinglands in three rain fall situations in Indian arid zone.
Lupinepublishers-openaccess-Agriculture

The composition of seasonals undergoes a drastic change upon grazing. A comparison of protected and grazed paddocks of grazingland at the end of 3 years and receiving 150mm, 250mm and 400mm rain at Chandan, Beechwal and Palsana respectively revealed that grazed sites had preponderance of unpalatable annual forbs and such grasses which have awns that deter animals (Table 3) from grazing [12]. Analysis of dominance revealed that in low rainfall zones, seasonals have RIV of nearly 10 in protected conditions and this increased three times upon degradation. In 250mm rainfall zone, the RIV of seasonals nearly 12 in protection became double i.e. 24.33 in degraded conditions. In 400mm rainfall, the seasonals dominated by having RIV of 54 under protection and 75 under degradation. Thus dominance of monsoon seasonals increased with increasing annual rainfall and increased grazing stress.

Production Potential

There are a large number of studies on estimation of dry matter yield of rainy season ephemerals at regional, landscape and local level. Shankar and Kumar [13] estimated Aristida – Oropetium cover on 2526sq. km area in Jaisalmer with their yield as low as 5 kg/ha. However, contribution of seasonals varied from 2-27% in total dry matter that was 180 kg to 922 kg/ha on different habitats in Jaisalmer. Potential of fair condition class grazingland was estimated as air dry 14 kg/ha for Aristida- Eragrostis type, 700 kg/ha in Digitaria adscendens type, 3430 kg/ha in Echinochloa colonum type and 4570 kg/ha in Dachtyloctenium aegyptium in Jalore district [14]. At landscape level, production of palatable monsoonals in 3 landscapes in Churu district was 174, 250 and 567kg/ha on forest floor, a planted grazingland and moderately degraded natural grazing land (Table 4). In Sikar, a protected site has 491kg/ha (92.9%) palatable and 40kg (7.1%) unpalatable herbage. The adjoining unprotected site had 230kg/ha palatable (71%) and 95kg/ha unpalatable herbage biomass [12]. Not only the total herbage yield but also yield of palatable species decline upon indiscriminate grazing. This also indicated a potential of regeneration of seasonal palatable herbage to the tune of nearly half a ton per hectare by mere protection.

Table 4: Production potential of grazingland herbage (kg.ha) in Churu District.

Lupinepublishers-openaccess-Agriculture

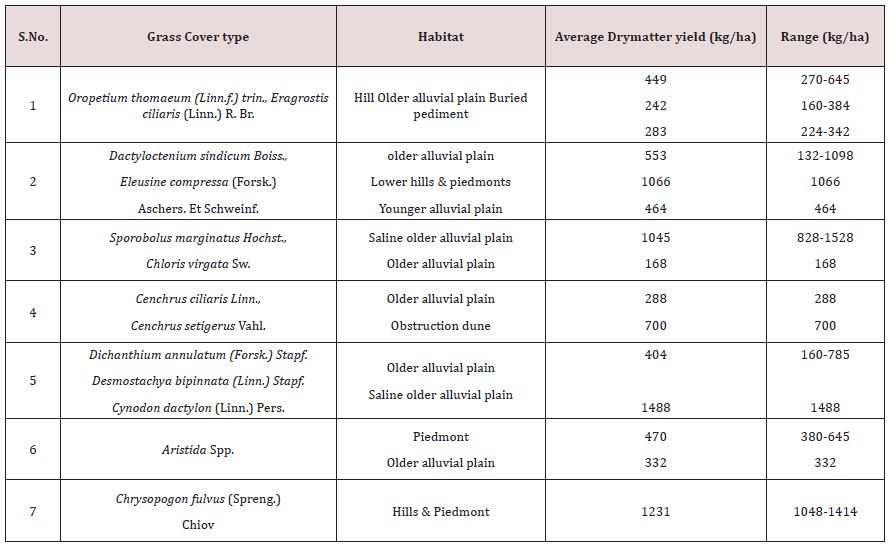
Table 5: Herbage Yield of different grass cover types on different habitats in Guhiya catchment.
Lupinepublishers-openaccess-Agriculture

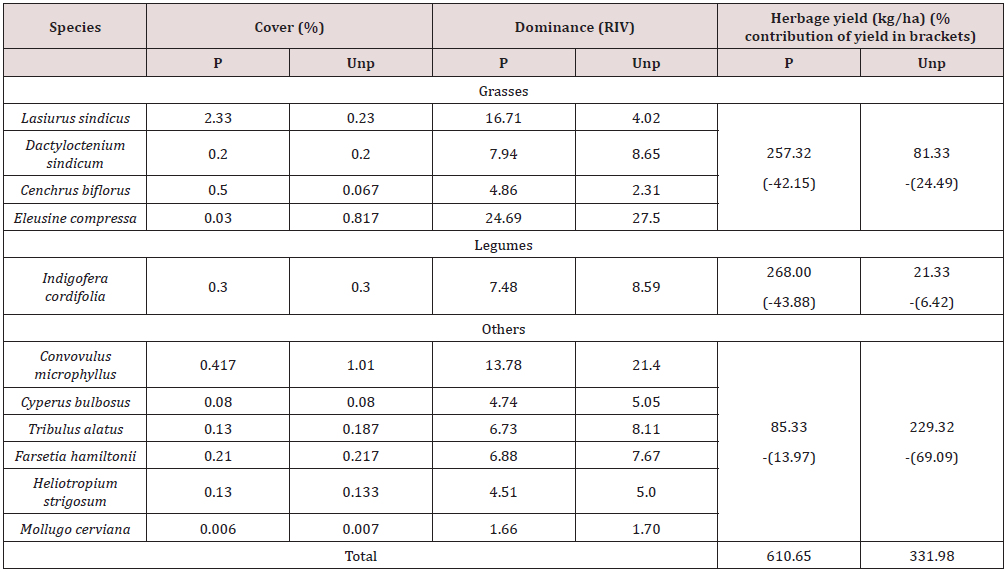
Its dependency on rain amount was proved by [15]. Estimates of grazable biomass in Guhiya catchment covering Pali and southem Jodhpur district (Table 5) revealed that predominantly seasonal grazinglands have approximate 449-470kg/ha dry matter yield, which is comparable to such grazing lands supporting perennials species. A scope of improvement in yield and carrying capacity was also predicted [16]. At village level, estimates in Bikaner district revealed that herbage yield in overgrazed native grazinglands was nearly half (330.98 kg/ha) of the nearby protected area (610.65kg/ ha) which was fenced for two years (Table 6). It is interesting to note that even under protection the bulk of dry matter, i.e. nearly 44% was by a single monsoon legume i.e. Indigofera cordifola (Table 6) though there were other contributors like Cenchrus biflorous, Tribulus alatus, Farestia hamiltonii and Mollugo cerviana, their exact contribution was not reported by [17]. But this estimate amply proves that monsoon seasonals not only make up 34% of floristic composition, they also make up over 50% of biomass of grazing lands which is palatable too, in both protection and degraded conditions.

Table 6: Cover, dominance and herbage yield in a protected (P) and unprotected (Unp) village grazinglands in six villages in Bikaner.
Lupinepublishers-openaccess-Agriculture

Similar conclusion was reached by [18] in seven-year monitoring of rangelands of Lawan in Jaisalmer stating that “--- major contribution in all grazing plots was from Indigofera cordifolia (1.26-1.98%) and less than one percent form perennial grasses”. In extremely degraded conditions however, all palatable are removed and unpalatable biomass also remain ½ and 1/3 of that in protected situations. The important implication of this finding is that nearly 70% of grazingland in Indian arid zone are degraded while 14% are in fair, 13% in good and 2-3% have excellent condition class [19]. It is these 70% areas which have poor perennial plant cover but a preponderance of monsoon seasonals and these ephemerals constitute available grazable material @ 500Kg/ha to sustain liverstock.

Ephemeral’s Response to Grazing

Impact of different levels of grazing on cover of selected annual forbs and annual grasses in permanent quadrats and transects in arid and semi arid regions was investigated in one monsoon season at two sites in India: low rainfall arid site (240mm/year) at Chandan experimental site of CAZRI in Jaisalmer district in western India and a high rainfall semi arid site (400mm/year) at Pali experimental site of CAZRI in Pali district [20]. Treatments were: No grazing (control), 50% or half of carrying capacity (3 sheeps/ha), 100% of carrying capacity (6 sheeps /ha) and 50% more than carrying capacity(8 sheeps/ha). Mild grazing of 3 sheep/ ha and sometimes even 6 sheep/ha at arid Chandan site enhanced the cover of three annual grasses, Aristida mutabilis, C. biflorus, Latipes senegalensis from July to October. Such an increase was more than that in control or 8 sheep/ha treatment, confirming the fact that mild grazing promotes the growth. In contrast, annual forbs (Indigofera cordifolia, I. linifolia, I. hochstetteri and Gisekia pharnaceoides) cover declined with increasing grazing pressure. Response to increasing grazing pressure was different at semiarid Pali site: though Aristida mutabilis increased with increasing grazing pressure, the other forbs species also increased up to September and declined later, with increasing grazing pressure.

This was also confirmed by positive significant correlation between cover and grazing intensity i.e., increases in cover with increasing grazing pressure in Aristida mutabilis. Importantly, correlation coefficient between grazing pressure and cover of Indigofera hochstetteri, I. cordifolia, I. linifolia at arid site and C. pumila at semi arid site was strongly negative. Thus same species behaves differently in two different rainfall situations. It emerged from above that annual species after being nibbled or partly grazed by sheep re-sprout and assume growth in semi arid situation, behaving much as multi cut fodder corp. These findings were in conformity with results of an earlier grazing experiment of three years at Kailana, Jodhpur where per cent plant cover increased from 4.8 to 7.42% and forage yield, 28.3 to 29.8kg/ha after grazing [21].

In the same experimental paddocks at Chandan in Jaisalmer district of western India, phenological changes at monthly intervals were also recorded under different grazing pressures. Concurrently, palatability of species as and when the sheep bites was also noted for one hour each during morning (8-10AM), noon (12-2PM) and evening (4-8PM). Results revealed that vegetative phase was shortened and flowering, fruiting and seed set occurred earlier in perennial like Lasiurus sindicus as the grazing pressure increased [22]. Thus compressing the vegetative phase emerged as a mechanism of evading grazing pressure in this perennial grass. Reverse was noted in all the ephemeral species. Vegetative phase was prolonged with increasing intensity of grazing and thus seed setting was delayed in ephemeral species Aristida funiculata, Indigofera cordifolia, Indigofera linifolia and Corchorus tridense. This shift in phenophase could be related to their relative palatability. Since annual species germinate and grow with their fresh foliage during the monsoon rains, annuals (due to fresh foliage) were eaten in preference over the perennials. This preferred removal of annuals due to their palatability, if continued unabated, would finally remove them completely due to overgrazing. In fact, such a shift in phenophases, induced by increase in grazing intensity, can effectively be used as indicator of beginning of deterioration of rangeland health. And this becomes the start point of desertification in grazing lands in deserts. Moderate grazing is therefore, desirable for maintaining range health for sustainable grazing. On the other hand, it is also important to realize this potential of monsoon ephemerals as grazing material as by way of corollary these can be sown and then cut, not grazed, and fed to animals.

In order to further understand the role of herbaceous annual and seasonal vegetation, another grazing study was undertaken for two consecutive years in Lasiurus sindicus dominated protected grazingland at experimental area at Chandan in Jaisalmer district Kumar et al. [23]. There were five grazing treatments:T-1: Control (No grazing); T-2: Optimum carrying capacity with supplemental feed (6 sheep grazing); T-3: Optimum carrying capacity without supplemental feed (6 sheep grazing); T-4: Double the carrying capacity with supplemental feed (12 sheep grazing) and T-5: Double the carrying capacity without supplemental feed (12 sheep grazing). Results revealed that irrespective of supplemental feed, 70-80% of L. sindicus cover declined in paddock with double the carrying capacity (T-4 and T-5). This study again proved findings in previous para i.e., preferential consumption of seasonal and low perennials such as Ochthochloa compressa and annual Cenchrus biflorus in monsoon and post-monsoon. Grazing animals did not eat perennial species as if these have been left by them for future consumption when these ephemerals dry, die and no more available say, after December. This postponement in consumption of perennials effectively prolonged the duration of range-use. On the other hand, as the grazing pressure increased, biomass declined by 80% in two years i.e., from 461.5 (T-2), 306.6 (T-3), 450.5 (T-4) and 341,1 (T-5) kgha-1 to 70.3 (T-2), 29.6 (T-3), 28.7 (T-4) and 15.4 (T-5) kgha-1. In rain driven ecosystem of arid lands, even a small variation in the quantum, spread and timing of rainfall causes major effect on vegetation composition [24]. These have cascading effects making the whole system vulnerable to drought and adversely affecting sustainable productivity of the rangeland ecosystem [25]. This study thus, concluded that rainy season ephemerals by way of their preferential consumption give temporary or seasonal rest to perennials like L. sindicus enabling it to grow and recover. Vetter et al. [26] while discussing such differences in composition, structure, diversity and forage production potential of vegetation under different grazing intensities reasoned that these ephemerals can draw water from whole soil profile throughout the growing seasons where as climax grasses withdraw water from deeper layers of 2-5m during droughts [24].

Thus, resource utilization is partitioned to be optimally used among ephemerals and perennials resulting in better growth of both these components. Consequently, grazable material becomes available from the same grazing land for a longer duration and that imparts resilience to the grazing land system. Fynn [27] also reported that short, nutritious grasses in functional wet seasons habitats facilitate optimum intake of nutrients and energy for lactating females, for optimal calf growth and building body stores. Heterogeneity in vegetation composition due to ephemerals was also emphasized for achieving optimum grazing use by [28]. Evidently, Kumar et al. [23] in their study also related the spatial patterns created by patches of seasonal vegetation in the landscape and temporal patterns of biomass (= productivity) availability of seasonals in post monsoon and perennials in winter and summer with long term sustainability. Fynn [27] also concluded that grazing based on spatial and temporal variability in forage quality and quantity would be more sustainable. Nutritionally also, seasonal vegetation having higher crude protein than perennial grasses [29] meets the nutritional needs of the livestock. Utilizing above mentioned spatial and temporal patterns was also recommended as best range utilization strategy by [27]. But Kumar et al. [23] found that free range animals in monsoonal rangelands themselves do selective grazing based on seasonal availability of biomass i.e., they graze annuals first (August to November) and then perennials (December to April) and both litter and perennials in summer. A mix of cattle, goat and sheep would further optimize to increase range utilization.

Ephemerals/seasonals, therefore, not only provide heterogeneity and complexity to the grazing landscape, they also complement the nutritional needs as well as prolong the period of range use thereby delaying the onset of degradation. This spatial heterogeneity imparted by seasonal vegetation in an overall matrix of perennial tall grasses and woody perennials need to be managed optimally by grazing management of both seasonals and perennials. It was therefore, concluded “…. that

a) arid rangelands have intrinsic heterogeneity in species composition,

b) this mix of seasonal and perennials (= heterogeneity) is ably supported by the landscape by way of partitioning of resources,

c) lifecycle patterns of seasonal fits well to meet the nutritional needs of livestock and

d) grazing of such seasonal vegetation thus helps sustain perennial tussocky rangelands for longer range-use …”.

Such a functional role of ephemerals as revealed in the aforementioned studies in respect of grazing animals has also been found in an entirely different context by Bhardwaj et al. [30] who reported the importance of ephemerals in enhancing the population of critically endangered bird, the Great Indian Bustard Ardeotis nigriceps with a remaining population of ~200 birds (IUCN 2011). Biased habitat preference by Great Indian Bustard for new closures which were ploughed instead of old ones prompted a detailed vegetation analysis by [30] amongst different landscape units. The newly ploughed sited had regeneration of lot of ephemerals in the ensuing rains compared to the parched sites in the old ones. This led to devise a very simple management strategy of ploughing the open areas in mosaic pattern for breaking the crust laden hard surface without disturbing the Lasiurus sindicus and other perennial grasses, shrubs and trees of old closures annually just before onset of rains. Selective ploughing brought out the stored seed bank of annuals on to the surface enabling them to use moisture of the very first rain and germinate to grow further in subsequent rains. In fact, such slight amount of disturbance is known to increase diversity in all dry land ecosystems and is a desirable management intervention for the conservation of critically endangered Great Indian Bustard.

Ephemerals as Crop Area Weeds

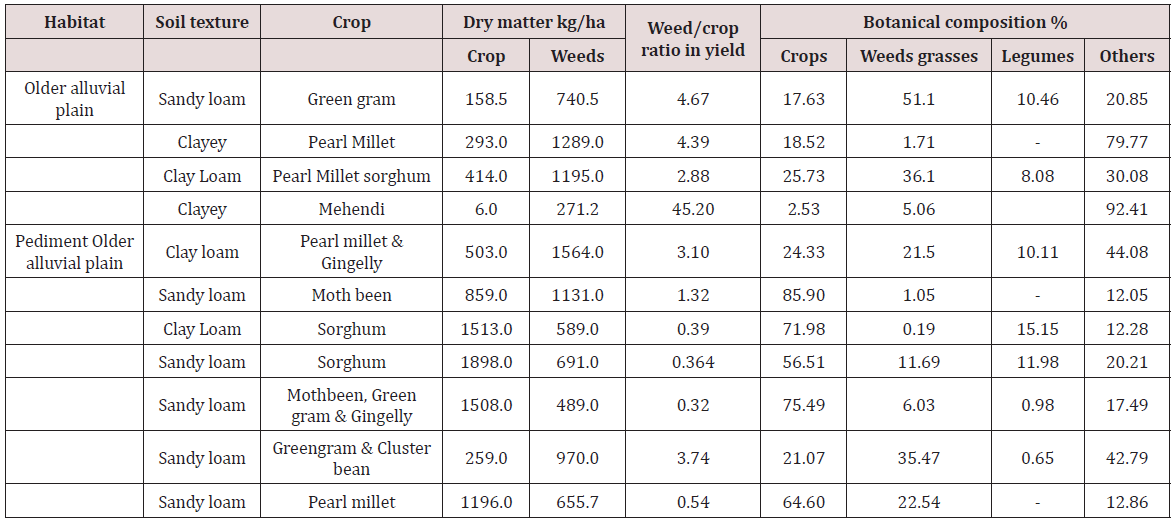
Table 7: Dry matter yield of different crops and their weeds in Guhiya catahment. (Source: Shankar and Kumar, 1984).
Lupinepublishers-openaccess-Agriculture

Ephemerals appear to be out of place in crop lands and hence called weeds. Desert farmers know the utility of these seasonals as valuable forage. Quite often, especially the monsoon ephemerals are collected, air dried and stored in livestock yard for future used. Heaps of such air dried palatable ephemerals are stacked species wise as an effective strategy of escaping drought by way of providing feed to livestock during ensuing drought when crops fail. It becomes therefore, imperative to assess the quantity of such ephemeral forage in crop fields. A study to assess their biomass revealed that weed biomass often far exceeded their companion crop [31] i.e., their biomass was 2 to 4 times more than crop (Table 7). These are mostly palatable weeds giving 655 to 1564kg/ ha of dry matter depending upon preponderance of weeds. Thus seasonal ephemerals as weed contribute immensely to livestock feed but estimates are not available to assess their contribution at landscape level.

Role of Ephemerals in Rehabilitation of Mine Spoils

Though perennials are preferred for rehabilitation of degraded lands like mine spoils, but once the seeds bank is added to soil, annuals by virtue of their repid turn over, play a key role in accelerating process of rehabilitation. Kumar et al. [32] reported as many as 14 self regenerated annuals, equivalent to that of perennials in freshly rehabilitated plots of gypsum mine spoil in Barmer, an extreme arid district in western Rajasthan. These provided organic matter to soil facilitating growth of shrubs and trees. These can be therefore, easily employed to grow and prepare niche for future generations of plants. In another rehabilitation programme for backfilled areas after lignite mining in Barmer (1999-2004), surface layering of local soil and murram was carried out and then planted with eight different tree species, seven shrub species and one perennial grass [33]. Monitoring the self- regenerated natural vegetation in these treatment blocks revealed that irrespective of treatments, all blocks had immense regeneration of ephemerals that constituted 46-48% of total self regenerated species that varied from 39 to 75 species in five rehabilitated blocks. Appearance and growth of nearly half of regenerated vegetation being ephemeral proved their crucial role in accelerating the process of rehabilitation by way of organic matter build up and its rapid turn over that later on supports growth of other companion planted species. Evidently, understanding the role of ephemerals as organic matter builder, succession facilitator and ecological moderator deserve deeper studies so as to optimize cost of such programmes and achieve faster system recovery in reclamation of degraded and drastically disturbed lands, especially in arid regions.

Ephemerals as Medicinal Plants

A survey of ethno medicinal plants in 128 villages in four arid districts in western India namely Jaisalmer, Barmer, Bikaner and Jodhpur from year 2001 to 2005 revealed 131 taxa of medicinal importance (Kumar and Parveen, 2004). Of these, herbs were maximum i.e. 52 (39.69%) followed by 29 shrubs (22.13%), 25 trees (19.84%), 11 climbers (8.39%), 9 grasses (6.87%), 3 sedges (2.29%) and 1 fungus (0.67%). Of the total species, 70 were perennials (53.43%) and 61, ephemeral or annuals including crops (46.57%). These values broadly match the Raunkiarian’s life forms in this desert in which nearly 49% are therophytes or annuals and 51% are other life forms which are perennials Mertia and Bhandari [35]. The 29 ephemeral medicinal species reported from wild grazing lands in this study are :Abutilon indicum, Achyranthus aspera, Amaranthus viridis, Argemone mexicana, Blepharis sindica, Cenchrus biflorus ,Cleome viscosa , Corchorus depressus, Corchorus tridens, Cucumis callosus, Dicoma tomentosa, Digera muricata, Eclipta alba, Eragrostis minor, Euphorbia granulatae, Fagonia indica, Heliotropium marifolium, Indigofera cordifolia, Mollugo cerviana, Mukia maderaspatana, Neurada procumbens, Pedalium murex, Phyllanthus fraternus, Polygonum plebieum, Portulaca oleracea, Pulicaria crispa, Sisymbrium irio, Solanum surattense and Tribulus terrestris. Almost all of these species come up naturally during monsoonal rains and hence are collected from wild and marketed. Many of these are immensely useful and are species of trade both nationally and internationally i.e., Tribulus terrestris, Pedalium murex, Solanum surratense, Fagonia indica, Blepharis linearifolia, Phyllanthus fraternus, and Eclipta alba. Thus these nature’s herbals enhance the cash flow in the hand of farmers. But in view of their increasing demand, a need is felt to domesticate and bring them into cultivation so as to save their native gene pools in the wild from being lost. This will also diversify the cropping system and add to the sustainable livelihood of desert dwellers.

Epilogue

Ephemeral/seasonal species are important herbage component of natural grazing lands, pasture and croplands. They are the only plants available even after the perennials are removed. Persistence to withstand pressures and re-appear once the favorable situations occur, make them highly resilient component of desert vegetation. Their life cycle strategy is also more suited to adverse temporal sequential stresses caused by climatic aberrations. Plasticity in phenological stages exhibited by ephemerals during variable grazing treatments not only provides adaptive edge to survive in harsh desertic conditions but also imparts sustenance to the whole grazing land ecosystem. By way of providing heterogeneity in species composition, ephemerals prolong the duration of grazing land use and also complements the nutritional needs of livestock. This aspect has helped to design conservation strategy of critically endangered Great Indian Bustard in its native landscape by way of provisioning of foraging material by just enabling buried ephemerals seeds to come up on surface through ploughing and then germinating during rains.

They contribute up to 500-600kg/ha dry matter without any management in natural conditions. Grown properly under managed conditions, their yield can be enhanced many folds. This can be achieved by providing moisture just before flowering so that vegetative phase is prolonged, thus capitalizing its ecological properties to further increase its yield to double or treble. Experiments are however needed to confirm whether these could be used as multicut fodder crop in sole or as intercrop. In view of rich ephemeral flora in the Indian desert, we are advantageously placed to select a few chosen species for testing their potential as future livestock feed either raw or as feed cake. Not merely a source of livestock feed, these grazing lands are also cradle of as many as 61 herbal ephemerals which are being used by people as traditional medicine; many of them having immense trade potential that can add to the kitty of local farmers. In the ecological management of mine spoiled lands, ephemerals as an adjunct to perennial species have proved their potential as a cheaper and faster rehabilitation material.


Read More Lupine Publishers Agriculture Journal Article:

Friday, 8 January 2021

Lupine Publishers | Pediatric Dentistry Condition- A Mini Review

 Lupine Publishers | Journal of Pediatric Dentistry


Abstract

Tooth decay is the most common chronic childhood disease and the World Health Organization has identified it as a worldwide problem with 60-90% prevalence among school-age children. Dental caries is a topical contagious infectious disease that affects people of all ages and in any area of the world. Oral hygiene is a part of public health and oral and dental diseases affect different aspects of quality of life. DMFT is one of the indicators that the World Health Organization has introduced to determine the severity and prevalence of caries. One of the goals of the World Health Organization is to keep the DMFT index of students at less than 2. Different factors are effective in occurrence of dental and interdental caries that we discuss about them in this mini review.

Keywords: Decay Missing Filled Index, Dental Caries, Oral Hygiene, Tooth Decay

Abbreviations: WHO: World Health Organization; DMFT: decay-missing-filled index; BSS: Basic Screening Survey

Introduction

Tooth decay is the most common chronic childhood disease and the World Health Organization [WHO] has identified it as a worldwide problem with 60-90% prevalence among school-age children [1]. According to statistics in European countries, 6.1% of children aged 6-12 have at least one decayed or missed tooth, and due to the prevalence of tooth decay in all social classes, this disease can impose heavy costs on society [2]. Also, according to the statistics in Iran, decay-missing-filled index [DMFT] was 0.2% among 6 to 9-year-old children and 0.9% to 1.5% among 12-yearold children. Also, DMFT was 1.7% in 3 to 6-year old children and 3.3 to 4.8% in 9-year old children [3]. Four important factors: host, germs of the oral environment, food and time, has a role in tooth decay, without each of which, tooth decay will not occur [4]. Therefore, oral hygiene is very important in preventing it. Prevalence of dental caries in 6 to 12-year old children is one of the most important health problems. This can directly and indirectly impair the health of children and teenagers, and this problem is common among low-income groups and groups that do not comply with oral hygiene standards, such as not using toothbrushes and floss, dental caries is much more severe and acute [5].

Dental Caries

Dental caries is a topical contagious infectious disease that affects people of all ages and in any area of the world. Oral hygiene is a part of public health and oral and dental diseases affect different aspects of quality of life [6,7]. DMFT is one of the indicators that the World Health Organization has introduced to determine the severity and prevalence of caries. Nowadays, general dental health programs are usually only concerned with determining the prevalence of dental caries. Therefore, to measure the prevalence of dental caries and to determine oral health status in the society, especially in teenagers, appropriate indicators have been introduced by reputable authorities such as the Association of State and Territorial Dental Directors [2011]. This indicator is called Basic Screening Survey. The main purpose of using this indicator is to provide a framework for obtaining cheap and easy oral health information. On the basis of this indicator, people are classified into two parts, and it is ultimately determined whether or not they have caries [8,9].

Dental caries in Iranian students

One of the goals of the World Health Organization is to keep the DMFT index of students at less than 2. There are many studies on the calculation of DMFT in Iran, including Hamisi et al. which studied 323 students in Qazvin and showed that the prevalence of non-caries was 14.3% and their DMFT was 12.1%. [10]. Also, in a study on 12-year-old children in Tehran and Isfahan, DMFT was 11.2, which was the highest rate of caries [11]. In another study, the rate of DMFT in children in Isfahan was reported 3.41, and the conclusion of this study was that it showed a high proportion of DMFT in decay [12]. A study in Sirjan [a city in Kerman province] showed that the prevalence of non-caries state in 12-year-old students was 34.1%, which means that about 60% of 12-yearold students in this city due to various reasons, particularly not using toothbrush and floss, had dental and interdental decay [13]. Also, in the U.S Department of Health and Human Services in New Hampshire, a large evaluation of oral health status among public school students was done using the BSS index and it showed that approximately 2.3% of students had dental caries [14].

Are There Any Differences Between Girls or Boys in Caries Status?

The results of some studies show that there is no significant relationship between the prevalence of caries in male and female students. Among these studies, we can mention Nabipour et al., Who did not report a significant difference in caries status between male and female students [15]. However, in some studies, such as the study by Boroumand et al., Caries in 3-6-year-old boys was less than that of girls [16]. However, in some studies, such as the study by Boroumand et al., Caries in 3-6-year-old boys was less than that of girls [16]. Also, Loyola-Pontigo et al. and Rosado-Casanova et al. reported a higher incidence of caries in girls than boys [17,18].

Some Other Effective Factors of Children’s Caries Status

Another factor affecting dental and interdental caries is the level of parents’ education. In a study by Campus et.al, there was a significant relationship between parents’ education and lower incidence of caries in children [19]. Ismail and Sohn also stated in their study that children whose parents had a college education had significantly lower dental caries than children whose parents had lower educational level [20]. Also, the differences in socioeconomic status of families can lead to a different status of caries in children, as Primosch in a study in this regard observed a changing status of caries in families with different structures and concluded that this difference may be the result of the different socio-economic status of families, which may affect children’s dietary habits as well as hygiene [21].

Acknowledgement

The authors thank Farzanegan Hazrat Zeinab High School of Rey city and student research center of Basirat especially Dr. Salmani for their supports.

Read More Lupine Publishers Pediatric Dentistry Journal Articles:
https://lupine-publishers-pediatric-dentistry.blogspot.com/

Lupine Publishers | Digito-palmar Dermatoglyphics as Biomarkers of Dental and Medical Disorders

 Lupine Publishers | Journal of Otolaryngology


Abstract

Digito-palmar dermatoglyphics is the study of the configurations and pattern-frequencies of the epidermal ridges on the palms and finger pads. They are ectodermal in origin, develop in early embryonic life, and remain unaltered throughout the rest of life. Fingerprints and handprints are widely used in criminology. Recently, digito-palmar dermatoglyphics have been utilized as biomarkers for detection of some dental, malignant, chromosomal, skin, ocular, and medical disorders.

Keywords: Dermatoglyphics; Biomarkers; Dental Disorders; Malignancies; Chromosomal Abnormalities; Skin and Eye Diseases; Diabetes Mellitus; Hypertension

Abbreviations: AFRC: Absolute Finger Ridge Count; ALL: Acute Lymphoblastic Leukemia; ANM: Acanthosis Nigricans Maligna; ECC: Early Childhood Caries; FCP: Florid Cutaneous Papillomatosis; OSCC: Oral Squamous Cell Carcinoma; OSMF: Oral Submucous Fibrosis; POAG: Primary Open Angle Glaucoma; THCS: Tel Hashomer Camptodactyly Syndrome; TP: Tripe Palm; TRFC: Total Finger Ridge Count

Introduction

Dermatoglyphics is the scientific investigation of the morphology and pattern-frequency of the skin ridges on the palms, soles and digital pads. They develop from the ectoderm germ layer in early embryonic period and remain stable throughout life. In a previous article, we reviewed the ethnicity-, age-, sex-, and laterality-related variations of digito-palmar dermatoglyphics; their role as predictors of brain disorders was discussed [1]. Here, a review is made concerning the utilization of alterations in the digito-palmar dermatoglyphics as biomarkers for the diagnosis of dental and medical disorders.

Dermatoglyphics In Dental Disorders

In Malocclusion

Craniofacial elements and epidermal ridges are ectodermal structures developed early in embryonic period. Genetic and environmental factors causing malocclusion are also thought to induce morphological alterations in fingerprint patterns; suggesting the dermatoglyphics as an effective tool for prediction of malocclusion [2]. Significantly increased twinned loops and absent radial loops on fingertips were observed in individuals with malocclusions when compared to those with normal occlusions; handprints revealed non-significant alterations [3].

Dental Caries

The epidermis of finger ridges and the dental enamel are ectodermal in origin developing in the same embryonic period, therefore dermatoglyphic patterns were used as a genetic marker for dental caries. Susceptibility to dental caries was observed to be linked to an increased frequency of whorl pattern and decreased incidence of loop pattern.[4] In an investigation on preschool children of Lucknow, India dental caries susceptibility was associated with significantly increased frequency of whorl pattern and significantly decreased frequency of arch pattern, of fingerprints [5]. In Bengalese children with dental caries, there were significantly increased total finger ridge count (TRFC) and absolute finger ridge count (AFRC) in addition to significantly changed frequency of palmar patterns and number of palmar triradii [6]. It has been generally stated that the incidence of whorls in the right index fingertip predicts significantly lower risk of early childhood caries (ECC) in both sexes whereas the incidence of whorls in the right ring fingertip predicts significantly lower risk of ECC in female children [7].

In Edentulous Arches

Digito-palmar dermatoglyphics, in edentulous individuals, were used as an effective tool for predicting the shape of the original dental arch. A significantly increased frequency of loops and a large “atd” angle predicted original square dental arches, a significantly increased frequency of whorls and a small “atd” angle predicted original tapering dental arches, and a significantly increased frequency of loops alone predicted original ovoid dental arches [8].

Dermatoglyphics In Malignancies

Tumors, in general, are associated with alterations in the digito-palmar dermatoglyphics in the form of decreased number of ridges between the triradii of both palms and between the triradii of c-d. Endocrine tumors, in particular, are associated with increased number of arches and decreased number of whorls in addition to different pattern distribution in the I3 and I4 interdigital spaces. Different pattern distribution in I1 and I2 interdigital spaces could point out to the presence of a pituitary tumor [9]. It has been also decided that palmar dermatoglyphics could be of help in discriminating individuals at high risk of oral submucous fibrosis (OSMF) and oral squamous cell carcinoma (OSCC).[10] In both OSCC and OSMF, there were increased frequency of arch and ulnar loop patterns and decreased frequency of simple whorl pattern on fingertips, in addition to decreased frequency of palmar accessory triradii on both palms (in OSCC) and decreased value of “atd” angle and decreased frequency of palmar accessory triradii on right palm (in OSMF) [11]. Palmar “atd” angle was utilized in screening women at high risk of breast cancer. Females with breast carcinoma, when compared with phenotypic healthy controls, showed significant quantitative “atd” angle differences between right and left palms [12].

In another study, carcinoma of female breast was observed to be associated with other digito-palmar dermatoglyphic changes like significantly increased frequency of arch pattern and decreased frequency of radial loops in both thumbs, left index finger and left middle finger. Added to these changes, there were lower values of TFRC and AFRC in conjunction with breast carcinoma [13]. Gastric adenocarcinoma, in a 76-year-old male, was diagnosed to be associated with three types of dermatoses: tripe palms (TP), acanthosis nigricans maligna (ANM), and florid cutaneous papillomatosis (FCP). TP was a yellowish diffuse palmar hyperkeratosis with enhanced dermatoglyphics of both palms, ANM was an extensive hyperkeratotic and hyperpigmented mucocutaneous eruption with exaggerated skin markings and verrucous excrescences and FCP included rapid appearance of multiple wart-like verrucous lesions [14]. Children with acute lymphoblastic leukemia (ALL) exhibited increased mean values of “ab” ridge count and “atd” angle when compared to the controls [15]. Any of the two unusual transverse palmar flexion creases: simian or Sydney-creases was detected , often on both palms, in more than 50% of Caucasian children suffering from malignant neoplasms. In children with ALL, the Sydney-crease was the most commonly encountered abnormal palmar flexion crease [16].

Dermatoglyphics In Chromosomal Aberrations

Palmar dermatoglyphics is known to be a valuable diagnostic tool in genetic disorders. In most palms, when the fingers are slightly flexed, two transverse flexion creases could be seen. In a minority of palms, a single transverse flexion crease may be found in one hand (the simian crease} or the usual two creases are present with one of them traversing across the palm to its ulnar margin (the Sydney-crease). In a group of "at risk" newborns, increased frequency of abnormal palmar creases (simian and Sydney) was determined. A parents' index score, using palmar dermatoglyphics (simian crease and palmar hypothenar pattern), was established as a predictive tool to discriminate parents of Down's syndrome (trisomy 21) children from healthy controls [17-21]. In 22 out of 24 aborted human fetuses, palmar dermatoglyphic alterations correlated well with the amniocentesis- diagnosed chromosomal aberrations: trisomy 21, trisomy 18, trisomy 13, structural autosomal aberrations and sex-chromosome aberration [22]. Unusual changes of the palmar creases in preschool children with psychomotor retardation (not of Down's syndrome origin) were evaluated to be as twice more frequent as their parents and school children [23].

Exposure of the embryo to deleterious environmental factors could lead to diseases that appear later in life and to marked palmar dermatoglyphic dissimilarities in the twins particularly in the III and IV interdigital and hypothenar areas [24]. In both monozygotic and dizygotic twins, the impact of genetic factors on the pattern distribution of palmar dermatoglyphics was decided to be the highest in the III interdigital area and the lowest in the IV interdigital region [25]. In two cases of Marfan's syndrome, simian crease, extra-digital transverse crease, increased “atd” angle, and high position of the axial triradus were reported [26]. In cytogenetically confirmed 46, XY females, the overall fingertip patterns showed increased frequency of ulnar loops and decreased frequency of whorls when compared to control males, their right thumbs revealed decreased frequency of whorls and increased frequency of ulnar loops in addition to decreased TFRC, AFRC, and a-b ridge count when compared to controls of both sexes. Non-significant differences in the “atd” angle, interdigital and hypothenar patterns, and simian and Sydney- creases were assessed between the tested females and their control of both sexes [27]. Tel Hashomer camptodactyly syndrome (THCS), as a rare autosomal recessive disease, is manifested with camptodactyly, clubbed feet, thenar and hypothenar hypoplasia, abnormal palmar creases and dermatoglyphic ridges, spina bifida and mitral valve prolapse [28]. Moreover, other dermatoglyphic changes were observed in the rare cases of THCS like increased frequency of whorl and arch patterns with tendency toward increased TFRC [29].

Dermatoglyphics In Skin Disorders

In vitiligo males, when compared with the controls, there were increased pattern frequency in right hypothenar and thenar areas and in both II interdigital areas, together with decreased pattern frequency in the right III and IV interdigital areas. Vitiligo females revealed increased pattern frequency in right hypothenar and interdigital area I and decreased pattern frequency in right II and left III interdigital areas. Some of these dermatoglyphic variations were statistically significant [30]. In another study on vitiligo patients, when compared with the controls, significantly increased frequency of whorls in males and of arches in females were evaluated. In addition, simian and Sydney- creases, highly significant reduction in TFRC and a-b ridge count, and non- significant alterations in the values of “atd” angle were observed in both sexes [31]. In severe hand dermatitis (eczema), there was a failure of fingerprint verification in 27% of patients compared to 2% of controls. Hand dermatitis, in these patients, was manifested by fingerprint dystrophy and significantly increased number of abnormally long and broad white streaks [32]. Patients with multibacillary leprosy, when compared to controls, showed a significantly increased pattern frequency in the left thenar/1st interdigital area. A highly significant frequency of simian crease was also assessed in palms of both multibacillary and paucibacillary types of leprosy, with non- significant alterations in the values of “atd” angle [33].

Dermatoglyphics In Ocular Disorders

Digito-palmar dermatoglyphic changes were utilized to discriminate between patients with primary open angle glaucoma (POAG) and their immediate (first-degree) relatives from phenotypically healthy individuals. POAG results from abnormal outflow of aqueous humour through the trabecular meshwork of the vascular coat of the eye which develops at the same time as dermatoglyphics [34,35].

Dermatoglyphics In Congenital Disorders

In congenital heart disease (CHD) like Fallot’s tetralogy, patent ductus arteriosus, pulmonic stenosis, and atrial and ventricular septal defects, when compared to controls, there were altered digito-palmar dermatoglyphics like incidence of accessory triradii, missing of “c” triradius, increased TFRC, variations in palmar ridge counts (a-b, b-c, c-d, a-d and t-d, and significantly decreased t-d ridge count [36,37]. In congenital hand anomalies, particularly ectrodactyly and syndactyly, when compared to the controls, there were discriminative changes in the number of digital triradii, the position of an axial triradius, the pattern intensity, and the incidence of hypothenar patterns [38]. Fluctuating asymmetry (a significantly increased variation of the mean values) and increased incidence of ridge dissociation of digito-palmar dermatoglyphics were observed in patients with congenital vertebral malformations, suggesting an insult occurring during embryogenesis that led to these anomalies [39].

Dermatoglyphics In Diabetes Mellitus and Hypertension

In type 1 diabetes mellitus, predictive changes in digito-palmar dermatoglyphics were assessed in the form of decreased third finger ridge count and a-b ridge count, higher transverse position of the main palmar lines , increased frequency of palmar axial t' and t" triradii, and decreased pattern frequency in the fourth interdigital and thenar areas [40]. In hypertensive patients of both sexes, when compared to healthy controls, significant palmar dermatoglyphic alterations were observed like increased TFRC, decreased frequency of axial triradius t’ in female right palms and axial triradii t' and t" in male right palms, and decreased values of “atd” angle [41]. In black Malawian patients, the TFRC was used as a predictor of hypertension and the a-b ridge count as a predictor of concomitant diabetes mellitus and hypertension, in both sexes. Digito-palmar dermatoglyphics displayed absence of whorls in hypertensives of both sexes and in men with concomitant diabetes mellitus and hypertension. Also, there were significantly increased frequency of ulnar loops in hypertensive women and significantly decreased frequency of whorls in women with both diabetes and hypertension more than in women with hypertension alone [42]. In a different investigation, it was determined that the mean value of "atd" angle to be higher and the whorls to be significantly more frequent in hypertensives than in normotensives [43].

Conclusion

Epidermal ridges are developed, from ectoderm, in early embryonic period. Any deviation of their morphological patterns and frequencies may point out to genetic or environmental factors that also negatively impact other body systems. The usage of digito-palmar dermatoglyphics as biomarkers of predisposition to several dental and medical disorders could help in early detection and management of these diseases. It is emphasized that dermatoglyphics should not be used alone as a diagnostic tool but in conjunction with the physical examination of the patients.

Read More Lupine Publishers Otolaryngology Journal Articles:
ps://lupine-publishers-otolaryngology.blogspot.com/

Thursday, 7 January 2021

Lupine Publishers | Mouth Guards: Guardians of the Dontium

  Lupine Publishers | Journal of Pediatric Dentistry


Abstract

Children and teens are more prone to injuries while playing, with most of the impact taken by the face especially the jaws and the teeth. The most significant factor in preventing sports-related or recreational  orofacial injuries is wearing basic protective devices such as properly fitting helmets, face masks, or mouth guards. A mouth guard, custom-fitted by your dentist and worn every time you play or train, will protect against dental injury. Mouth guards are available in 3 different variants which are stock, self-adapting, custom-made mouth guards. The benefits far exceed the expenditure when considering the fees and discomfort associated with a traumatic dental injury

Keywords: Mouth Guard; Orofacial Structures; Teeth; Custom; Sports; Injuries

Introduction

Physical activity forms a very important part of life. There have been constant reports of sedentary lifestyle being associated with disease processes and over the time a lot of importance has been emphasized on physical activities be it the gym or the sports. Children and teens are more prone to injuries while playing, with most of the impact taken by the face especially the jaws and the teeth. Hence, it becomes very important to wear protective gear as these injuries might not only cause temporary impairment but also cause hindrance to the growth and development of the facial structures and also may lead to an unaesthetic appearance of the child at the later stage. The injuries occurring in sports can range from a simple ball-hit to a serious impairment of the head, face or the mouth. It is very important to wear protective gear when you are actively participating in any recreational outdoor events and also in some instances in the indoor activities with the risk of injuries. The most significant factor in preventing sports-related or recreational orofacial injuries is wearing basic protective devices such as properly fitting helmets, face masks, or mouth guards. The use of the mouth guard forms the basic minimal requirement for protecting your mouth, which should form an essential piece of the athletic equipment that the athlete should use as the standard gear equipment from a very early age.

A mouth guard, custom-fitted by your dentist and worn every time you play or train, will protect against dental injury. Well-fitted mouth guards prevent violent contact between the maxillary and mandibular dentition, which can result in soft tissue lacerations, tooth avulsions, tooth or bone fractures, endodontic injuries, and concussions [1]. This being said it has been found that injury to teeth are 60 times more likely when the athlete is not wearing the mouth guard than when he/she is wearing it. Statistically, sporting activities contribute to nearly one-third of all dental injuries [2-4]. Mouth guards help buffer an impact or blow that otherwise could cause broken teeth, jaw injuries or cuts to the lip, tongue or face. Mouth guards also may reduce the rate and severity of concussions Consequently, the dentist plays an important role in informing patients, athletes and their parents, and coaches of the importance of prevention, diagnosis, and treatment of orofacial injuries in sports and recreational activities [1].

A mouth guard should be able to fulfill the following basic requirements:

a) Encompass all maxillary teeth extending up to the distal surfaces of the second molars in class I and class II patients [4-7].

b) Encompass all mandibular teeth extending up to the distal surfaces of the second molar on class III patients [4-7].

c) Mouth guard may be abridged to cover until the distal surfaces of the first molars, in case it is known to trigger the gag reflex of the patient [4].

d) The labial flange should range to within 2mm of the sulcus [5].

e) The palatal flange should range around 2mm above the gingival margin [5].

f) The margins of the labial flange should be rounded.

g) The margins of the palatal edge should be tapered [5].

h) Be easy to clean [8,9].

i) Not impede with breathing or speech activity [4].

j) Be fabricated from a material approved by the U.S. Food and Drug Administration that can reduce the impact force to teeth, surrounding soft tissues, and bone [4,9].

k) Be comfortable and retentive and fit properly [9].

Mouth guards are available in different variants

A. Stock

B. Self-adapting

C. Custom-made

A. Stock

These are readily available over the counter in different sizes, made from polyurethane, a copolymer of vinyl acetate, or ethylene. As they are produced in bulk and are of standard sizes, they remain inexpensive, however they offer a low level of protection with little retention and is not so easily accepted by the athlete. The need to hold the mouth guard in place by clenching his or her teeth together is another disadvantage.

B. Self-Adapting

Also known as the “boil-and-bite” type mouth guard. It is readily available over the counter and made from ethylene-vinyl acetate (EVA). Herein, it is heated in hot water and then placed in the mouth to be adapted to the teeth by biting down. It is relatively inexpensive and can be replaced frequently in athletes with a mixed dentition or by individuals who are experiencing rapid growth. It has the property of re-adaptability. However, it is often bulky and does not retain its shape over time.

C. Custom-Made

The custom-made mouth guard is fabricated in a dental laboratory on a cast taken from an impression made by a dentist. The custom-made mouth guard offers the best fit and the most protection of any of the protective devices [4,5,9]. It is usually made of a thermoplastic material that is heated and adapted to the cast under pressure or with a vacuum form machine. Due to the laborious work involved in the fabrication of this type of appliance, it is expensive but retentive. The American College of Prosthodontists (ACP) recommends the use of custom mouth guards for all contact sports and for any recreational activities that may hypothetically end in orofacial injuries. Accurate maxillary and mandibular alginate impressions in centric occlusion registration recorded by a qualified dentist at approximately 5-mm opening anteriorly shall be used for fabrication of the custom trays as recommended by the ACP.4,5 The standard thickness is 4-mm, however 5- or 6-mm thickness is recommended as it will be able to protect the athlete better in case of extreme sports [4].

Mouth guards can be either single-layered or multi-layered. Currently, the most commonly used materials in the construction of custom mouth guards are EVA copolymer, soft acrylic resin, polyvinyl chloride, polyvinyl acetate-polyethylene (pEVA), and elastomers [1,8,9]. Many different designs of multi-layered materials are available. The most frequently used is a double layer made of similar materials. Dual laminated mouth guards possess an outer hard shell of styrolbutadiene co-polymerisate, and a soft inner layer of ethylene copolymer and vinyl acetate. This design of a more rigid outer material with an inner softer material will reduce the impact force transferred to the teeth due to the shock-absorbing capability of the softer layer [4,5]. The critical areas in terms of energy absorption and transmitted forces are the incisal edges of the anterior teeth and the attached (marginal) gingiva. Therefore, an optimal thickness of the device is achieved by the application of vacuum forming pressure-lamination technique of two layers of a thermoplastic sheet (EVA copolymer) and if necessary, by placing two layers of protective air-cells against the critical areas. An acrylic-resin-based elastomer may be processed over the thermoplastic sheet to improve protection for the athlete [4]. Custom-made mouth guards have proved to be the most effective means of prevention of injuries to the orofacial structures [1,4,5]. They are superior in quality, comfort, retention, and prevention of injuries when compared to stock or self-adapting devices. Although custom-made mouth guards are the most expensive type of protective oral device, they are the most highly recommended.

Conclusion

The benefits far exceed the expenditure when considering the fees and discomfort associated with a traumatic dental injury. Further, it becomes the duty of the dentist to create awareness among the athletes and make it a habit for them to wear mouth guard as a part of their equipment for sports.

Read More Lupine Publishers Pediatric Dentistry Journal Articles:
https://lupine-publishers-pediatric-dentistry.blogspot.com/

Wednesday, 6 January 2021

Lupine Publishers | Market Structure Conduct and Performance of Live Cattle in Borana Pastoral area: The Case of Moyalle District, Oromiya Regional State

   Lupine Publishers | Current Investigations in Agriculture and Current Research


Abstract

The Borana Pastoralists are known as major cattle supplier of cattle for domestic and international markets, yet the benefits they get from the sector is said to be minimal. This study, therefore, was initiated to identify market chain actors and their function in the market, investigate the structure Conduct and performance of live cattle in Moyalle District of Borana Zone. Both primary and secondary data were used for this study. Primary data were collected from 223 sampled pastoralists, 25 traders and 14 brokers. Before the household survey, key informant interview and focus group discussions were conducted using 10 producers, 5 traders and 3 brokers. Descriptive Statistics and qualitative data analysis techniques were employed to analyze the cattle market structure, conduct and performance. The result shows that producers, brokers, traders and consumers were the major cattle market actors. Two major channels identified in the area were formal and informal. Both the channels are also characterized by their sub-channels.

Among the formal channels, formal market channel is identified as the preferable marketing channel with better total final price share for producers. Regarding the market structure, cattle market is known to be dominated by few traders. Although the degree of competition varies, cattle market structure varies across cattle type marketed from loose oligopoly to strict oligopoly. This shows that only few traders share the majority of market share and earn abnormal profit. Besides, cattle market is characterized by entry barriers such as distant market point, high trucking cost, seasonality of marketing, information asymmetries and unfriendly relation between actors. These imperfect nature of the market in the district provoked informal trade. As the pastoralists mainly depend on cattle for their livelihoods and other cultural values, traders take advantage of the asymmetric market information towards them. Although it varies with the type of cattle, the larger share of the market gains remains with end of traders thereby limiting the pastoralists a chance to realize the economic gains in cattle production. Hence, linking producers to market and its benefits, establishing in cooperatives and development of infrastructure could play a significant role for optimization of the sector productivity.

Keywords: Cattle; Market chain; Pastoralists; Structure; Conduct performance

Introduction

Marketing is the answer to the underdevelopment of developing countries. When adopted and practiced, marketing will help to develop appropriate technologies as developing nations provide for the needs of the people and enhance their standard of living, create job opportunities, wealth for entrepreneurs, a means towards affording education and enjoyment of leisure [1]. In the Borena Area, cattle predominantly flow in a South to North direction, regardless of their market channel [2]. However, the Borena pastoralists are known as the major cattle suppliers for domestic consumption and international trade export, till yet they could not able to be benefited from the sector due to impediments. The lengthy marketing process, high transaction cost, informal cattle trade and the like has been one of major obstacles that caused country to lose a lot of foreign currency. In addition to these, over exploitation of brokers, weak and unfriendly linkage in between the major marketing actors, lack of market-oriented cattle production is some of the main challenges.

To improve the competitiveness of cattle in pastoralist area cost-effective marketing channels and coordinated market chains, which reduce the transaction costs among different actors along the chain are crucial [3]. Majority of cattle marketing information in the pastoralist level is outdated, unreliable and as the result it couldn’t able to provide the real picture of the economic contribution of pastoralists sector for the country economy and the community engaged in the sector. More over these, the critical problem in cattle marketing sector stands in the course of formulating appropriate policies and procedures for the purpose of increasing marketing efficiency in the sector. For the pastoralists’ community undertaking research on structure conduct and performance of cattle is believed to enhance its productivity by locating economical cattle marketing routes. Available evidence shows that limited numbers of investigations have been made on local and regional cattle markets in pastoralist area and the market chain is dominated by many brokers at primary, secondary and terminal markets [4].

Most studies of market chain tend to focus on market chain of the cattle at aggregate level than dealing the market chain of individual cattle types. The present studies try to link this gap by disaggregating the cattle into various types to see the market chain opportunities and problems for each type of cattle separately. Therefore, this study will provide relevant information with respect to the value chain of various cattle types by

a) Identifying the major market actors and their function of cattle market,

b) Identifying the marketing channels,

c) Examining the market structure, conduct and performance.

Methodology

The Borana administrative zone is situated in Ethiopia’s Oromia regional state and located in Southern part at about 570 km (Yabalo town) from Addis Ababa. The capital of Borana zone is Yabello [5]. The Borana zone is made up of 13 districts, divided between two agro-ecological zones, the semi-arid lowlands to the south and the more humid lands at higher altitudes to the north [6]. Moyale is one of the Woredas in the Oromia regional state. It is located 770 km south of Addis Ababa. The Woreda has an area of 14,810 km2 and it is divided into 18 kebele 2 of which are located in Moyale town [7]. It splits the two countries: the larger portion being in Ethiopia (in the Oromia Region and Somalia region) and the smaller in Kenya (i.e. the capital of the Moyale district). It is a busy market for both informal and formal trade of food commodities and livestock [8]. In this study both secondary and primary data was used from different sources. Journals, books, proceedings, CSA and ESAP publications were secondary data sources that used in the study. Primary data sources include Pastoral household interview, traders’ interview, brokers interview and key informant interview.

The study used commodity chain analysis (CCA), which involves mapping the market chains, involved in particular production sectors, different types of activity, geographical location and actors in different roles at different levels. The major market costs considered in the study include, cost transporting, brokering cost, marketing levies and taxes imposed by local authorities [9]. For this particular study two stage sampling techniques was used. Factors like number of live-stock kept, income difference, gender, age of pastoralists, major function of actors in cattle marketing, proximity to major marketing centers and other important economic variables were important issued while selecting the representative households in the districts. The producers interviewed in the study were pastoralists. Both traders and brokers were selected purposely and interviewed. The random probability sampling techniques was used for selecting the representative producer households from the area.

Two stages sampling technique was used for selection of pastoralists Kebele identification that made through secondary data of pastoralists development office. Three Kebeles from the pastoralist area were considered in the survey. Respondent sample size per each Kebele was determined proportionally to the number of total households in the area. The sample size determination techniques employed was Rule of Thumb Techniques that estimate by using the following formula:100% for 0-100 populations,10% for101-1,000 populations, 5% for 1,001-5,000 poulations,3% for 5,001-10,000 population and 1% for more than 10,000 respectively [10]. Based on this technique the sample size of pastoralists household interviewed from respective kebels, Maddo, Maddo Miggo and Laga Sure were 100, 63 and 60 respectively. The survey study at woreda level considered 167 male (74.9%) and 56(25.1) female household heads. The sample size of male and female household heads interviewed in Maddo kebele was 78(78%) and 22(22%).

The number male and female respondents interviewed in Laga Sure kebele was 45(75%) and 15(25%). From whole interviewed respondents in Maddo Miggo Kebele 69.8% (44) was male and 30.2% (19) female. The sample size of traders and brokers was 25 and 14. Descriptive statistical analysis such as mean, mode, percentage and standard deviation of important economic variables considered in collecting information was used to analyze data. Data was analyzed using Statistical Package for Social science (SPSS Verstion.20) and Excel 2007. Besides, qualitative data obtained from focus group discussion, key informant interviews and observations were categorized into similar themes, looked for relationships and interpreted.

Results and Discussions

Socio-Economic Characteristics of Pastoralists

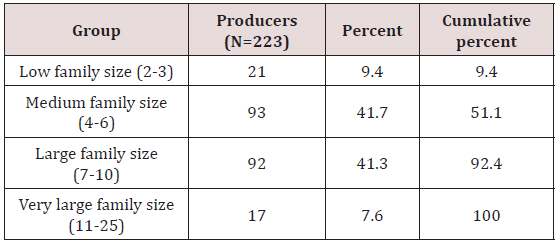
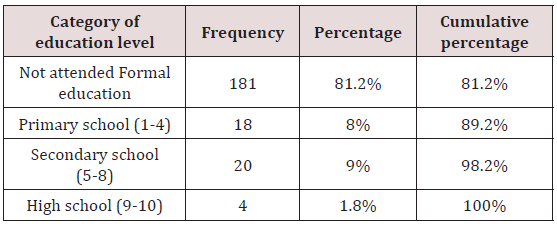
The average age of the Pastoralists household head was 42. However, it ranges in between 20 and 81. The majority of them (96.9%) are in economically active age group in the age range of 20 and 65 years. The family size distribution Table 1 shows that the average family size of Moyalle pastoralists is 7 but it ranges between 2 and 25. The majority of the households have medium and large family size. Those households with very large family size are characterized by polygamous family. The small family size households were young couples. Table 2 revealed that 81.2 percent of sampled households did not attend formal education whereas; the proportion of pastoralist household who attended formal education was 18.8%. The distribution of pastoralist households with respect to formal education attendance shows that less than one fifth they attended formal education. However, study by [11] in Yabello district shows that the proportion of pastoralists who attended formal education is by far greater (41.7 %).

Table 1: Family size of sampled producers.

Lupinepublishers-openaccess-Agriculture

Table 2: Education level of Pastoralist household head.

Lupinepublishers-openaccess-Agriculture

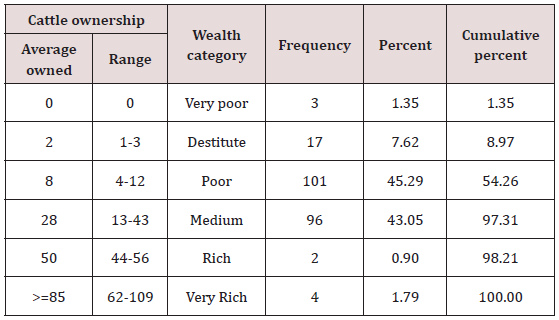
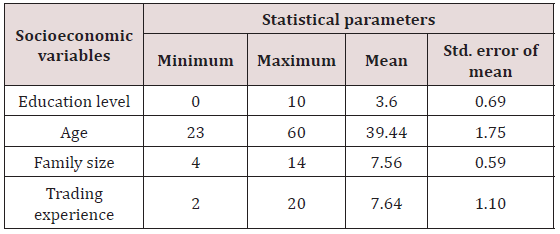
This could be due to the fact that the Moyalle District pastoralists area are less accessed to market capacity development services and infrastructures in relation to other districts in the Borana zone. The majority of households owned cattle in the range between 4 - 12 (45.29%) cattle per head. These are poor category households. This is closely followed by medium category households 43% and own 13 - 43 heads of cattle. The rich and very rich households’ own cattle heads that range from 44-56 and 57-109 respectively. However, the proportion of these households is less that 3 percent. Other study by [12], however, revealed that from the total respondents’ pastoralists in Yabello area about 7 percent were reported to be rich, 10 percent medium, 17 percent poor, and 66 percent were destitute. The socioeconomic profile of cattle traders shows that all (100%) of them were male with a mean age 39.44 years that range between 23 and 60 years. The result shows that all the cattle traders are in the bracket of active age category.

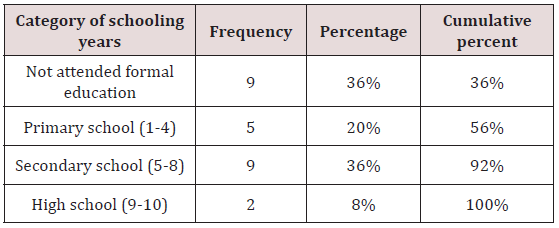
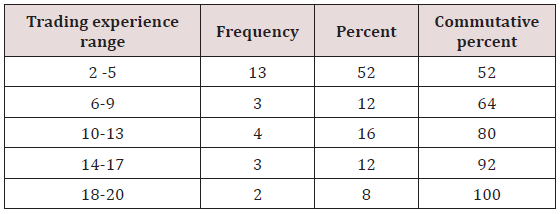
Unlike the pastoralist’s category, the proportion of the traders who attended formal education is nearly two third (64%). This means that about 36% cattle traders were illiterate, 20% attended primary school (grade 1 to 4) and 36% attended junior school (grade 5 to 8) and 8% attended secondary high school (grade 9 up to 10) respectively. This implies that in cattle trading, the importance of education cannot be over-emphasized, for it determines information dissemination and technology adoption among marketers in diverse socio-economic and biophysical environment [13]. Contrary to their education profile, the majority of the traders (52 percent) were with trading experience of less than five years. This reveals due to the infrastructure and development of policy that is relevant to cattle trade, currently attracting more traders. The study results (Tables 3 & 4) observed confirmed also that the mean trading experience for sampled traders in the area was 7.64 years. The general trading experience of interviewed traders ranges between 2 to 20 years. The percent of cattle marketers that had marketing experience ranging from 2 to 5 years, 6 to 9 years and 10 to 13 were 52%, 12% and 16% respectively. The proportion of cattle marketers that had marketing experience of 14 to 17 years and 18 to 20 were 12% and 8% respectively. Hence, the results revealed that majority of cattle traders in the area are highly experienced.

Table 3: Cattle ownership with respect to wealth Classification.

Lupinepublishers-openaccess-Agriculture

Table 4a: Years of Schooling for traders.

Lupinepublishers-openaccess-Agriculture

Table 4b: Experience of cattle traders.

Lupinepublishers-openaccess-Agriculture

Structure Conduct and Performance of Cattle Marketing

Market Structure of Cattle

a) Major Actors and Their Function in Cattle Market

Cattle market structure in Moyalle district of Borana zone is characterized by diverse actors including pastoralists, local collectors, brokers, traders, hotels and restaurants. Each actor has its own function. Pastoralists are the first actors of in the market chain of cattle. Some of major duties and responsibilities of pastoralists include supplying healthy and quality cattle. Brokers are important actors in the market chain of cattle and they play facilitation of market process, market information provision, price setting, and acting as delegates of traders such as making agreement between sellers and buyers [14]. Traders’ role is purchasing, price setting, giving final market price, controlling marketing process and market information provision.

b) Major Channels

With respect to marketing channel, both formal and informal cattle marketing channels exist in the area. As traders pay taxation fee for respected organization in the chain, cattle traveled to central Ethiopia referred as formal market channel. But, Cattle traders those trek cattle from Ethiopia to Kenya do not paying tax and transport through unknown route, the specific market chain defined as informal market channel. Both channels are dominant as in relation to proximity and long-lived history, pastoralists are accustomed to informal market channel. The formal market channel is a newly developed one and it has different sub channels.

Channel I:Pastoralist-Broker-Small Trader-Formal exporter. This cattle market channel is one of formal market channel and practiced by few pastoralists. Here, pastoralists sell to brokers and brokers sell to small traders. The small traders purchase from brokers and resale to formal exporters that come from central Ethiopia cities. Due to infrastructural development and relatively better security in current years, this market channel developed newly in the district. This sort of cattle market channel is experienced by about 5% pastoral households and observed as new opportunities.

Channel II: Pastoralist-Broker-Collectors-Informal Exporter. In this cattle market channel pastoralists sell their cattle to brokers and brokers sell to collectors. Here, collectors purchase cattle from brokers and resell to informal exporters. This market channel has long life history in the district and used to be the only route of cattle marketing before five to ten years ago. This channel is experienced by about 46% of pastoralists’ households in the district.

Channel III: Pastoralist-Collectors-Informal Exporter. This cattle market channel is one of usual market channel. Brokers are not used as mediator in but the small/medium traders in this market channel purchase from producers directly and resell to informal exporters. The proportion of sampled pastoral households accustomed to use this sort of cattle market channel amounts to 4%.

Channel IV: Pastoralist-Brokers-formal Exporter. In this channel the producers sell cattle to brokers and brokers sell cattle to formal exporters and experienced by 2% of pastoralists. This cattle market chain was also identified as newly introduced chain to the area. This sort of market chain should be appreciated and have to be due attention to boost production and productivity of cattle [15]. Here, producers undertake cattle marketing through broker mediating process to other formal exporters and consumers. Ethiopian universities and air lines institutions that come seldom to the area are some listed formal cattle buyers.

Channel V: Pastoralist-broker-informal trader. This market channel is one of channel that identified as informal. Here, Pastoralists sell cattle to brokers and brokers sell to informal exporters that come from Kenya. The proportion of interviewed pastoralists that are engaged in this type of cattle market amounts 2%.

Channel VI: Pastoralists-Other Pastoralists. In this cattle market channel pastoralists sell cattle to other pastoralists and it is known for restocking and usually undertaken around farm gate. The major aim of this market chain is replacing the aged cattle. The proportion of pastoralists that depend on this type of cattle market channel amounts to 12%. Cattle category marketed in this channel comprised of calves, heifer and bulls. Pastoralist households undertake marketing activity in this route by friendship, kinship and neighborhood pattern.

Channel VII: Pastoralists-Broker-Festival Consumer. This channel is one of the oldest and informal institutional based channels. Here the producers sell cattle to other producers, consumer traders, urban dwellers and newcomers from surrounding highlands. The purpose of buyers of cattle is for festival consumption. The proportion of pastoralists households take part in this cattle market channel is 14% of interviewed pastoralists.

Channel VIII: Pastoralists-Broker-Butchers. This is also referred as newly developed value addition channel that formed due to existence of smuggling activity and settlement of peoples from other areas for this activity. Out of interviewed respondents Pastoralist 15% of the households of sell cattle to brokers and brokers resell the cattle to butchers. this is also referred as newly developed cattle market channel that created in recent years as new market opportunities due to mobilization of peoples to the surrounding and smuggling activity that become job opportunities for majorities. This result tells about how the cattle market chain complicated by lengthy routes that hinder not to exploit the resource at pastoralists district by producers and tilted the market toward informal trade. This study calls for systematic intervention for cutting off unnecessary market route and adopting legalized market channel toward the vicinity African countries. As indicated in the (Table 5) above (5) the market structure shows distinctive features according to cattle type marketed. Market structure for oxen, heifers and calves trade is tight oligopoly but it is a loose oligopoly for cows and bulls trade. Since heifers and calves are often marketed among pastoralists and rarely by informal traders and not by formal traders, the market structure is tight oligopoly.

Table 5a: Socioeconomic characteristics of traders (N=25).

Lupinepublishers-openaccess-Agriculture

Table 5b: Summary of Market structure for Cattle Trading.

Lupinepublishers-openaccess-Agriculture

In addition to these, calves are unable to trek long distance in the marketing route, they are not preferred by market actors. The market structure for oxen trade tight oligopoly, because pastoralists supply at bull and oxen are usually demanded only in limited festivals. The implication of this is that market actors want ox at bull stage in order to exploit value added in the chain and easily trek/truck the bulls. Consequently, traders in the area undertake marketing activity having been closely creating market relation so as to exploit benefits that belongs to producers. In addition to these, bulls trade encompasses various market actors such as informal traders, formal traders, hotels and restaurants and festival consumers, the market structure is relatively loose oligopoly. The cow trade is also including various market actors such as pastoralists and informal exporters; its market structure is loose oligopoly. This point out that tight oligopoly reduces competition and the entire market remains a “few traders game” where created wealth does not flow to all the beneficiaries in equitable ratio. Arguably, it should again be noted that failure to enjoy such benefits may distort market operations and eventually lead to collapse of the cattle production system. This calls for systematic government intervention in the sectors that could mitigate imbalance of trade benefits and help to optimize productivity through market linkage formation, adoption of value addition and development, update market information provision and cooperative formation.

c) Entry and Exit Conditions in the Cattle Market

The long market distance from pastoral areas to central towns of Ethiopia and the related high trucking cost, high capital demand, institution-based marketing and information asymmetries are some of the major entrance and exit barriers in cattle trade in the area. The number of cattle supplied to market in holidays, religious festivals and weeding occasions are also higher than that of other seasons. In order to undertake marketing activity directly; it is must to speak local language. So as to take part in cattle trade, it is also must secure large amount capital for purchasing cattle, trucking and trekking.

Market Conduct

Market Conduct refers to the strategies adopted by a player as a way of adjusting to the market conditions in order to fully enjoy the market benefits. Notably, it includes mechanisms such as price setting and terms of payment.

a) Price Setting Mechanisms

The price setting activity of cattle in pastoralist area is known to be accomplished by various actors in the market. About 62% of pastoralists confirmed that price of cattle is set by brokers based on initial price given by sellers and final price from buyers. The proportion of pastoralists recognized determination of price by buyers based on central market information, by brokers based on central area information and sellers by their own respectively is 22%, 10% and 6%. This shows that market actors had different level of influence in the role they played for setting price. It is observed that every aspect of price setting mechanism majorly is controlled by traders. This means that price setting in cattle market is often skewed toward traders and brokers. The result indicates that traders undertake non-price competitions including cattle type, trade experience, personality, financial capacity and language. The implications of this market structure are few potential traders’ accounts for large market share, market dominance by these top four traders, interdependency and collusion possible.

b) Terms of Payment for Producers

Both the household survey and key informant interview reveals that the cattle marketing by pastoral households has been undertaken in inform of cash or hand by hand currency. The proportion of producers who indicated cattle marketing carried out in the form of direct cash payment is 96%. The remaining 4% of the pastoralists marketed both in credit and hand in hand cash payment before three to five years. This justified that almost all producers market their cattle inform of direct cash transfer in current years. The main reason for ceasing of cattle trade in form of credit from previous years to current is loss of certain capital due to credit. This means that market actors in the area assured that before five-year certain informal traders had purchased cattle in form of credit did not repay the credit back. This phenomenon had ceased credit marketing system in the district.

Market Performance

Market performance refers to the impact of structure and conduct as measured in terms of variables such as prices, costs, and volume of output. Analysis of the level of marketing margins and their cost components could help to evaluate the impact of the structure and conduct characteristics on cattle market performance. The marketing margin of cattle is the difference between the revenue from the sales of cattle and the costs incurred in running the market operation. The net marketing margin of cattle (NMM) is also the percentage over the final price earned by the intermediary as his net income once his marketing costs are deducted and is one of the best tools to analyze performance of cattle market. Marketing margin was calculated taking the difference between producers and formal exporter or informal trader prices. Mathematically, producers share expressed as: PS=Pp/Pt = 1-MM/Pt where PS=producers share, Pt=price of traders, and MM= market margin.

In general, producer’s share of final price in formal channel higher than that of informal, which points out that formal route is preferable for them. Since traders and brokers obtain relatively better market margin in informal route, it is difficult to compete for formal traders with informal traders in the district. In contrary to free market economy, market concentration ration and market margin estimated for cattle market shows oligopolistic nature. It therefore means that the formal or informal market cattle traders do not bare full cost involved in the market thereby leading relatively low marginal costs. This is to mean that the cattle market is disintegrated in such a manner that price levels does not relay from the cattle keepers to the terminal market traders. Indeed, it is observed that the principle of free market through bargaining is distorted once a new market entrant is discovered. For example, buying at a relatively fair price requires one to have known the local language at the farm gate market, security and cattle type marketed (non-price competition).

This means that without close relation with the market brokers; one is subjected to price discrimination. Since the market is flooded by brokers at all the chain terminals; it is very difficult to assess the efficient market price and general information. It was observed that there exists larger number of market brokers both for different live cattle and in many cases; the brokers hold much needed information so as maximize on the commissions. Monopoly market structure violates the principle of equity between the traders and the pastoralists. This is because the larger share of the market gains remains with end of chain traders thereby denying pastoralists a chance to realize the economic gains in cattle production.

Comparison of Market Margin Across Cattle Type and Marketing Channels

The market performance of cattle marketed varies across cattle type marketed and the type of channel used. The empirical result in Tables 2 & 6 indicates that the cow traders earn highest net market margin but, calve traders earn lowest net market margin in formal channel. The level of net market margin earned in informal channel is highest for ox traders, while it is lowest for calves. The proportion of producer share of final cattle price from informal market channel is 18% lower than that of formal. This indicates that it is advisable for producers to market cattle though formal channel, while it is good for trader to use informal channel that is well developed in value addition practices and linked to the largest east Africa market point, Nairobi, which by its own make difficult to compete for formal traders with informal channel that has higher market margin (Table 6).

Table 6: Comparison of Market Margin across cattle type and marketing channels.

Lupinepublishers-openaccess-Agriculture

Conclusion

Almost all market structure of cattle in the area shows the noncompetitive nature. The market concentration ratio for top four cattle trader is ranged between 43.03 and 95.02. The estimated HI index is between 1013.39 and 2702.31. This concentration ratio indicates that the market structure of cattle is imperfect, and the competition is among the few traders. This few large traders share majority of market share and earn abnormal profit. This could be one of the suspected reasons for producers for shifting from cattle to camel and small ruminants and low productivity of the sector. Hence, it is must for systematic government intervention to minimize exploitation benefits by trader’s that belongs to producers through cooperative establishment. For each cattle type there are formal and informal market channels. Among the channels the first formal channel was identified as the preferable marketing channel that has higher and better total final price share for producers. The monopoly nature of the terminal cattle market denies the efficient market principles that forces producers not to optimize productivity.

The analysis of the marketing costs and margin revealed that brokers incurred the lower marketing cost and traders the higher marketing cost in all cattle type. The market cost of trader and broker in informal market channel is higher than formal. Marketing margin of traders and brokers is different along different channels. Traders and brokers get relatively better profits in informal channels. This could be the reason for most traders to participate in informal channel. The producers’ share of final of cattle is relatively better in formal channel for producers. The study indicated that it is better for producers to sale cattle at formal channel, where they could optimize their benefits through cooperative and reduced transaction costs. By summing up, contrary to free market economy, market concentration ratio and margin estimated shows oligopolistic nature. It therefore means that the formal or informal market traders mainly for cattle do not bare full cost involved in the market thereby leading relatively low marginal costs.

By intuition therefore, it means that the cattle market is disintegrated in such a manner that price levels does not relay from the cattle keepers to the terminal market traders. The monopoly power in this case lies with the informal traders who are at the end of the chain. Since the pastoralists purely depend on cattle for their livelihoods, it was noted that traders take advantage of the market information to exploit the keepers through price discrimination. It was observed that there exists larger number of market brokers both for different live cattle and in many cases; the brokers hold much needed information so as maximize on the commissions. It is also observed that monopoly market structure violates the principle of equity between the traders and the pastoralists. This is because the larger share of the market gains remains with end of traders thereby denying pastoralists a chance to realize the economic gains in cattle production.

Read More Lupine Publishers Agriculture Journal Article:

Tuesday, 5 January 2021

Lupine Publishers | Hydraulic Ram-A Boon to Irrigate in Hilly Areas

  Lupine Publishers | Current Investigations in Agriculture and Current Research


Abstract

The hydraulic ram, sometimes abbreviated hydram. It is a simple automatic device which utilizes the kinetic energy of water falling a moderate height to raise a part of it to a much greater height.

Where it can be used

The device can be used wherever a stream of water flows with a minimum of about 1m fall in altitude.

History

The first working model of a hydraulic ram was developed by Montgolfier in the year 1796.

Introduction

Like the windmill, the hydraulic ram experienced a period of popularity in industrialized countries, followed by a decline due to the large-scale development in generation and distribution of economical electrical energy. In developing countries, however, the difficulty in conveying electrical energy to remote hilly areas and the shortage of petroleum fuels have focused the importance of hydraulic rams for small-scale lift irrigation and rural water supply.

Hilly areas are often deprived of irrigation facilities due to uneven topography and non-availability of conventional sources of energy. Studies shows that hydraulic rams as a potential means of irrigation in the hilly areas. Hydraulic rams could also be used with advantage in the hilly regions of most states in India and other developing countries. The source of supply of water for operating a hydraulic ram may be a stream, a spring or an irrigation canal. In the mountainous regions of India and other developing countries, there are numerous sites where hydraulic rams could be installed, thus reducing human drudgery in carrying head loads of drinking water along steep slopes or turning unproductive and unused lands to efficient farming units. The simplicity of construction and the automatic operation of the hydraulic ram make it especially adapted to remote rural areas which often have problems of nonavailability of commercial energy sources such as electricity and diesel and lack of skilled technicians for maintenance and repair of engines/motors and pumps.

Specific applications of hydraulic ram

a) To lift a part of the flow of hillside spring, stream, rivulet to irrigate adjacent slopy lands.

b) To lift water for drinking water supply in villages.

c) To provide water supply to small industrial establishments and fish ponds located in hilly areas.

d) To feed water to a high-level field channel by installing the ram downstream of a weir or drop structure in a canal system. This will increase the command area of a canal system.

e) To boost the discharge of lift irrigation schemes using engine or electric motor operated pumping sets, to take a part of the pump discharge to higher elevations for irrigation.

Principle of operation

The hydraulic ram works on the principle of the water hammer (Figure 1). The water hammer is a phenomenon resulting in an instant rise in pressure of the water flowing in a pipe, due to sudden stoppage of the motion. The cycle of operation in a hydraulic ram is as follows. The ram is started by opening the gate valve on the drive pipe. Water flows from the supply source, through the drive pipe, to the waste valve. The waste valve being open, water is free to escape, and flow is set up along the drive pipe. The velocity of flow is increased under the influence of the supply head, until the dynamic pressure on the side of the waste valve becomes sufficiently great to overcome its weight. The valve then closes rapidly. The supply column suffers a consequent retardation which gives rise to rapid increase of pressure in the valve box. This opens the delivery valve into the air vessel, compresses the air in it and water escapes through the discharge pipe. As soon as the momentum of the supply column is spent, the compressed air and the water under pressure closes the delivery valve. A backward motion of water occurs in the intake chamber and drive pipe, causing a negative pressure in the valve chamber. The waste valve, which is hinged on a steep angle in the valve box, falls back due to the vacuum and its own mass and allows water to flow out. As the velocity of water in the drive pipe increases, the gate valve again closes suddenly, and the cycle is repeated. The frequency of operation varies from 25 to 100 times a minute. In order to develop maximum impulse, the supply pipe should be as long as possible.

Figure 1: Hydraulic Ram.

Lupinepublishers-openaccess-Agriculture

1.Discharge pool, 2. Discharge pipe, 3. Air vessel, 4. Waste valve, 5. Delivery valve, 6. Supply pipe,7. Supply channel, H=Supply head, hd =Delivery head

Advantages

a) The hydraulic ram is simple in construction and operation.

b) It does not incur any running cost, as it utilizes the energy of water available freely, and no fuel or electricity is required.

c) It has only two moving parts, the waste valve and the delivery valve, both of which are lubricated by the water itself. Thus, no separate arrangement for lubrication is required.

d) It ensures continuous water supply, as it operates throughout the day and night.

e) It works efficiently over a wide range of flows in the supply stream.

f) It does not cause any pollution.

Disadvantages

a) For the installation of hydraulic ram, a minimum fall of 1 m from the stream to the ram is required.

b) The hydraulic ram can lift only a small part of the flow which is fed to it (Generally 1/20th to 1/10th of the water supplied through to drive pipe).

c) Since the ram works all 24hours in a day, a storage tank is necessary to store the night supply.

d) Due to comparatively high initial investment, it is more adapted to ownership by small groups of farmers who can share the water amongst themselves, or by public agencies under water supply schemes.

Size of drive pipe

The size of the drive pipe is so designed that the rate of flow of water through it is at least three times the rate of discharge through the delivery pipe. The approximate size of the drive pipe may be computed from the following relationship:

D=√{0.5(Q+H)}-………………………3

Where D= diameter of the supply pipe, m

Q and H are as defined earlier

The range in values of the length of the supply pipe is estimated from the following relationship:

L=1.5(hd-H) to 3(hd-H)

A thumb rule commonly used to keep the ratio of diameter to the length of drive pipe as 1:500. Longer drive pipes do not increase the efficiency of the ram substantially but permit the pump to operate at less strokes per minute, which results in less wear to the valve and longer operating life. Heavy galvanized pipes with leak proof points are essential for the drive pipe as it has to withstand high pressure due to water hammering. The drive pipe should be straight, as far as possible, and without any elbows. Generally, the size of the drive pipe and that of the intake of the ram are kept the same.

Delivery pipe

The discharge of the hydraulic ram is inversely proportional to the delivery head. The discharge pipe may have a uniform size if the water is tapped only at the highest point. If, however the water is to be taken out at intermediate points, a variable size delivery pipeline may be used. A larger size pipe is used in the lower section to reduce the head loss by friction and to obtain a higher rate of discharge. The pipe size may be reduced to steps at each point the flow is tapped. The size of the delivery pipeline is to match the magnification factor and the size of the supply pipe approximately, as follows:

Lupinepublishers-openaccess-Agriculture

Medium quality galvanized iron, rigid PVC or high-density polyethylene (HDPE) pipes may be used for the delivery pipeline. In case of polyethylene pipe, it is desirable to lay it underground to ensure durability. Bursting of the delivery pipe due to poor quality is common cause of failure of hydraulic ram installations. BIS standards are a good guidance in selecting HDPE, PVC, GI pipes. In high head installations, it may be advantageous to have the lower 1/3rd or half length of the pipeline of GI, and the rest of HDPE, in view of the ability of the GI pipe to withstand high pressure. If the delivery pipe has any high points or abrupt turns where air might get trapped, an air valve or air vent is necessary.


Read More Lupine Publishers Agriculture Journal Article:

Friday, 1 January 2021

Happy New Year!!!!


Wishing you a Happy New Year with the hope that you will have many blessings in the year to come. This upcoming year will give us the opportunity to start afresh and work towards rebuilding the world after the pandemic and even bettering ourselves in order to avoid such global suffering again. On a lighter note, the New Year celebration is a time for joy, great pomp and show across the world.